Ethereum traders, watch THESE metrics as ETH hits rare accumulation zone

ambcryptoPublished on 2026-07-11Last updated on 2026-07-11

Abstract

Ethereum (ETH) has entered a rare historical accumulation zone, as indicated by its Market Value to Realized Value (MVRV) ratio falling below 0.8. This level has previously signaled major market bottoms. While this suggests long-term undervaluation, recent exchange net inflows of $62.64 million show more ETH entering trading platforms, implying investors seek flexibility rather than long-term holding. Derivatives data reveals increased Open Interest but softer Funding Rates, pointing to measured optimism among leveraged traders. Technically, ETH has reclaimed the $1,800 support level, with its Relative Strength Index recovering from oversold conditions. The key for continued recovery is maintaining this support; failure could lead to a retest of lower levels near $1,564. Overall, the market presents mixed signals of attractive valuation countered by ongoing investor caution.

Ethereum’s Market Value to Realized Value (MVRV) Ratio fell below the critical 0.8 threshold, placing the altcoin in a historically rare accumulation zone.

The on-chain metric suggested ETH traded below its realized value, a condition that previously appeared during major market bottoms.

According to the data, similar readings emerged in December 2018, March 2020, and June 2022 before Ethereum established cycle lows. That historical context renewed attention among long-term investors despite the absence of an immediate bullish catalyst.

However, the metric reflected valuation rather than future price direction. Instead, it suggested seller exhaustion had intensified after months of weakness.

As a result, Ethereum entered another period where long-term value investors historically became active, while broader market participants continued weighing macroeconomic uncertainty against improving blockchain fundamentals.

Inflows outweighed withdrawals despite recovery

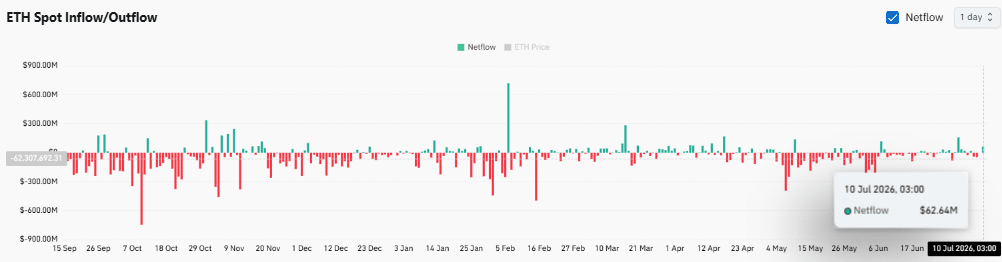
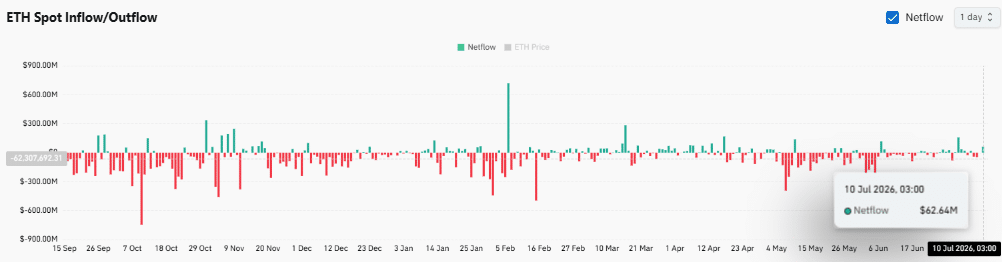
Spot flow data showed Ethereum recorded Exchange Netflows of approximately $62.64 million during the latest session. That reading indicated more ETH entered exchanges than left them, even as price stabilized above recent lows.

Such activity often reflected investors preparing assets for trading rather than demonstrating outright accumulation through exchange withdrawals.

However, the inflow remained relatively modest compared with larger historical spikes visible on the chart, suggesting exchange activity had not reached panic levels.

Meanwhile, Ethereum maintained its recovery without triggering aggressive selling pressure across spot markets.

The combination revealed a market that continued supplying exchanges with liquidity while buyers absorbed available inventory.

That balance prevented excessive downside pressure, although it also suggested traders remained willing to reposition holdings instead of committing entirely to long-term storage.
Source: CoinGlass

Leveraged traders increased their exposure despite softer funding

Derivatives activity strengthened as market participation expanded across perpetual futures.

Open Interest climbed 3.25% to $11.1092 billion, showing traders increased outstanding positions while Ethereum stabilized near current levels.

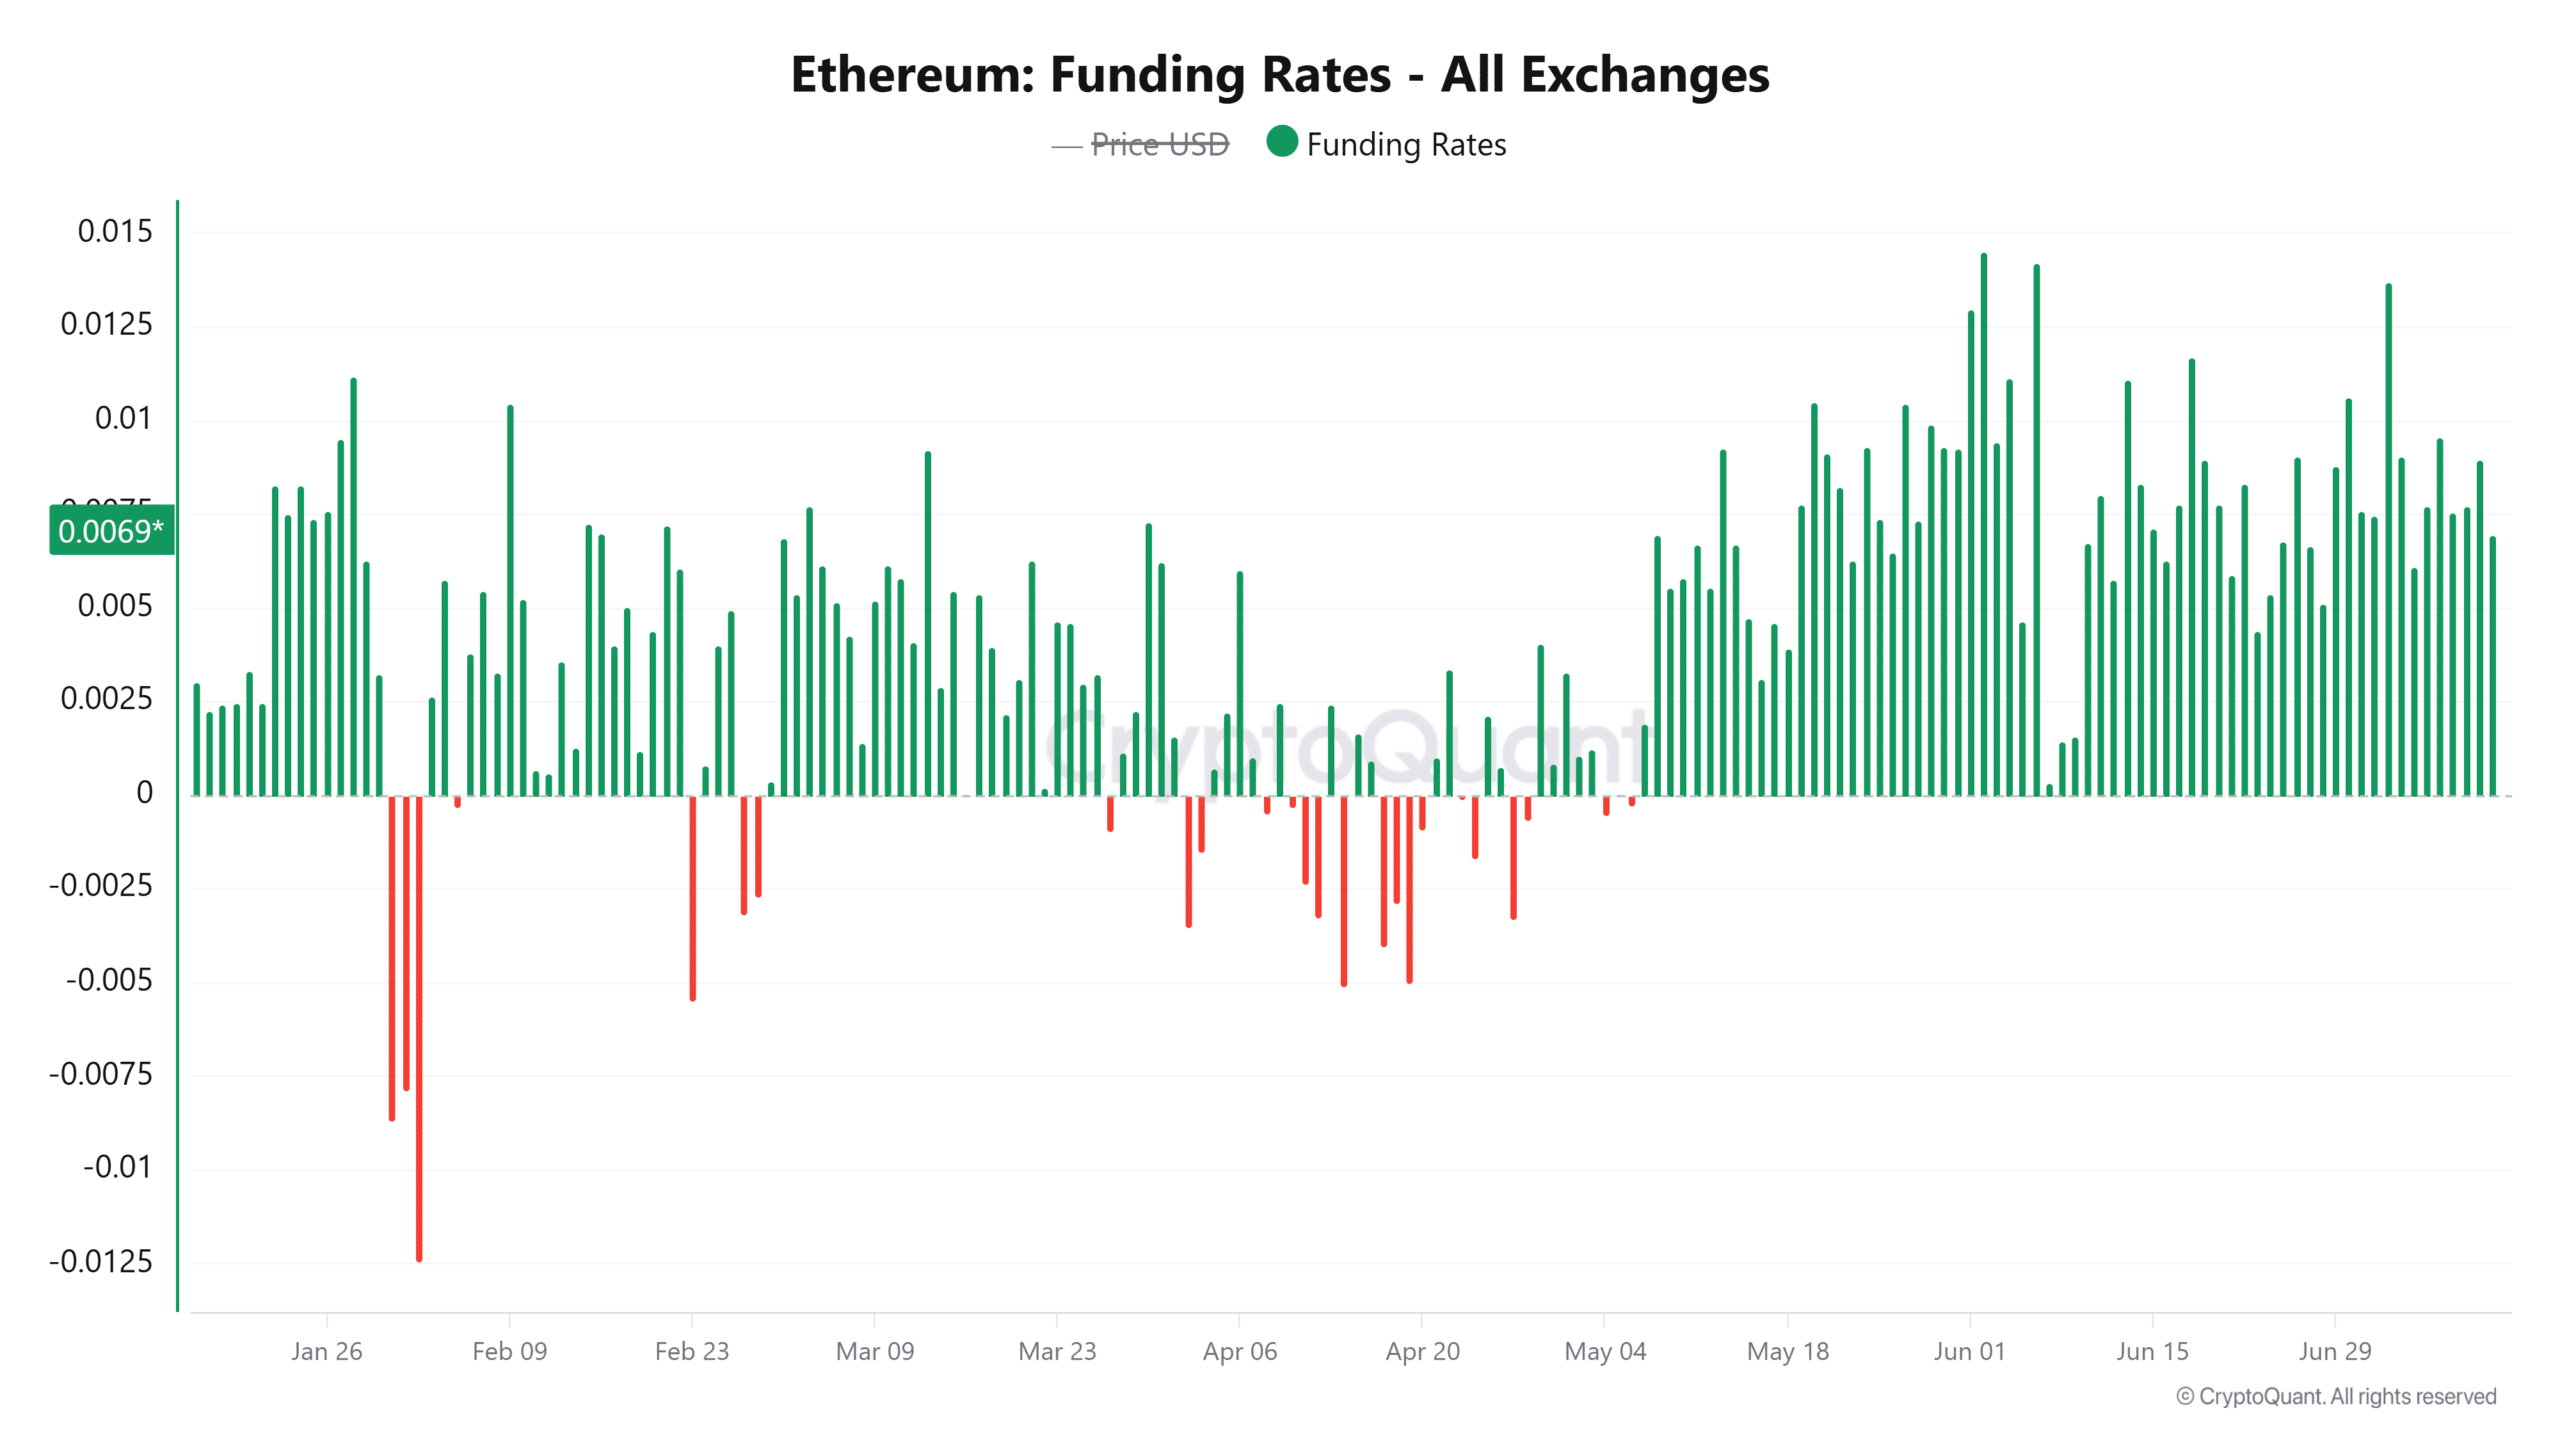
Funding Rates remained positive at 0.00699, although the metric declined 25.41% over the previous 24 hours. The combination indicated long traders still paid a premium to maintain positions, but bullish conviction eased compared with the prior session.

Instead of unwinding exposure, participants continued adding contracts while accepting a lower funding environment.

The derivatives market, therefore, reflected measured optimism rather than aggressive speculation.
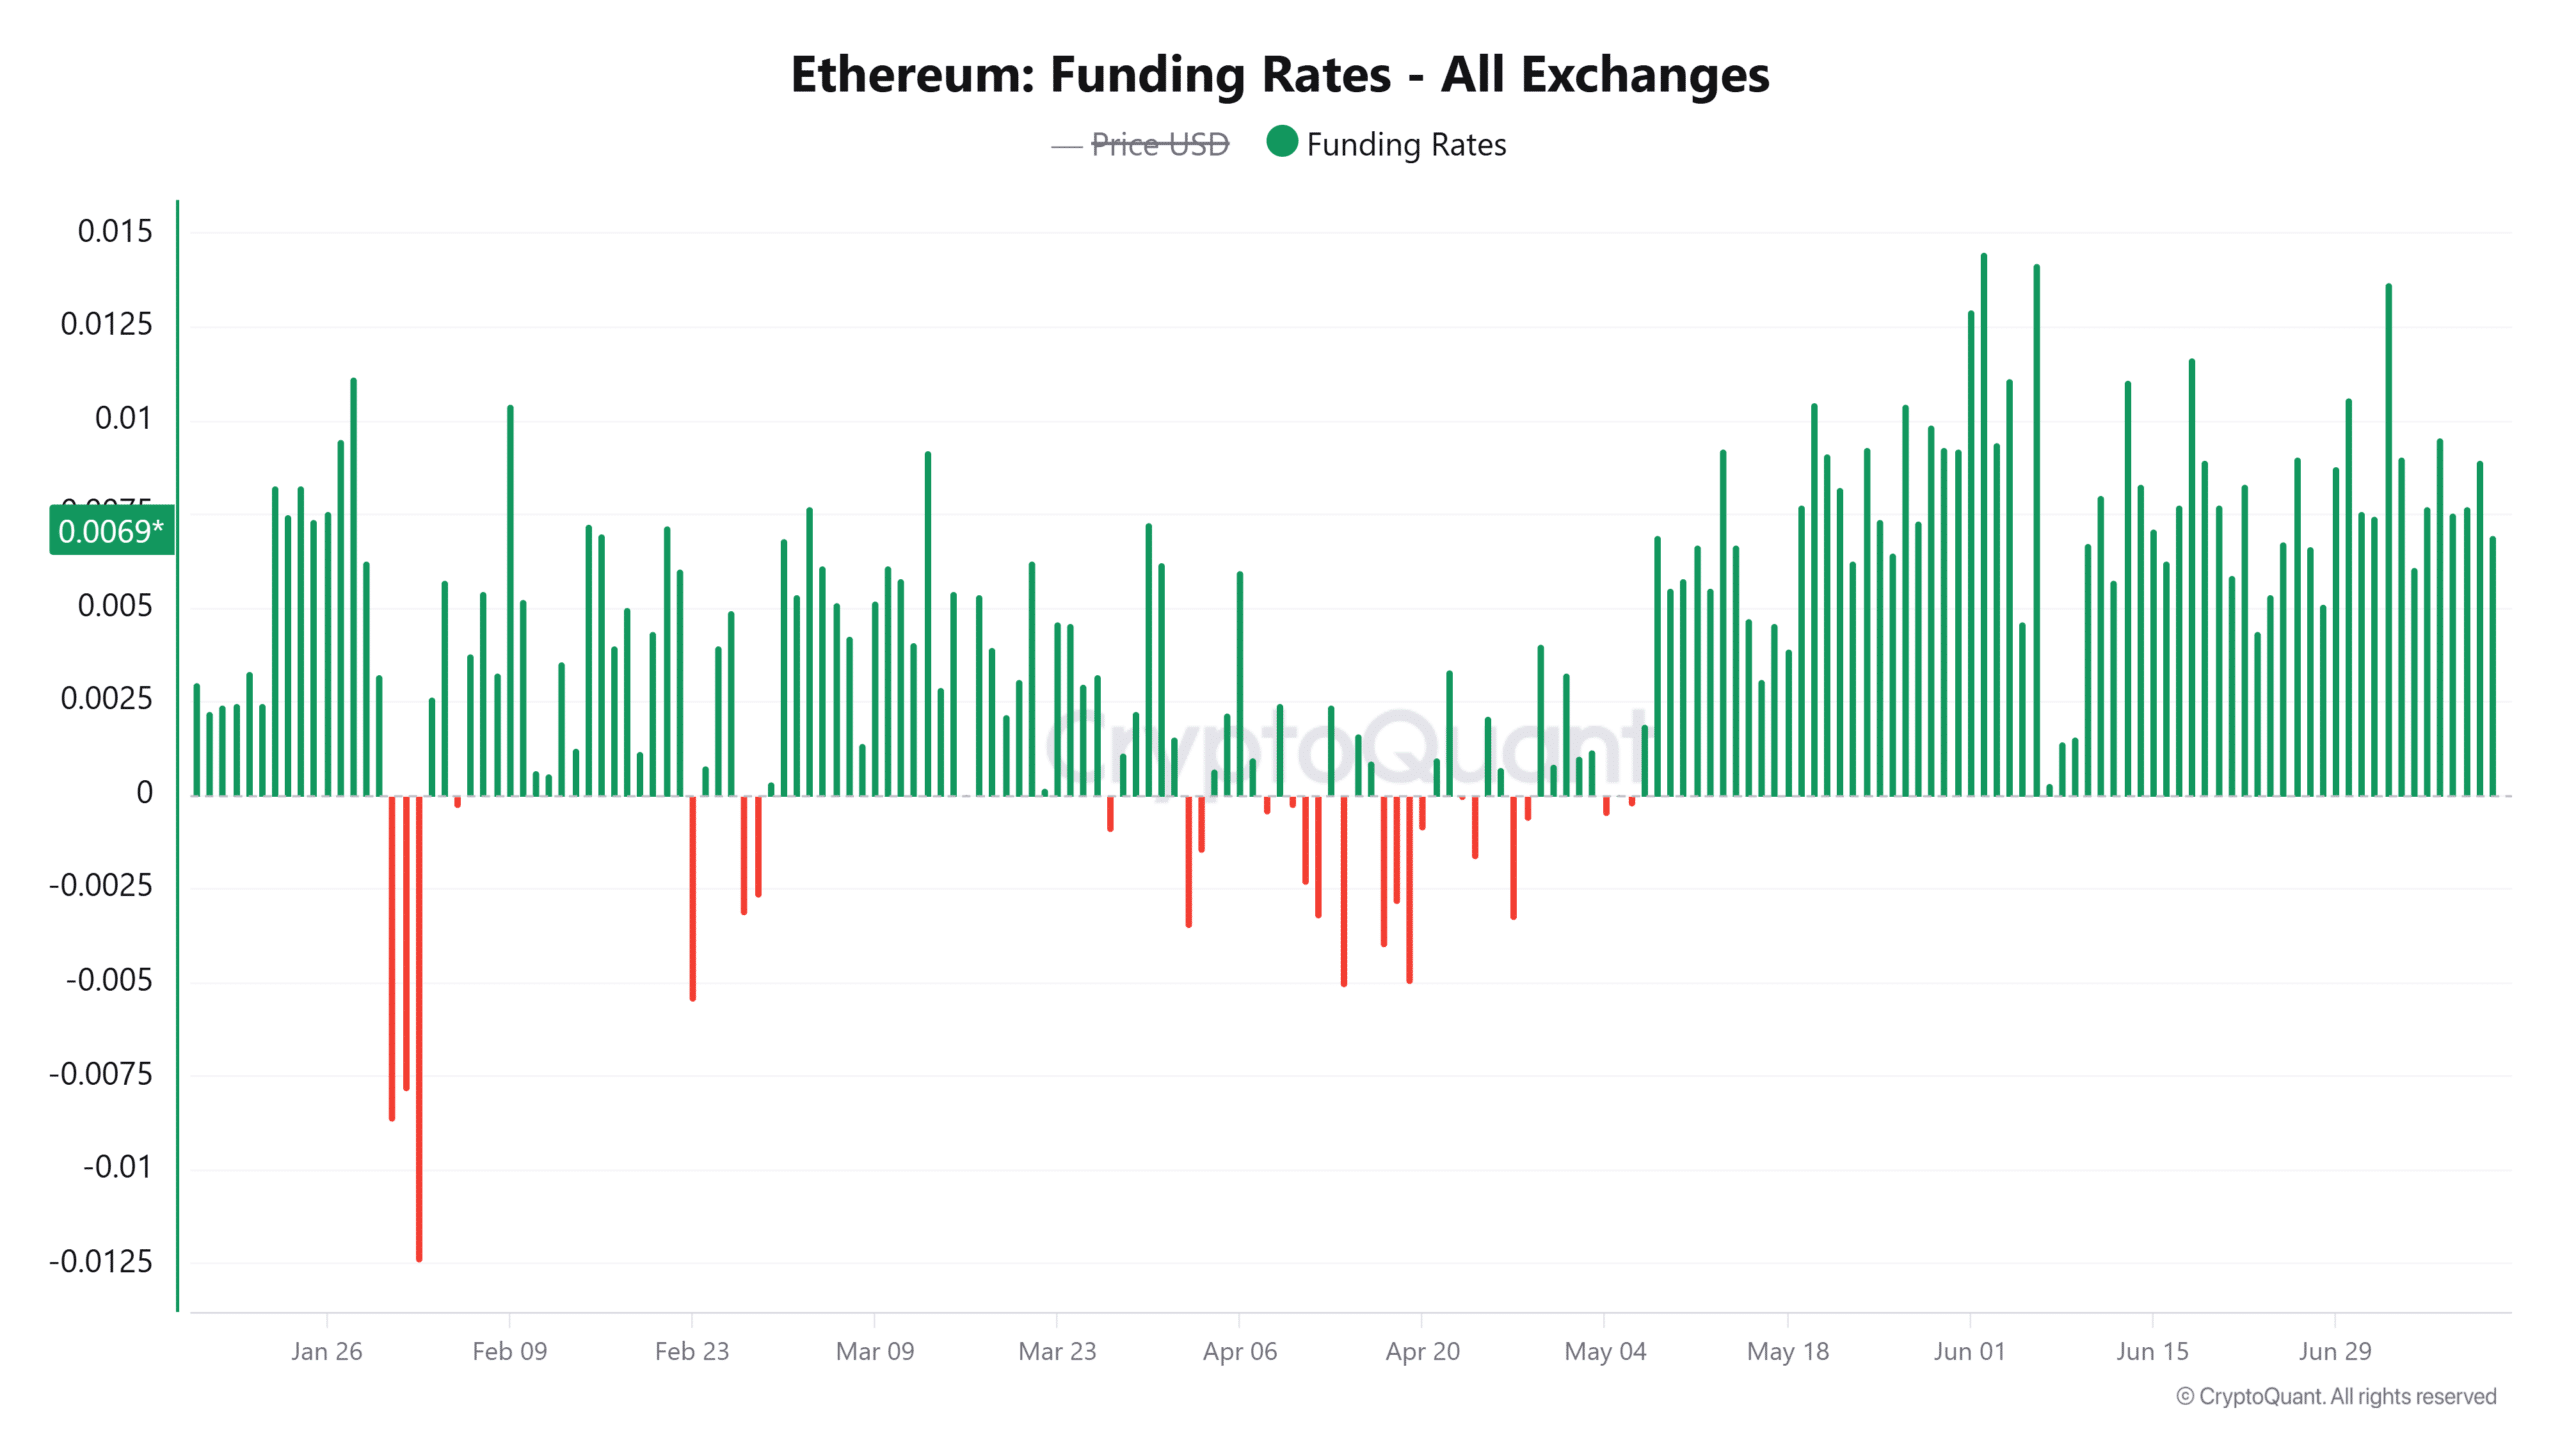
Source: CryptoQuant

Can Ethereum hold above reclaimed support?

Ethereum [ETH] reclaimed the $1,800 region after recovering sharply from its early June low near $1,560.

Buyers repeatedly defended higher lows throughout July, allowing the price to consolidate just beneath the next resistance around $2,000.

The Relative Strength Index also recovered to 57.16, while its moving average stood at 49.84, confirming that buying strength improved after emerging from deeply oversold territory.

Even so, RSI remained below overbought conditions, leaving room for either continued stabilization or renewed consolidation.

Price also continued trading below the major $2,000 resistance that previously acted as support before June’s decline.

If buyers maintain control above $1,800, Ethereum would continue preserving its improving technical structure.

However, failure to defend that level would likely return focus to the lower support around $1,564, where buyers previously regained control.
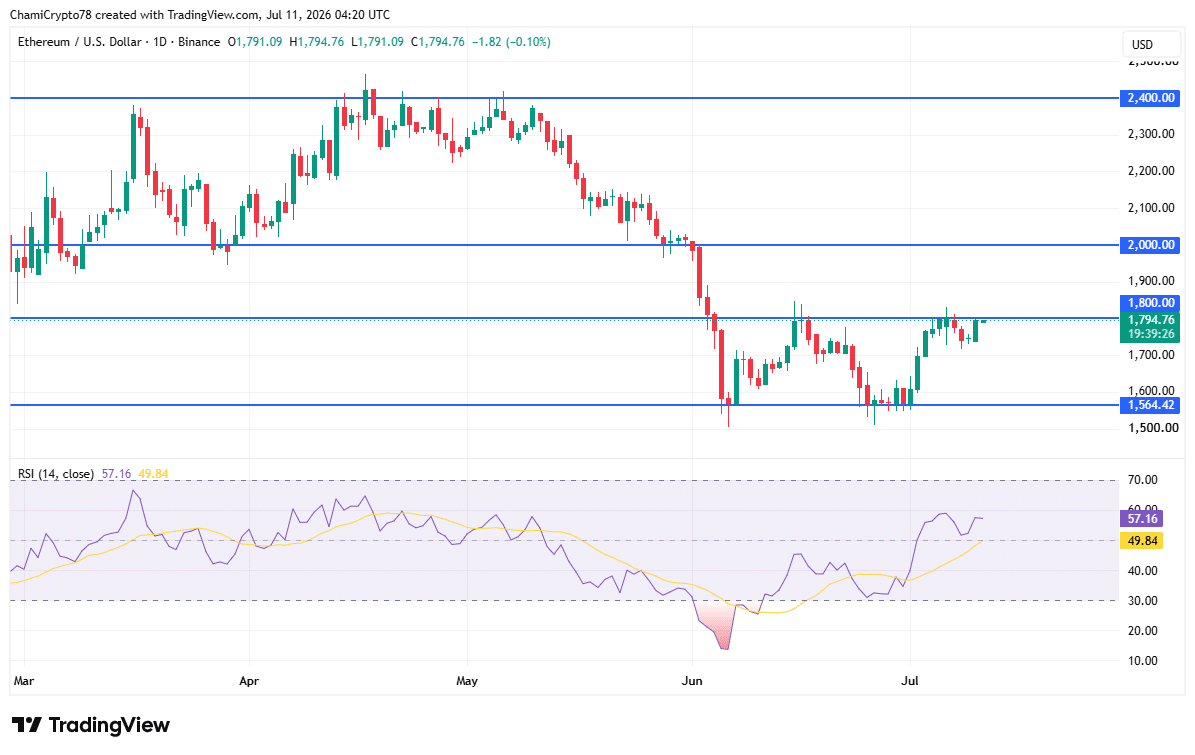
Source: TradingView

What does it all mean?

To sum up, Ethereum presented conflicting signals rather than a one-sided narrative.

The historically low MVRV ratio strengthened the long-term valuation case, while rising Open Interest reflected sustained trader participation.

However, exchange inflows showed more ETH returned to trading venues instead of leaving them for long-term holding.

The combination suggests confidence improved, yet caution still shaped market positioning as investors balanced attractive valuation against lingering uncertainty.


Final Summary

  • Ethereum looked historically undervalued, but Exchange Netflows suggested investors still preferred flexibility over long-term conviction.
  • ETH’s setup improved, but holding above $1,800 could decide whether buyers keep control.

Trending Cryptos

Related Questions

QWhat does Ethereum's MVRV ratio falling below 0.8 indicate, according to the article?

AIt indicates that Ethereum's market value is trading below its realized value, placing it in a historically rare accumulation zone. This condition has previously appeared during major market bottoms, such as in December 2018, March 2020, and June 2022.

QWhat does the positive Exchange Netflow data of $62.64 million suggest about investor behavior?

AIt suggests that more ETH was deposited onto exchanges than withdrawn. This indicates investors may be preparing assets for trading rather than demonstrating outright accumulation through withdrawals, preferring flexibility over long-term conviction.

QWhat trend did the article highlight in Ethereum's derivatives market, specifically regarding Open Interest and Funding Rates?

AOpen Interest increased by 3.25% to $11.1092 billion, showing traders increased their outstanding positions. Funding Rates remained positive but declined by 25.41%, indicating measured optimism where long traders still pay a premium but with slightly eased bullish conviction.

QWhat are the key price levels mentioned for Ethereum's technical structure, and why are they significant?

AThe key levels are support at $1,800 and major resistance at $2,000. Holding above $1,800 is crucial for buyers to maintain the improving technical structure. Failure to do so could refocus attention on the lower support around $1,564. The $2,000 level previously acted as support before June's decline.

QHow does the article summarize the overall market signals for Ethereum?

AThe article summarizes that Ethereum presents conflicting signals: a historically low MVRV ratio strengthens the long-term valuation case, and rising Open Interest shows sustained trader participation. However, exchange net inflows suggest caution, as investors balance attractive valuation against lingering uncertainty rather than committing to long-term holding.

Related Reads

U.S. Stock Market Trend (August 26th): NVIDIA Ends 7-Day Losing Streak, Storage and Optical Communications Rebound Across the Board

U.S. Stock Market Trends (August 26th): Nvidia Ends Seven-Day Losing Streak; Memory and Optical Communication Stocks Rebound Across the Board. On Tuesday, the three major U.S. stock indices closed higher. The tech-heavy Nasdaq gained 0.66% as declining long-term Treasury yields (the 10-year yield fell to 4.625%) provided a valuation relief window for growth stocks. The Philadelphia Semiconductor Index rose 1.44%. Nvidia shares gained 2.19%, ending a seven-session decline ahead of its closely-watched earnings report after Wednesday's close. Memory and optical communication stocks saw a broad rebound, with AMD, Marvell, and Micron among the notable gainers. The 'Magnificent Seven' were mixed, with Tesla being the sole decliner. Oil prices fell for a second consecutive day, with WTI crude dropping 2.4% to $85.01 per barrel. This followed a joint statement from Iran and Oman proposing a secure maritime channel in the Strait of Hormuz, signaling a potential de-escalation of regional tensions. Bitcoin briefly touched $80,000, while gold prices hit a three-month high. The simultaneous strength in both assets was driven by expectations of improved liquidity amid lower yields and persistent concerns about dollar credit. Market focus now shifts to Nvidia's earnings, with investors keenly awaiting guidance on Blackwell chip shipments, data center revenue, and signals on AI capital expenditure.

marsbit25m ago

U.S. Stock Market Trend (August 26th): NVIDIA Ends 7-Day Losing Streak, Storage and Optical Communications Rebound Across the Board

marsbit25m ago

From Near Zero to New Highs: Zcash Charges Towards a NYSE ETF

From Near-Zero to New Highs: Zcash Eyes NYSE ETF Zcash (ZEC), the privacy-focused cryptocurrency launched in 2016, recently surged past $800, reaching a market cap of over $13 billion. This rally coincides with Grayscale Investments' fifth amended filing to convert its Zcash Trust into a spot ETF on NYSE Arca, backed by major Wall Street firms like Coinbase Custody and Jane Street Capital. The path to this point was dramatic. In May, a critical, four-year-old vulnerability was discovered that could have allowed infinite counterfeit ZEC creation, causing ZEC's price to halve. The development team responded swiftly, deploying a patch and executing the "Ironwood" upgrade in July. This upgrade froze the old, potentially compromised shielded pool (holding ~3.66 million ZEC) and created a new, mathematically verified one, effectively containing the crisis and restoring confidence—a key factor for institutional interest. Zcash's "selective privacy" model, offering both transparent and shielded addresses, is central to the ETF strategy. The proposed ETF would only handle transparent ZEC, allowing traditional finance to gain exposure to the "financial privacy" asset class without directly handling anonymous transactions. This comes as regulatory approaches diverge: the EU plans to ban regulated entities from handling privacy coins by 2027, while the US SEC has paved the way for such ETFs, potentially making Grayscale's fund a unique global access point. Further tightening supply, over 30% of ZEC's circulating supply is locked in shielded pools, and Grayscale's trust already holds a significant portion. An ETF approval could trigger institutional demand against a constrained liquid supply. Grayscale's commitment to reinvest the ETF's first-year 2.5% fee into the Zcash ecosystem and potential capital injections from its parent company, DCG, underscore deep alignment. The fundamental irony remains: an asset designed for anonymity is seeking legitimacy through the most transparent regulated vehicle. Ultimately, Wall Street may not be betting on privacy itself, but on the growing market value of the demand for it.

marsbit1h ago

From Near Zero to New Highs: Zcash Charges Towards a NYSE ETF

marsbit1h ago

Rubin Takes the Reins: Can Nvidia Break the Curse of Post-Earnings Slumps?

NVIDIA is set to announce its FY2027 Q2 earnings after market close on August 26. As a bellwether for AI investments, market sentiment is unusually divided. While strong results are expected, investors are wary of a post-earnings stock drop, a pattern seen for the last four consecutive quarters. The key variable this time is the market debut of the new Vera Rubin platform. Despite beating expectations consistently, NVIDIA's stock has fallen after each of its last four earnings reports. This "sell the news" trend reflects diminishing "expectation gaps," where future growth is already priced in. The immediate focus is now on the company's Q3 revenue guidance, particularly its first quantitative outlook for Rubin platform sales. The Vera Rubin platform promises a generational leap, especially in inference workloads, reportedly delivering up to 10x lower token cost compared to the previous Blackwell generation. This significant efficiency gain is seen as NVIDIA's strategic defense against growing competition from custom AI chips developed by major cloud customers. Analysts project Rubin could contribute 12% of GPU revenue in Q3, potentially rising to over 40% in Q4, driven by faster ramp-up due to infrastructure compatibility with previous systems. However, risks remain. Supply chain checks indicate potential production delays, and initial bring-up and testing cycles could impact the rollout schedule. Furthermore, rising memory and component costs pose a threat to NVIDIA's industry-leading gross margins, which are a critical metric for investors. The company's financial involvement in funding customer data centers, as seen with OpenAI, also introduces a new variable regarding future capital allocation and risk. In summary, this earnings report hinges on three main points: 1) Q3 revenue guidance, specifically the contribution from Rubin, 2) the ability to maintain gross margins near 75% amidst cost pressures, and 3) management's commentary on the demand outlook, particularly for the Chinese market. A strong Rubin outlook coupled with stable margins could break the post-earnings decline pattern. Otherwise, the "sell the news" trend might continue for a fifth quarter.

marsbit1h ago

Rubin Takes the Reins: Can Nvidia Break the Curse of Post-Earnings Slumps?

marsbit1h ago

Trading

Spot

Hot Articles

Discussions

Welcome to the HTX Community. Here, you can stay informed about the latest platform developments and gain access to professional market insights. Users' opinions on the price of ETH (ETH) are presented below.

活动图片