Ethereum Struggles Below $2,000 As Volume Dries Up And Bears Dominate

bitcoinistPublished on 2026-03-29Last updated on 2026-03-29

Abstract

Ethereum is struggling below the critical $2,000 support level, trading around $1,985, as declining volume and increased selling pressure indicate bearish control. The breakdown below this key psychological level signals a shift in market structure, turning previous support into resistance. Low buyer interest leaves the market vulnerable, with the next major support at the $1,750 macro trendline. A break below this could lead to a deeper retracement, while reclaiming $2,100 is necessary for a bullish reversal. Despite repeated tests of a key resistance trendline, Ethereum shows weak momentum, with the 200-day EMA far above at $2,758, underscoring its current bearish deviation.

Ethereum continues to struggle below the critical $2,000 level, with price losing momentum as volume fades and selling pressure builds. The lack of strong buyer interest leaves the market vulnerable, allowing bears to maintain control while key support levels come into focus.

$2,000 Breakdown Signals A Shift In Market Structure

Ethereum has just broken below the $2,000 level, a key zone that has been on watch for weeks. According to CyrilXBT, the price is currently trading around $1,985. This level has acted as a strong pivot for sentiment, and slipping beneath it signals a clear shift in control.

Each time Ethereum tested the $2,000 level, it managed to bounce and maintain strength. However, this time is different, as price has now closed below it, turning former support into potential resistance. That kind of transition often marks a bigger change in market behavior, especially when followed by continued weakness.

Volume has also declined noticeably, suggesting a lack of strong buying interest at this level. Without conviction, the price struggles to find the momentum needed for a meaningful recovery. This type of low-volume environment often leads to slower moves, but it can also precede larger impulsive drops if sellers step in aggressively.

Source: Chart from CyrilXBT on X

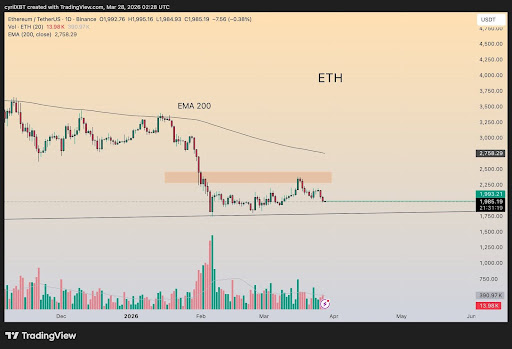
Looking ahead, the $1,750 macro trendline stands out as the last major support on the chart, and price is gradually approaching it. A break of that level would open the door to a deeper retracement, while a strong defense could spark a temporary relief bounce. On the upside, the EMA 200 at $2,758 remains far above current levels, emphasizing how much Ethereum has deviated from its broader trend.

A reclaim of $2,100, followed by a strong hold above it, would be necessary to shift the current outlook and signal that buyers are regaining control. Until then, Ethereum remains under pressure, with momentum favoring the downside, making it one of the weakest setups on the watchlist.

Ethereum Breakout Potential: No Certainty

In a recent analysis by Bitcoinsensus, Ethereum is seen pressing against a well-defined trendline that has already been tested multiple times. The repeated rejection from this line highlights its strength as a key resistance zone, where sellers continue to step in and defend control.

Each retest adds more pressure beneath the surface, gradually weakening the level over time. While the structure continues to hold for now, the more price interacts with this resistance, the more fragile it becomes, increasing the probability of a decisive move.

Another attempt could be enough to trigger a breakout if buying momentum steps in with enough strength. However, no outcome is guaranteed at this stage, and the price could easily face another rejection from this zone.

ETH trading at $1,997 on the 1D chart | Source: ETHUSDT on Tradingview.com

Related Questions

QWhat is the current price of Ethereum and why is the $2,000 level significant?

AEthereum is currently trading around $1,985. The $2,000 level is a critical psychological and technical support zone. A break below it signals a shift in market control from buyers to sellers, turning it into potential resistance.

QAccording to the article, what does the declining trading volume indicate for Ethereum's price?

AThe declining trading volume suggests a lack of strong buyer interest and conviction at current levels. This makes the market vulnerable and can lead to slower price moves or precede larger impulsive drops if sellers become more aggressive.

QWhat is identified as the last major support level for Ethereum, and what would a break below it mean?

AThe $1,750 macro trendline is identified as the last major support. A break below this level would open the door to a deeper and more significant price retracement for Ethereum.

QWhat needs to happen for Ethereum's bearish outlook to shift and signal that buyers are regaining control?

AFor the bearish outlook to shift, Ethereum would need to reclaim and hold strongly above the $2,100 level. This would signal that buyers are regaining control and provide a more positive momentum shift.

QHow does the analysis from Bitcoinsensus describe the key resistance trendline Ethereum is testing?

ABitcoinsensus's analysis describes a well-defined resistance trendline that has been tested and rejected from multiple times. Each retest weakens the level, increasing the probability of a decisive breakout, though another rejection is still possible without strong buying momentum.

Related Reads

Bitcoin's 'Rally Ends,' Officially Entering the Later Stage of a Bear Market?

Bitcoin prices declined 13% this week, reversing the recent rebound and signaling a likely transition into the later stages of a bear market. Key on-chain metrics deteriorated, with the short-term holder cost basis falling below the Realized Price—a pattern last seen in early 2022, characteristic of bear market maturity. The rally to ~$82k proved to be a bear market bounce, as evidenced by the 90-day realized profit/loss ratio failing to sustain above the bullish threshold of 2. Daily realized losses surged to $1.35B, including significant selling from long-term holders who accumulated near cycle tops, indicating ongoing supply redistribution. Price was rejected almost precisely at the aggregate US spot ETF cost basis of ~$83k, turning that level into resistance and leaving the average ETF investor underwater again. Spot market selling pressure intensified, with the 7-day volume delta turning significantly negative to its weakest level since February. While a major long liquidation event cleared over $400M in leverage, spot demand has not yet stepped in to absorb the resulting supply. Options markets continue pricing in higher future volatility (elevated volatility risk premium) and maintain a skew toward put options, reflecting persistent demand for downside protection, though not yet panic. Overall, market structure remains fragile. Sustained recovery likely requires a reclaim of the ETF cost basis, a shift back to positive spot demand, and a slowdown in realized loss-taking. Until then, the market risks further downside or extended consolidation within the broader bear trend.

Foresight News50m ago

Bitcoin's 'Rally Ends,' Officially Entering the Later Stage of a Bear Market?

Foresight News50m ago

How Risky is the "Death Spiral" of MSTR and STRC?

Summary: This article explores the perceived "death spiral" risk between MicroStrategy (MSTR), its Bitcoin holdings, and its perpetual preferred stock (STRC), drawing comparisons to the LUNA-UST collapse. While both systems feature price anchors, high yields for holders, and potential feedback loops, their core mechanisms differ fundamentally. The MSTR-STRC structure relies on continuous financing to sustain its high dividend payouts, primarily through stock ATM offerings. A negative feedback cycle could occur: falling MSTR stock price makes raising equity capital harder, increasing pressure to sell Bitcoin, which undermines STRC confidence and further depresses MSTR. However, unlike LUNA-UST's automated, direct linkage, the MSTR-STRC loop is weaker and has brakes: STRC dividends can be deferred or rates lowered, and STRC holders have a $100/share liquidation preference in bankruptcy, providing a price floor. The company's sustainability hinges on its ability to continue financing. Its current ~$900 million USD reserves cover only about 6.3 months of its ~$1.71 billion annual interest/dividend burden. The next six months are critical, aligning with both the potential bottom in Bitcoin's four-year cycle and the depletion timeline of its reserves. While a LUNA-style catastrophic collapse is deemed highly unlikely due to structural differences, the key question is whether MicroStrategy can navigate this period through healthy deleveraging to restart its capital engine.

Foresight News1h ago

How Risky is the "Death Spiral" of MSTR and STRC?

Foresight News1h ago

Trading

Spot
Futures

Hot Articles

Discussions

Welcome to the HTX Community. Here, you can stay informed about the latest platform developments and gain access to professional market insights. Users' opinions on the price of ETH (ETH) are presented below.

活动图片