Chainlink has become a prominent player in the cryptocurrency market. It provides a secure, decentralized oracle network that connects smart contracts with real-world data, impacting the current price.
As the adoption of decentralized finance (DeFi) and blockchain technology grows, Chainlink's innovative solutions are attracting significant attention from both investors and traditional financial institutions.
Chainlink continues to expand its presence and capabilities within the blockchain ecosystem, showcasing its robust integration abilities and facilitating enterprise adoption across various sectors through its cross-chain interoperability protocol.
Recent updates highlight 14 new integrations of 5 Chainlink services across 10 different blockchain platforms, demonstrating its versatility in working with multiple blockchains, including prominent ones like Arbitrum, Avalanche, and Ethereum.
These integrations broaden Chainlink's network capabilities and solidify its position as a critical player in ensuring the compatibility and functionality of decentralized applications.
Understanding Chainlink's potential price fluctuations based on the presented information is crucial for making an investment decision. This involves analyzing various factors, including market trends, technological advancements, partnerships, and overall market sentiment.
This Chainlink price forecast aims to provide insight into its future dynamics by analyzing technical aspects and fundamental factors that could influence its value.
Overview
| Cryptocurrency | Chainlink |
| Token | LINK |
| Price | $10.68 |
| Market Capitalization | $7,984 billion |
| Trading Volume (24h) | $485,442 million |
| Circulating Supply | 748.1 million LINK |
| All-Time High | $52.88, May 9, 2021 |
| All-Time Low | $0.1263, September 23, 2017 |
| 24h High | $10.86 |
| 24h Low | $10.37 |
Chainlink Price Forecast: Technical Analysis
| Metric | Value |
| Price Volatility (30-day variation) | 5.43% (High) |
| 50-day SMA | $8.41 |
| 14-day RSI | 80.77 (Overbought) |
| Sentiment | Neutral |
| Fear & Greed Index | 62 (Greed) |
| Green Days | 17/30 (57%) |
| 200-day SMA | $8.78 |
Chainlink Price Analysis
- $LINK retains a strong bullish trend on both timeframes, with the daily MACD confirming accelerating upward momentum.
- The next major resistance is the $10.88-$11.00 range, but the 4-hour Relative Strength Index (RSI) around 80 warns that the rally is overheating.
- Holding above $10.40 allows buyers to maintain control, while losing $10.20 would increase the risk of a deeper correction.
Daily Chainlink Price Chart
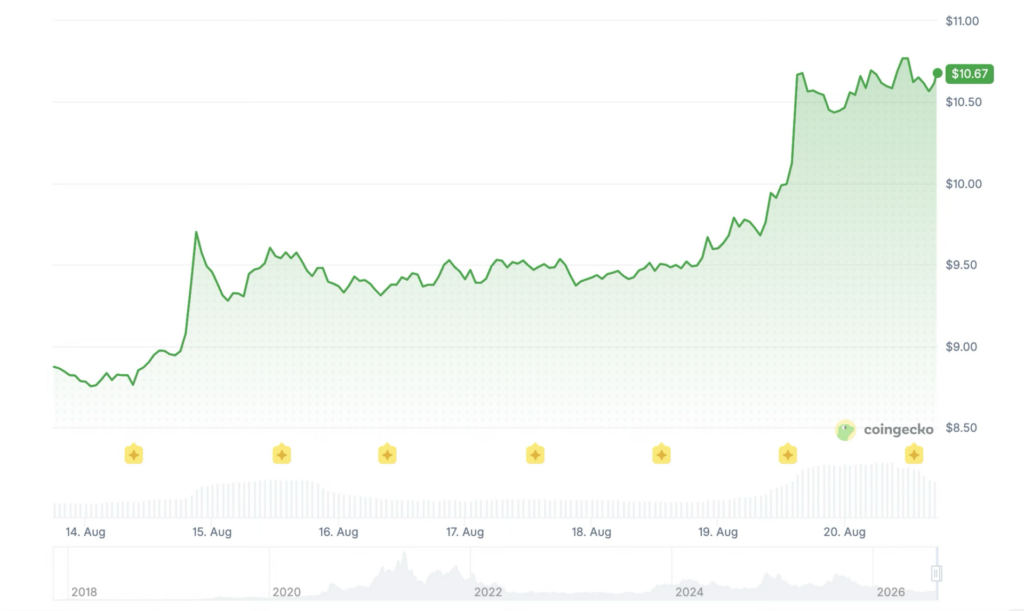
As of August 20, $LINK is trading around $10.69 after gaining 1.33% in the current daily session, continuing the powerful breakout that lifted the price from around $8.20 in early August. The token is now trading above the upper Bollinger Band at $10.38 and approximately 21% above the midline at $8.82, highlighting exceptionally strong bullish momentum but also an increasingly overextended market.
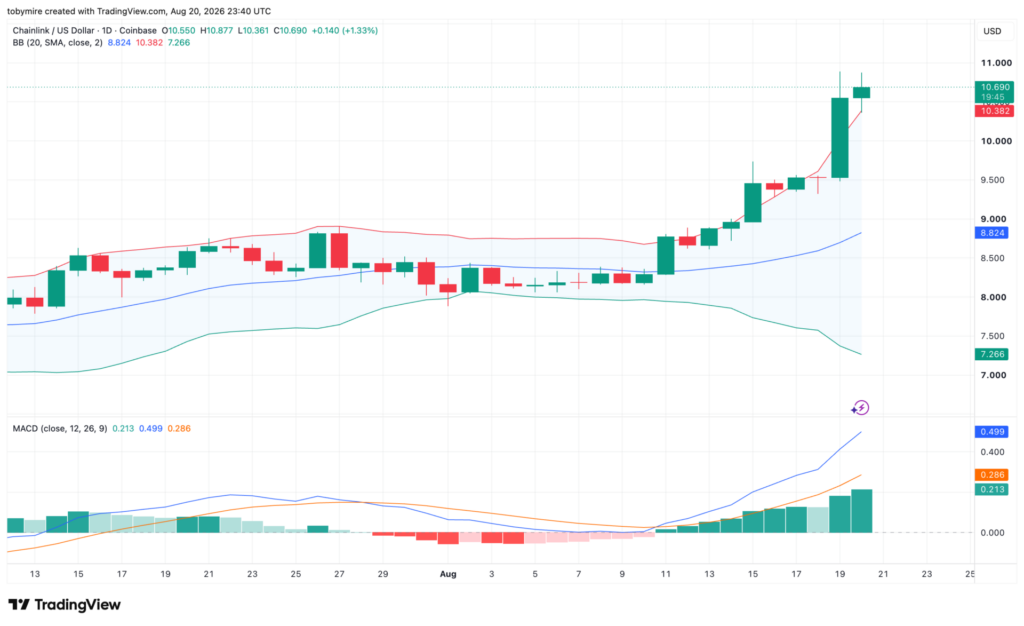
The daily MACD strongly supports the rally, with the MACD line at 0.499, significantly above the signal line at 0.286, and the histogram at a positive 0.213. This indicates momentum is still accelerating, not showing a confirmed reversal. The nearest test is in the $10.88-$11.00 area; a confident breakout could continue the advance, while failure to overcome this level might trigger profit-taking around $10.38 and potentially $10.00.
4-Hour Chainlink Price Chart
The 4-hour market structure remains firmly bullish, with $LINK at $10.69 and confidently above all three Alligator moving averages at $10.42, $10.21, and $9.96. Their bullish alignment confirms the short-term trend still favors buyers, though after the rapid climb, the price has begun consolidating in the $10.60-$10.70 range.
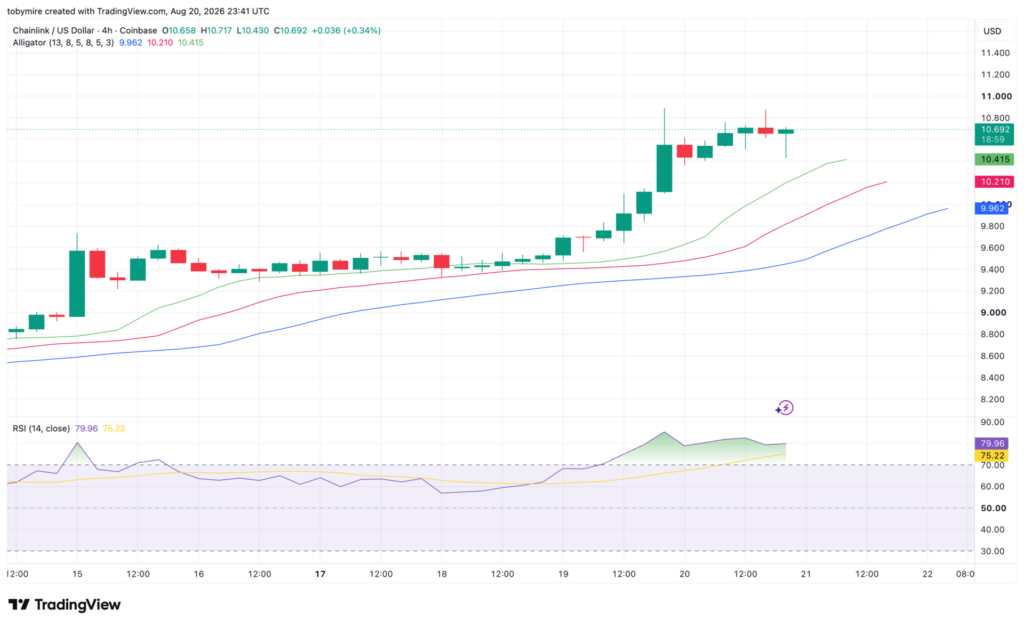
The main warning sign comes from the RSI, which reached 79.96 and is firmly in overbought territory. This doesn't mean a guaranteed reversal but increases the likelihood of consolidation or a pullback before another sustained upward move. Holding the $10.40 level will keep the bullish trend intact, while a break below $10.20 would indicate a more substantial loss of momentum.
Chainlink Technical Indicators: Levels & Actions
Daily Simple Moving Average (SMA)
| Period | Value | Action |
|---|---|---|
| SMA 3 | $9.89 | BUY |
| SMA 5 | $9.72 | BUY |
| SMA 10 | $9.23 | BUY |
| SMA 21 | $8.70 | BUY |
| SMA 50 | $8.41 | BUY |
| SMA 100 | $8.47 | BUY |
| SMA 200 | $8.78 | BUY |
Daily Exponential Moving Average (EMA)
| Period | Value | Action |
|---|---|---|
| EMA 3 | $10.03 | BUY |
| EMA 5 | $9.77 | BUY |
| EMA 10 | $9.37 | BUY |
| EMA 21 | $8.95 | BUY |
| EMA 50 | $8.60 | BUY |
| EMA 100 | $8.66 | BUY |
| EMA 200 | $9.72 | BUY |
What to Expect from Chainlink?
The trend remains bullish, but $LINK is in overbought territory after a sharp climb. A breakout above $11 could continue the rise, while a rejection from this level would make a short-term decline to $10.40-$10.00 increasingly likely.
Is Chainlink a Good Investment?
Chainlink remains a key player in the blockchain ecosystem, as growing demand for its decentralized oracle services and strategic partnerships support its long-term adoption.
Moderate selling pressure persists, but the network's ongoing utility and practical applications indicate sustainable growth potential in the long run. Traders and investors should closely monitor key support and resistance levels to make informed decisions and manage risks effectively.
Will Chainlink Reach $50?
According to long-term industry expert forecasts, Chainlink ($LINK) is expected to approach $50 by 2032.
Does Chainlink Have a Promising Long-Term Future?
Chainlink shows signs of stabilization and recovery potential, pointing to a bullish trend and a promising long-term future for the token in the blockchain industry.
Latest Chainlink News
The Wyoming Stable Token Commission has migrated its Frontier (FRNT) stablecoin from the LayerZero Stargate bridge to Chainlink CCIP, making CCIP the exclusive infrastructure for all cross-chain FRNT transfers. The Commission stated the migration followed thorough security review, with future bridging to be conducted via Transporter.
NEWS: The Wyoming Stable Token Commission (@wyostable) is sunsetting its legacy bridge and moving the Frontier (FRNT) stablecoin to Chainlink CCIP.
— Chainlink (@chainlink) August 18, 2026
As a leader in digital asset policy, Wyoming is raising the security bar by choosing Chainlink as its exclusive cross-chain infrastructure. https://t.co/7KZILREyaZ pic.twitter.com/Rn2UU7Whx4
Chainlink Price Forecast for August 2026
In August 2026, the minimum forecasted price is $7.19, with the average around $9.16. The peak price of $LINK is expected to reach $11.51.
| Chainlink Price Forecast | Potential Low | Average Price | Potential High |
| August 2026 | $7.19 | $9.16 | $11.51 |
Chainlink Price ($LINK) Forecast for 2026
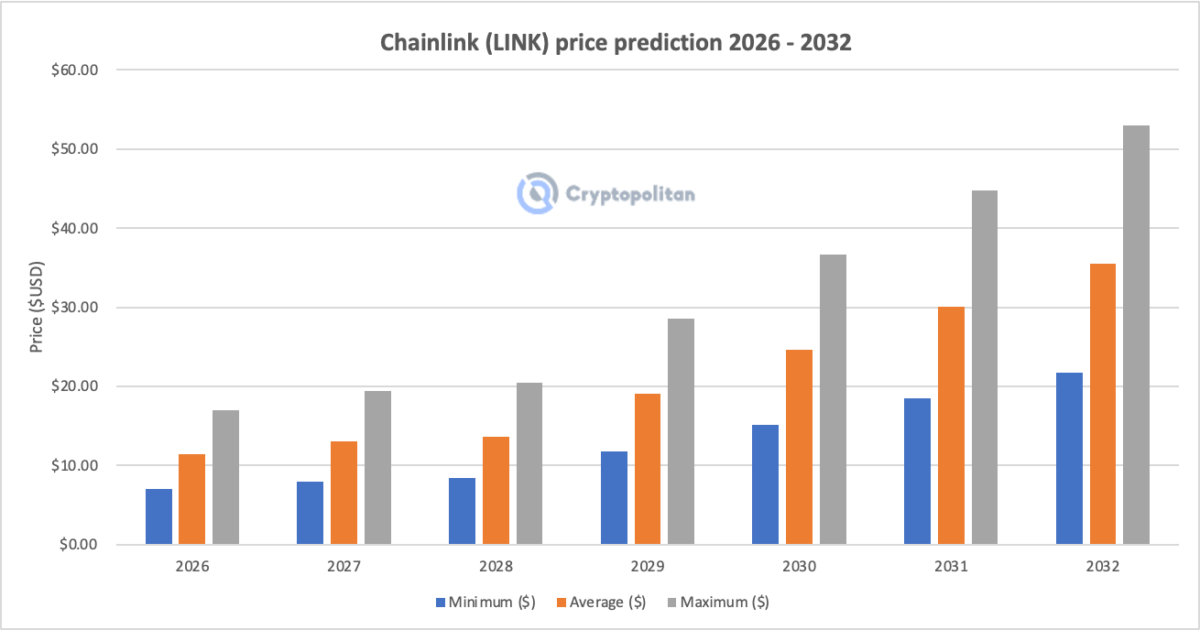
$LINK's market price is expected to reach a high of $17.00 in 2026. However, traders can expect a low price of $7.00, influenced by overall market capitalization and external data sources. The average Chainlink price is forecast to be $11.38.
| Chainlink Price Forecast | Potential Low | Average Price | Potential High |
| Chainlink Price Forecast 2026 | $7.00 | $11.38 | $17.00 |
Chainlink Price Forecast for 2027-2032
| Year | Minimum ($) | Average Price ($) | Maximum ($) |
| 2027 | 8.01 | 13.02 | 19.46 |
| 2028 | 8.40 | 13.66 | 20.41 |
| 2029 | 11.74 | 19.11 | 28.53 |
| 2030 | 15.10 | 24.57 | 36.68 |
| 2031 | 18.44 | 30.01 | 44.80 |
| 2032 | 21.78 | 35.45 | 52.95 |
Chainlink Price Forecast for 2027
In 2027, Chainlink's price is expected to reach a high of $19.46, a low of $8.01, and an average price of $13.02.
Chainlink Price Forecast for 2028
In 2028, the average price of $LINK is expected to be $13.66; the minimum and maximum trading prices, based on historical performance, are forecast to be $8.40 and $20.41, respectively.
Chainlink Price Forecast for 2029
The forecasted Chainlink price for 2029 is a maximum of $28.53. The minimum price will reach $11.74, with an average of $19.11.
Chainlink Price Forecast for 2030
According to the Chainlink price forecast for 2030, the price of $LINK will range from $15.10 to $36.68, with an average price of $24.57.
Chainlink Price Forecast for 2031
According to Chainlink forecasts, in 2031, the maximum price of $LINK will reach $44.80, the minimum $18.44, and the average $30.01.
Chainlink Price Forecast for 2032
The Chainlink forecast rises even higher, up to 2032. According to the forecast, the price of $LINK will range from $21.78 to $52.95, with an average price of $35.45.
Chainlink Market Price Forecast: Analyst $LINK Price Forecast
| Firm Name | 2026 | 2027 |
| CoinCodex | $12.69 | $25.54 |
| DigitalCoinPrice | $8.30 | $8.14 |
Chainlink Price Forecast from Cryptopolitan
According to our Chainlink price forecast, the coin's market value could reach a maximum of $15 by the end of 2026. In 2028, $LINK's value could soar to a maximum price of $30.
Historical Chainlink Market Sentiment
- Chainlink launched at around $0.20 and remained below $1 throughout 2018 before surpassing $3 by late 2019 due to the expansion of its oracle network usage.
- In 2020, $LINK made a major breakout, climbing from roughly $2 to $20 during the DeFi boom, then reached its all-time high around $52 in May 2021 before sharply declining with the broader market.
- In 2022 and 2023, $LINK mostly traded in the $6-$25 range as bearish sentiment dominated crypto markets. Recovery began in 2024, with the coin rising to $30.94 in December after fluctuating between $10 and $18 for most of the year.
- In 2025, $LINK peaked at $22.90 in January, traded mostly in the $13-$16 range for the year, briefly rose above $23 in September, and ended the year around $14.67.
- In 2026, Chainlink remained under pressure, trading between $13.6-$14.2 in January, dropping to $7.40 in February, and fluctuating between $8.29-$10.05 in March. In April, $LINK's average price was around $9, and in May, around $9.55.
- In June, $LINK weakened further, trading roughly between $7.00-$8.30. In July, it saw a slight recovery, trading between $7.10-$8.90 with an average price around $8.09.
- In August, $LINK traded roughly between $8.13-$10.63, continuing its recovery from early-month lows. As of August 20, Chainlink is trading around $10.63, having risen approximately 0.75% in the past 24 hours, with movement above $10 indicating notable improvement compared to the range observed earlier in August.