Bitcoin Weakness Persists: Stablecoin Supply Signals Risk-Off Environment

bitcoinistPublished on 2026-02-13Last updated on 2026-02-13

Abstract

Bitcoin continues to face selling pressure below $70,000 amid weakening liquidity and a risk-off market environment. Key indicators, including the Stablecoin Supply Ratio (SSR) Oscillator and the 30-day change in USDT market capitalization, signal ongoing weakness. The SSR has turned negative again after a brief positive period in January, suggesting Bitcoin is underperforming relative to stablecoins. Meanwhile, USDT’s market cap change has dropped to approximately -$2.87 billion, indicating capital outflows from crypto. These trends imply that January’s recovery lacked sustained liquidity support, and without renewed stablecoin inflows, Bitcoin remains vulnerable to near-term downside pressure.

Bitcoin remains under selling pressure below the $70,000 level as the market confronts renewed uncertainty and weakening liquidity conditions. The inability to reclaim this key psychological threshold has reinforced a cautious tone among investors, with price action reflecting a broader struggle across risk assets. While volatility remains elevated, the current environment suggests that market participants are increasingly focused on liquidity trends and capital flows rather than short-term price momentum alone.

An analysis by Axel Adler highlights two important liquidity indicators pointing to ongoing market weakness. The Stablecoin Supply Ratio (SSR) Oscillator has moved back into negative territory after briefly turning positive in January, indicating that Bitcoin continues to underperform relative to stablecoin dynamics. Historically, positive SSR readings have coincided with stronger price appreciation, while persistent negative readings tend to align with periods of price stagnation or decline.
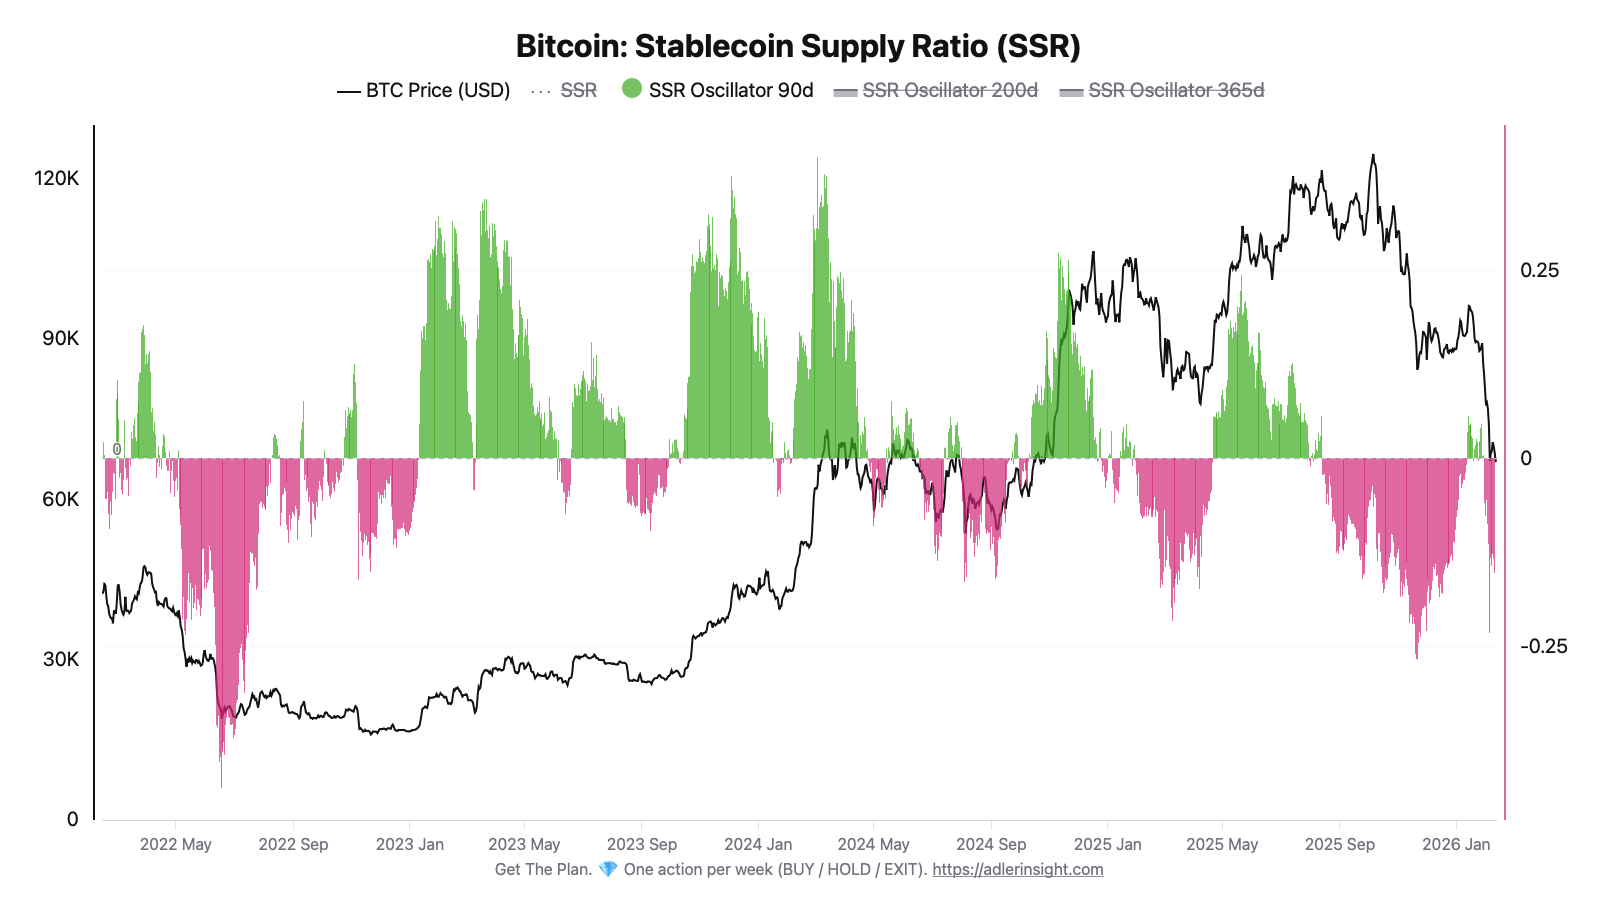
Bitcoin Stablecoin Supply Ratio (SSR) | Source: CryptoQuant

At the same time, the 30-day change in USDT market capitalization has fallen to approximately -$2.87 billion, signaling capital outflows from the crypto ecosystem. Together, these indicators suggest that January’s attempted recovery lacked sustained liquidity support. Unless stablecoin inflows return and the SSR oscillator stabilizes in positive territory for several weeks, the broader market context may remain risk-off, leaving Bitcoin vulnerable to continued pressure in the near term.

Stablecoin Liquidity Trends Reinforce Bitcoin Market Weakness

Axel Adler’s analysis emphasizes the importance of stablecoin liquidity as a leading indicator for Bitcoin market conditions. The 30-day change in USDT market capitalization functions as a directional gauge of dollar liquidity entering or leaving the crypto ecosystem. Positive readings typically signal fresh capital inflows that can support price appreciation, while negative values indicate liquidity contraction and reduced risk appetite among market participants.
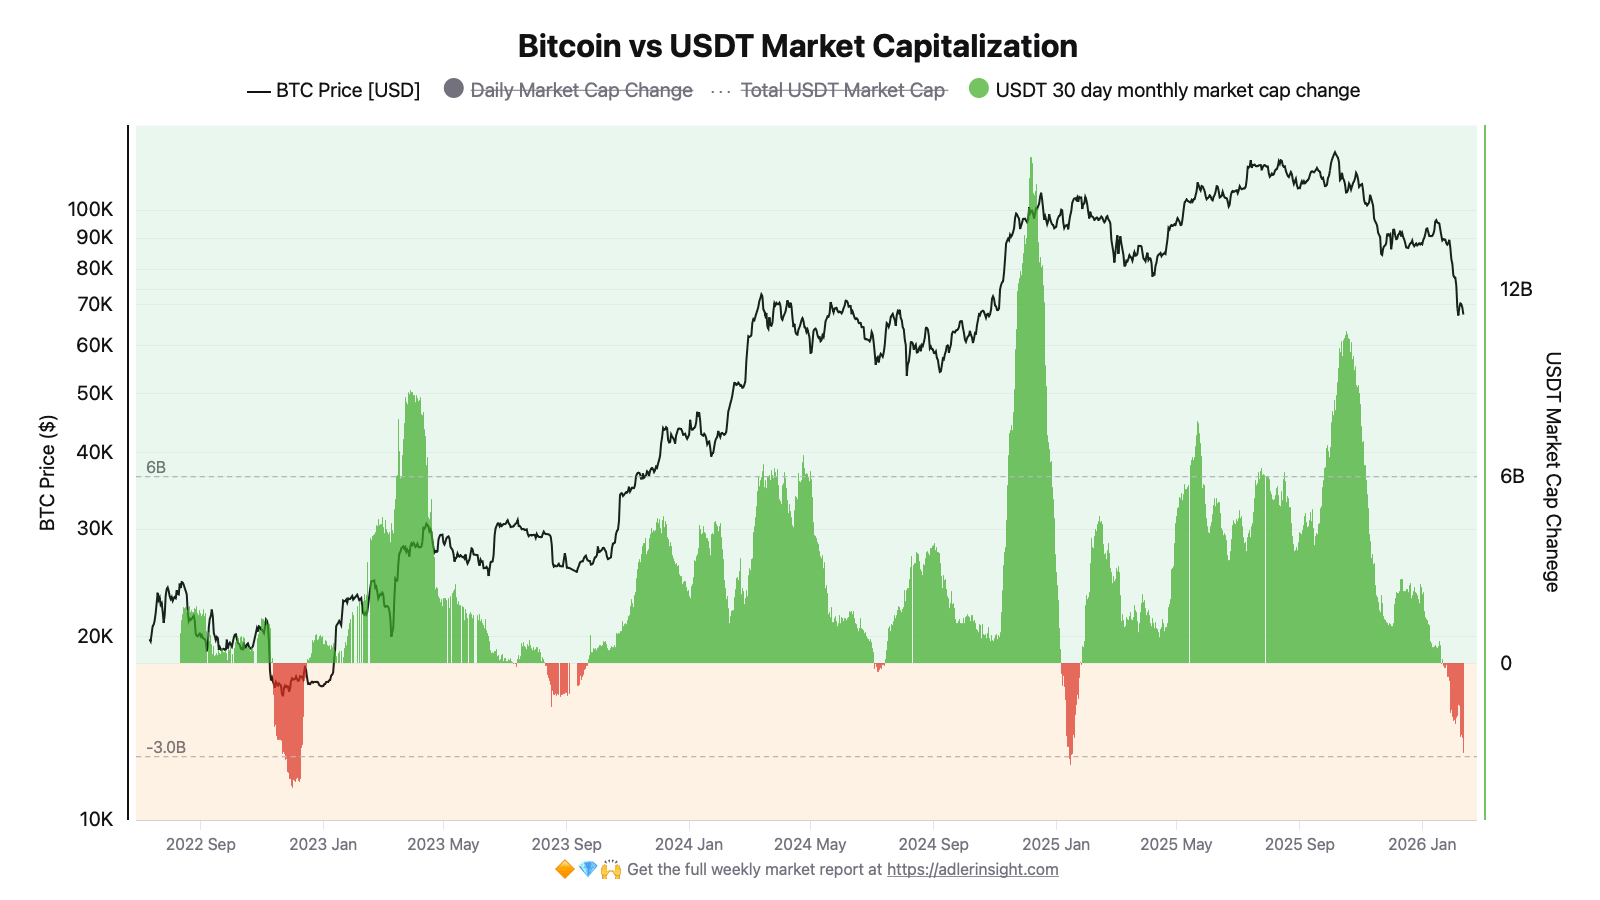
Bitcoin vs USDT Market Capitalization | Source: CryptoQuant

According to the data, January briefly showed signs of recovery. The 30-day USDT market cap change moved into positive territory, reaching approximately $1.4 billion during the first week of the month. This inflow coincided with the Stablecoin Supply Ratio (SSR) Oscillator’s attempt to move into positive territory, alongside a short-term rebound in Bitcoin price. However, the trend reversed later in January, and the latest reading near -$2.87 billion confirms renewed capital outflows.

The alignment between these two indicators appears consistent rather than coincidental. Liquidity inflows helped support January’s temporary recovery, while the return of outflows accompanied the subsequent market weakness.

As long as the 30-day USDT change remains negative, a sustained SSR recovery appears unlikely. Together, these signals suggest the market has shifted back into a risk-off environment, reinforcing the view that the recent rebound lacked durable liquidity support.


Trending Cryptos

Related Questions

QWhat are the two key liquidity indicators mentioned in the article that signal Bitcoin's ongoing market weakness?

AThe two key liquidity indicators are the Stablecoin Supply Ratio (SSR) Oscillator moving back into negative territory and the 30-day change in USDT market capitalization falling to approximately -$2.87 billion.

QAccording to the analysis, what does a negative reading on the 30-day USDT market cap change indicate for the crypto market?

AA negative reading on the 30-day USDT market cap change indicates capital outflows from the crypto ecosystem, signaling liquidity contraction and reduced risk appetite among market participants.

QWhat is the significance of the Stablecoin Supply Ratio (SSR) Oscillator being in positive territory?

AHistorically, positive SSR readings have coincided with stronger Bitcoin price appreciation, indicating that Bitcoin is performing well relative to stablecoin dynamics.

QWhy does the article suggest that January's attempted market recovery ultimately failed?

AJanuary's attempted recovery failed because it lacked sustained liquidity support, as the initial positive trends in USDT inflows and the SSR oscillator reversed later in the month, confirming renewed capital outflows.

QWhat condition does the article state is necessary for the broader market context to shift away from a 'risk-off' environment?

AThe article states that stablecoin inflows need to return and the SSR oscillator must stabilize in positive territory for several weeks for the broader market context to shift away from a risk-off environment.

Related Reads

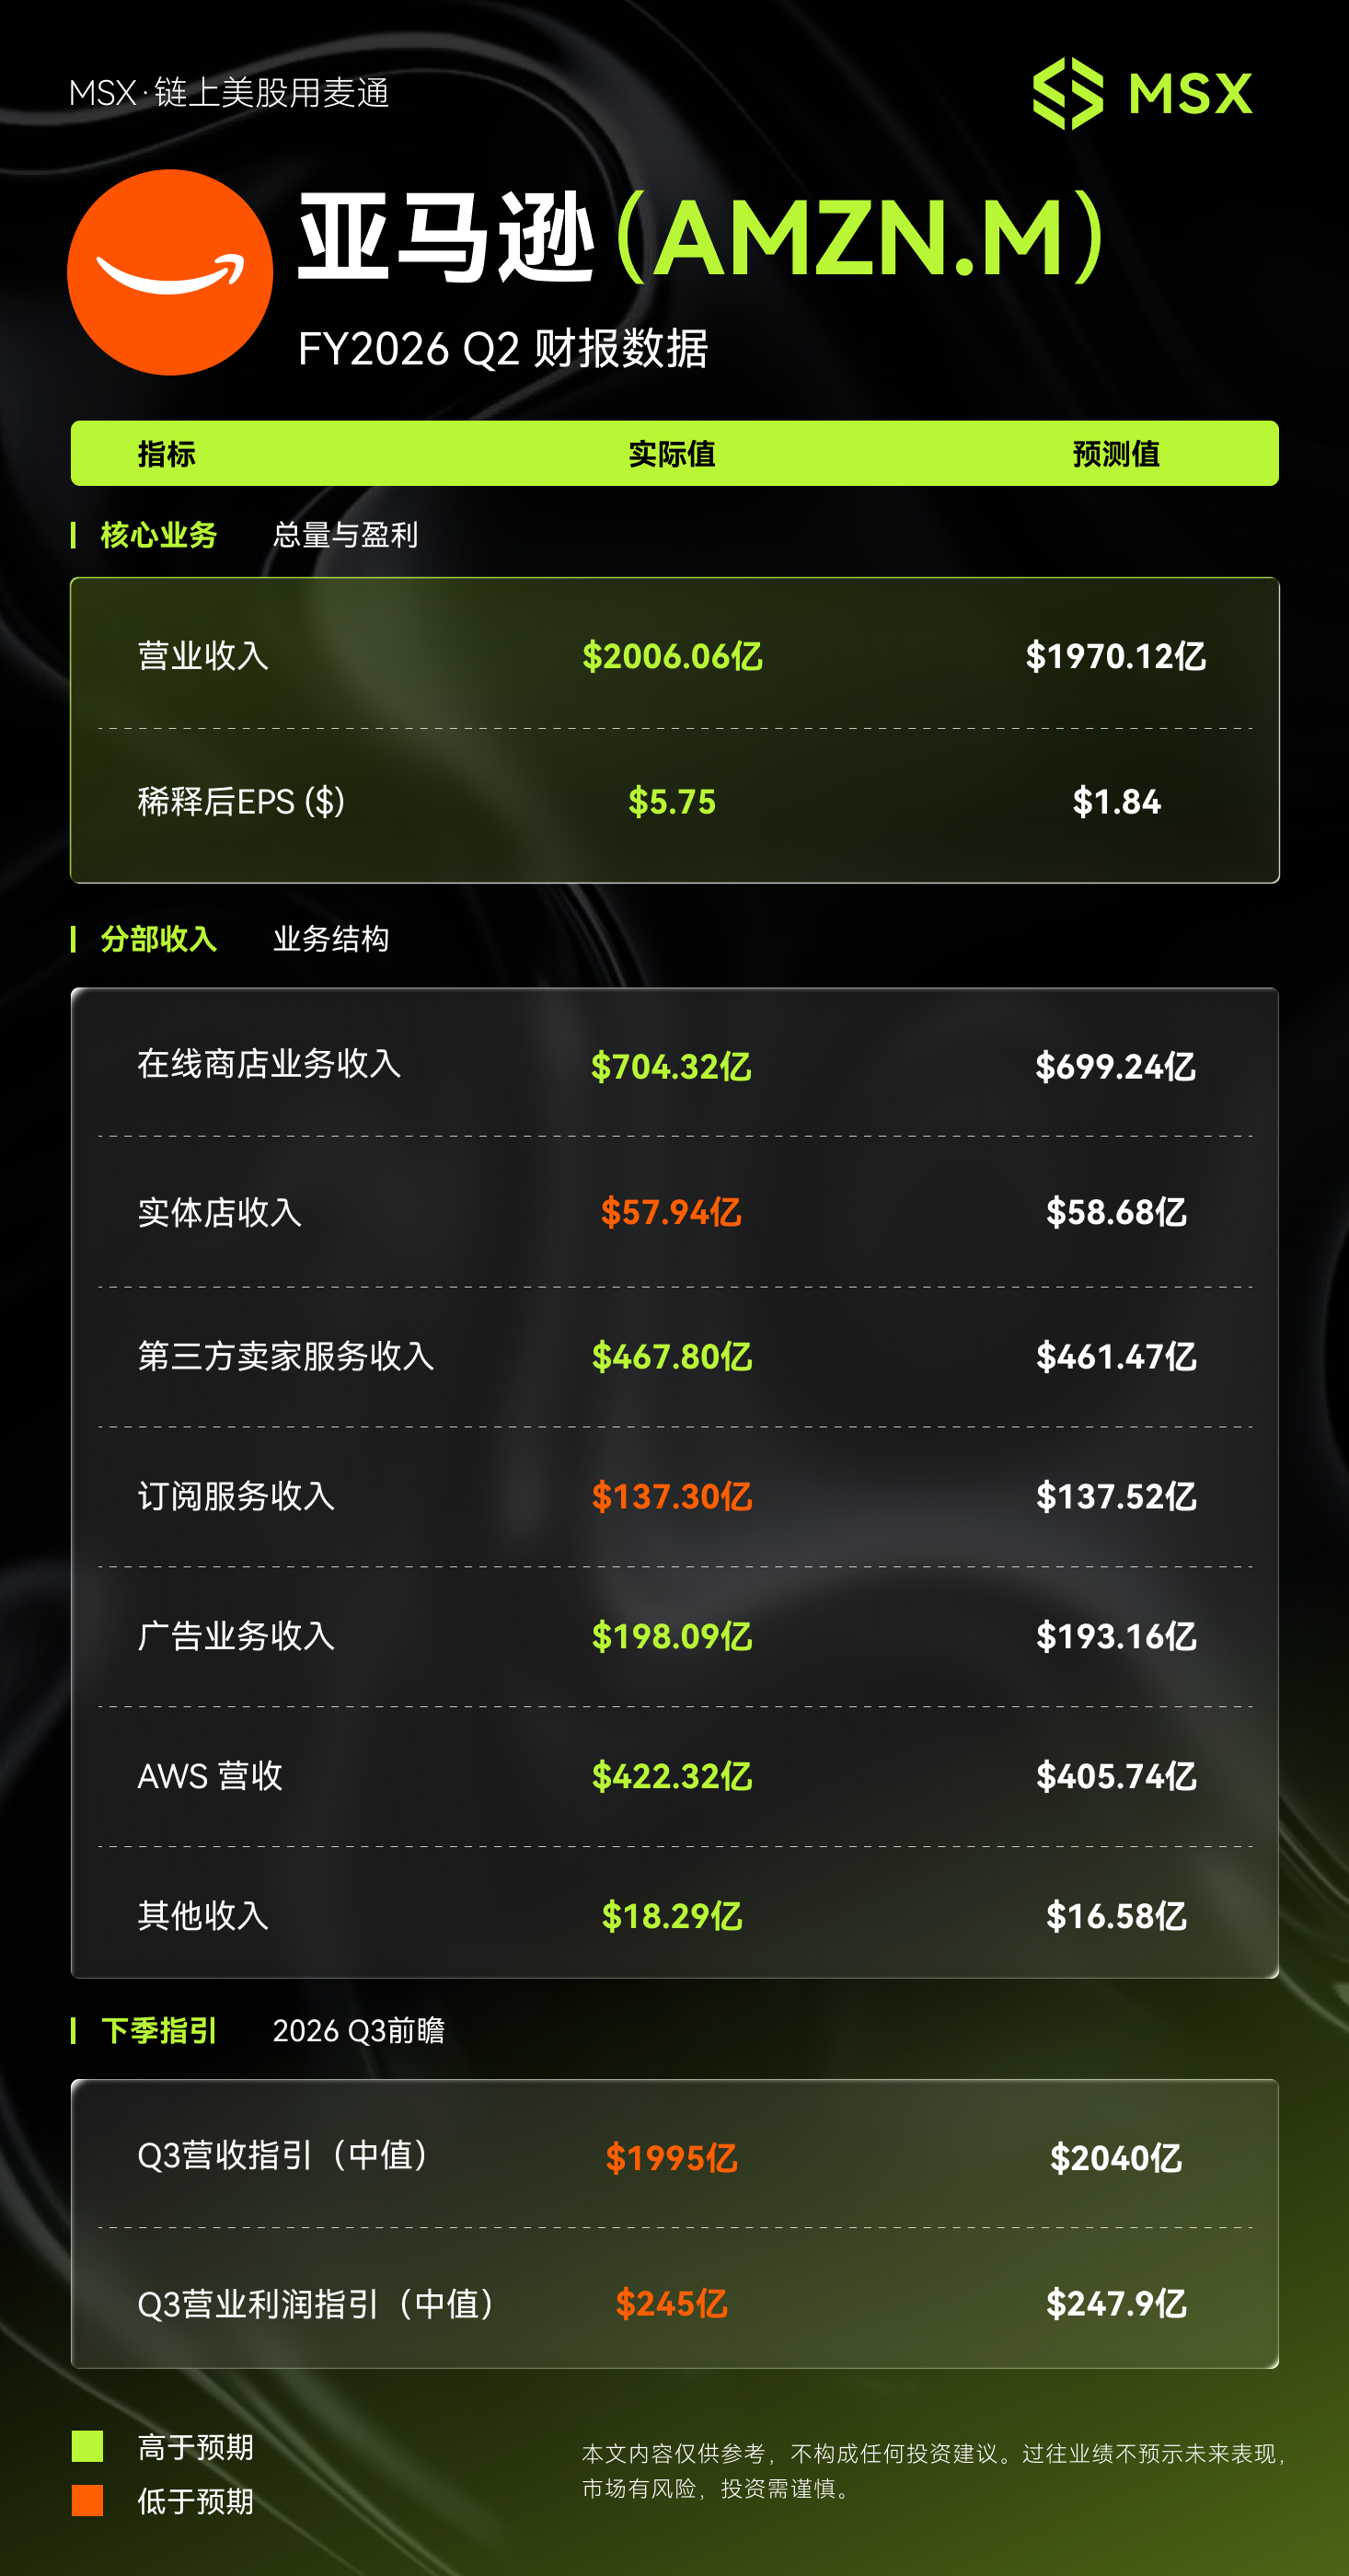
MSX US Stock Daily Insight: Amazon 2026 Q2 Earnings: AWS Records Fastest Growth in Five Years

**MSX Daily US Stock Observation: Amazon's Q2 2026 Earnings: AWS Achieves Fastest Growth in Five Years** Amazon's latest quarterly results exceeded expectations, driven by a strong performance from its cloud computing unit. The company reported revenue of $200.66 billion, surpassing estimates of approximately $197 billion. The key highlight was Amazon Web Services (AWS), which generated $42.232 billion in revenue, surging 37% year-over-year. This marked the segment's fastest growth pace in 18 quarters, indicating robust demand for cloud services. Reported Earnings Per Share (EPS) of $5.75 significantly exceeded the $1.84 forecast. However, this figure included a substantial one-time, non-operating gain of $53.4 billion, primarily from the revaluation of Amazon's investment in AI company Anthropic. Excluding this item, core operating profit was $27.461 billion, a strong increase of 43% compared to the same period last year. Despite the positive results, Amazon provided guidance for the upcoming third quarter that fell short of market expectations. The company's revenue guidance midpoint is $199.5 billion, below the consensus estimate of around $204 billion. Operating profit guidance of $24.5 billion also slightly missed expectations of approximately $247.9 billion. Furthermore, Amazon raised its forecast for full-year capital expenditures to $220 billion, citing rising memory chip costs, which weighed on investor sentiment regarding future profitability. In summary, Amazon's quarter showcased accelerating momentum in its core AWS business. The underlying operational profit growth remains solid. However, cautious forward guidance and increased investment spending present key areas for monitoring in the coming quarters, as the market assesses whether the current growth phase will translate into sustained profit margin expansion.

Odaily星球日报3m ago

MSX US Stock Daily Insight: Amazon 2026 Q2 Earnings: AWS Records Fastest Growth in Five Years

Odaily星球日报3m ago

Cyclical Stock or Growth Stock? Coinbase's Q2 Earnings Report Reveals 'Valuation Disagreement'

Coinbase's Q2 2026 financial results revealed a mixed performance, reigniting debate over whether the company should be valued as a cyclical stock tied to crypto markets or a growth stock with future potential. Total revenue missed expectations at $1.22 billion, down 19% year-over-year. Transaction revenue fell to $599 million, with retail crypto spot trading revenue dropping 30% to $452 million, back to 2023 levels. The company reported a net loss of $359 million, marking its third consecutive quarterly loss. Despite CEO Brian Armstrong's positive commentary on metrics like a 10.3% overall crypto trading market share and 106% growth in prediction markets, the market reacted negatively, with shares dropping over 5% after-hours. A key issue is the decline in core retail trading. While Coinbase touted record market share, this figure includes derivatives and new products. Its traditional crypto spot trading share is likely shrinking. New ventures like prediction markets, while growing, contributed less than $30 million, insufficient to offset the core revenue decline. The valuation debate hinges on perspective. As a cyclical stock, Coinbase remains deeply tied to the crypto bear market, with user attrition and competitive pressures justifying a lower valuation. The company's strategy appears focused on surviving until the next bull cycle. Viewed as a growth stock, however, Coinbase shows promising diversification. Subscription and service revenue reached $555 million, nearly matching transaction revenue. Stablecoin revenue, its second-largest source at $292 million, remains strong through its partnership with Circle. Critically, Coinbase is positioning itself as a leader in the emerging on-chain "agent economy." Over 90% of agent-based stablecoin transactions occur on its Base network, which it believes could handle trillions in future agent transactions. The recent acquisition of Deribit also aims to boost its international derivatives offering. In summary, Coinbase's present struggles are clear, but its future hinges on whether its investments in revenue diversification, stablecoins, and the agent economy can ultimately transform its business model and justify a growth premium.

Odaily星球日报23m ago

Cyclical Stock or Growth Stock? Coinbase's Q2 Earnings Report Reveals 'Valuation Disagreement'

Odaily星球日报23m ago

Global Market Share Survey: Japanese Firms Lead in Semiconductor Materials

Global Market Share Survey: Japanese Firms Lead in Semiconductor Materials According to the 2025 "Major Goods and Services Market Share Survey" by Nikkei, Japanese companies maintain strong positions in semiconductor-related materials. In silicon wafers, Shin-Etsu Chemical ranks first with a 26.3% share, followed by SUMCO at 17.8%. Together, they hold 44.1% of the market, widening their lead over competitors from Taiwan, Germany, and South Korea. In photoresists, Tokyo Ohka Kogyo, JSR, and Shin-Etsu Chemical occupy the top three spots, with a combined share of 60.5%. Despite their strength in materials, Japanese firms have a weaker presence in core semiconductor segments like DRAM and NAND flash memory, where South Korean and U.S. companies dominate. For instance, SK Hynix and Samsung lead in DRAM, while China’s CXMT doubled its share to 6% in 2025. The semiconductor market is projected to grow rapidly, with WSTS forecasting a 90% increase to $1.5112 trillion by 2026. Major players like Samsung, SK Hynix, and Micron are making massive investments to expand capacity. To maintain their edge in materials, Japanese companies must similarly commit to large-scale, risk-taking investments. In contrast, Japan’s automotive sector shows stagnation. Toyota remains the global leader but with only a slight share increase to 12.3%, while Japanese brands are absent from the top five in the EV market. In shipbuilding, Imabari Shipbuilding rose to third place globally with a 7.2% share, benefiting from large container ship deliveries. However, Chinese and South Korean firms dominate the sector, holding the top two positions. Japan aims to revitalize its shipbuilding industry through government and corporate efforts, targeting a near doubling of output by 2035. Addressing labor shortages and adopting advanced technologies like physical AI will be critical for competitiveness.

marsbit48m ago

Global Market Share Survey: Japanese Firms Lead in Semiconductor Materials

marsbit48m ago

Trading

Spot

Hot Articles

What is $BITCOIN

DIGITAL GOLD ($BITCOIN): A Comprehensive Analysis Introduction to DIGITAL GOLD ($BITCOIN) DIGITAL GOLD ($BITCOIN) is a blockchain-based project operating on the Solana network, which aims to combine the characteristics of traditional precious metals with the innovation of decentralized technologies. While it shares a name with Bitcoin, often referred to as “digital gold” due to its perception as a store of value, DIGITAL GOLD is a separate token designed to create a unique ecosystem within the Web3 landscape. Its goal is to position itself as a viable alternative digital asset, although specifics regarding its applications and functionalities are still developing. What is DIGITAL GOLD ($BITCOIN)? DIGITAL GOLD ($BITCOIN) is a cryptocurrency token explicitly designed for use on the Solana blockchain. In contrast to Bitcoin, which provides a widely recognized value storage role, this token appears to focus on broader applications and characteristics. Notable aspects include: Blockchain Infrastructure: The token is built on the Solana blockchain, known for its capacity to handle high-speed and low-cost transactions. Supply Dynamics: DIGITAL GOLD has a maximum supply capped at 100 quadrillion tokens (100P $BITCOIN), although details regarding its circulating supply are currently undisclosed. Utility: While precise functionalities are not explicitly outlined, there are indications that the token could be utilized for various applications, potentially involving decentralized applications (dApps) or asset tokenization strategies. Who is the Creator of DIGITAL GOLD ($BITCOIN)? At present, the identity of the creators and development team behind DIGITAL GOLD ($BITCOIN) remains unknown. This situation is typical among many innovative projects within the blockchain space, particularly those aligning with decentralized finance and meme coin phenomena. While such anonymity may foster a community-driven culture, it intensifies concerns about governance and accountability. Who are the Investors of DIGITAL GOLD ($BITCOIN)? The available information indicates that DIGITAL GOLD ($BITCOIN) does not have any known institutional backers or prominent venture capital investments. The project seems to operate on a peer-to-peer model focused on community support and adoption rather than traditional funding routes. Its activity and liquidity are primarily situated on decentralized exchanges (DEXs), such as PumpSwap, rather than established centralized trading platforms, further highlighting its grassroots approach. How DIGITAL GOLD ($BITCOIN) Works The operational mechanics of DIGITAL GOLD ($BITCOIN) can be elaborated on based on its blockchain design and network attributes: Consensus Mechanism: By leveraging Solana’s unique proof-of-history (PoH) combined with a proof-of-stake (PoS) model, the project ensures efficient transaction validation contributing to the network's high performance. Tokenomics: While specific deflationary mechanisms have not been extensively detailed, the vast maximum token supply implies that it may cater to microtransactions or niche use cases that are still to be defined. Interoperability: There exists the potential for integration with Solana’s broader ecosystem, including various decentralized finance (DeFi) platforms. However, the details regarding specific integrations remain unspecified. Timeline of Key Events Here is a timeline that highlights significant milestones concerning DIGITAL GOLD ($BITCOIN): 2023: The initial deployment of the token occurs on the Solana blockchain, marked by its contract address. 2024: DIGITAL GOLD gains visibility as it becomes available for trading on decentralized exchanges like PumpSwap, allowing users to trade it against SOL. 2025: The project witnesses sporadic trading activity and potential interest in community-led engagements, although no noteworthy partnerships or technical advancements have been documented as of yet. Critical Analysis Strengths Scalability: The underlying Solana infrastructure supports high transaction volumes, which could enhance the utility of $BITCOIN in various transaction scenarios. Accessibility: The potential low trading price per token could attract retail investors, facilitating wider participation due to fractional ownership opportunities. Risks Lack of Transparency: The absence of publicly known backers, developers, or an audit process may yield skepticism regarding the project's sustainability and trustworthiness. Market Volatility: The trading activity is heavily reliant on speculative behavior, which can result in significant price volatility and uncertainty for investors. Conclusion DIGITAL GOLD ($BITCOIN) emerges as an intriguing yet ambiguous project within the rapidly evolving Solana ecosystem. While it attempts to leverage the “digital gold” narrative, its departure from Bitcoin's established role as a store of value underscores the need for a clearer differentiation of its intended utility and governance structure. Future acceptance and adoption will likely depend on addressing the current opacity and defining its operational and economic strategies more explicitly. Note: This report encompasses synthesised information available as of October 2023, and developments may have transpired beyond the research period.

1.1k Total ViewsPublished 2025.05.13Updated 2025.05.13

What is $BITCOIN

Discussions

Welcome to the HTX Community. Here, you can stay informed about the latest platform developments and gain access to professional market insights. Users' opinions on the price of BTC (BTC) are presented below.

活动图片