Core Points:
• HYPE Multi-Cycle Trend Structure Deep Deconstruction: Weekly tracking. (Details in Part 1)
• BTC Strategy Execution (Short-term) Effectiveness Verification: Bitcoin followed the established short-term strategy last week, completing one short-term short position (1x leverage), successfully achieving a return of approximately 6.41%. (Details in Table 1)
• BTC Strategy Execution (Medium-term) Effectiveness Verification: Bitcoin followed the established medium-term strategy last week, continuing to hold the short position established at $89,000 (1x leverage). As of last week's close (approx. $65,971), the profit is about 25.88%, with a maximum profit during the period of about 32.58%.
• Core View (Short-term) Verification: Bitcoin continued to maintain a weak range-bound oscillation pattern last week. The current trend is in line with expectations.
• BTC This Week's Market Trend Forecast and Medium & Short-term Trading Strategies.
The following will review the market forecast, strategy execution, and specific trading process in detail.
I. HYPE Multi-Cycle Trend Structure Analysis and Short-term Trading Review:
HYPE Daily K-Line Chart
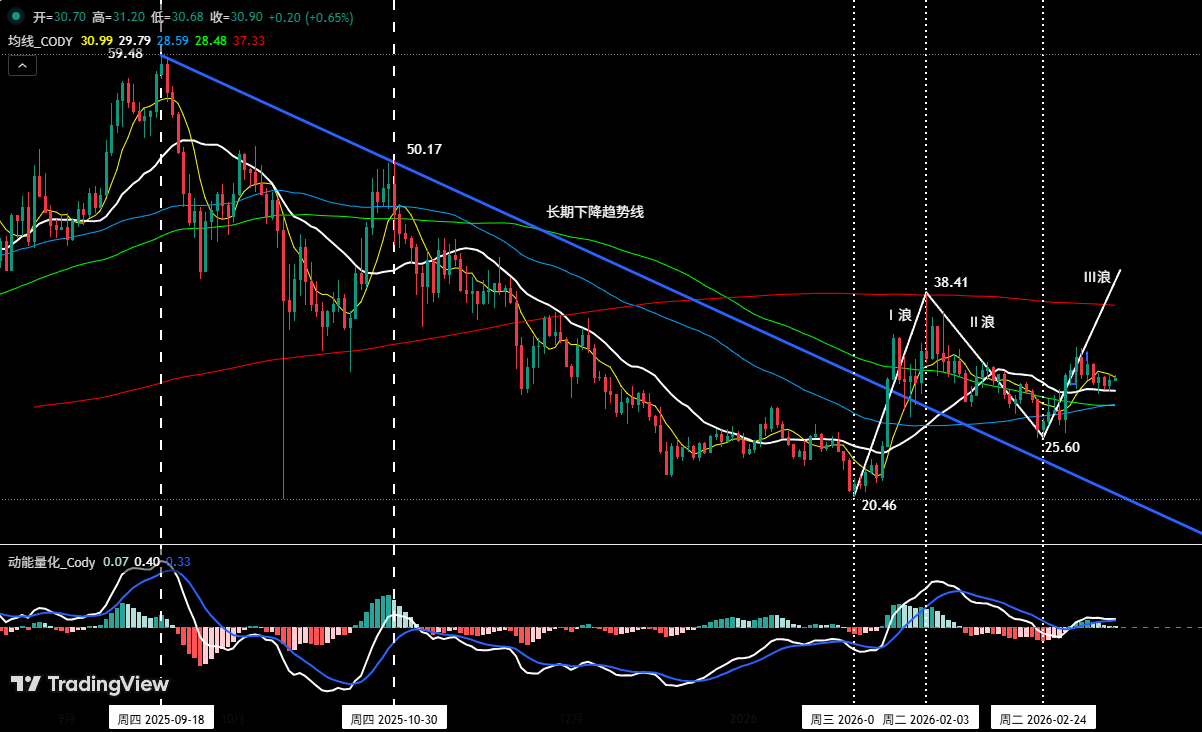
Figure 1
We first highlighted the investment opportunity in HYPE in the weekly review on February 22, clearly stating the potential for a major upward (Wave III) move in the near term. In the weekly review on March 1, we reiterated: the low of $25.60 on February 24 might be the starting point of Wave III, which is currently underway.
1. Large-scale Trend Structure Analysis (See Figure 1):(Based on market evolution after January 21)
• Wave I (Impulse Wave): From the low of $20.46 on January 21 to the high of $38.41 on February 3, lasting 14 days, with a maximum gain of 87.73%.
• Wave II (Corrective Wave): From the high of $38.41 on February 3 to the low of $25.60 on February 24, lasting 20 days, with a maximum decline of 33.35%.
• Wave III (Potential Impulse Wave): From the low of $25.60 on February 24 to the present, the market is currently running, lasting 13 days so far, with a maximum gain of 31.5%.
• From the Moving Average System: The upward trend starting on February 24 has effectively broken through multiple moving average resistances. The current price is retesting key medium-term moving averages (e.g., the 21-day MA) to test the strength of support after the breakout. In terms of volume, it shows a healthy state of "increased volume on rallies, decreased volume on pullbacks," with good volume-price coordination.
• From the Momentum Quantification Model: The momentum line on the daily chart continues to operate above the zero axis, indicating the market is in a clear uptrend. The current movement is in a stage of momentum accumulation and consolidation.
2. Small-scale Structure Analysis:(Based on market movement after March 2)
HYPE 1-hour K-Line Chart
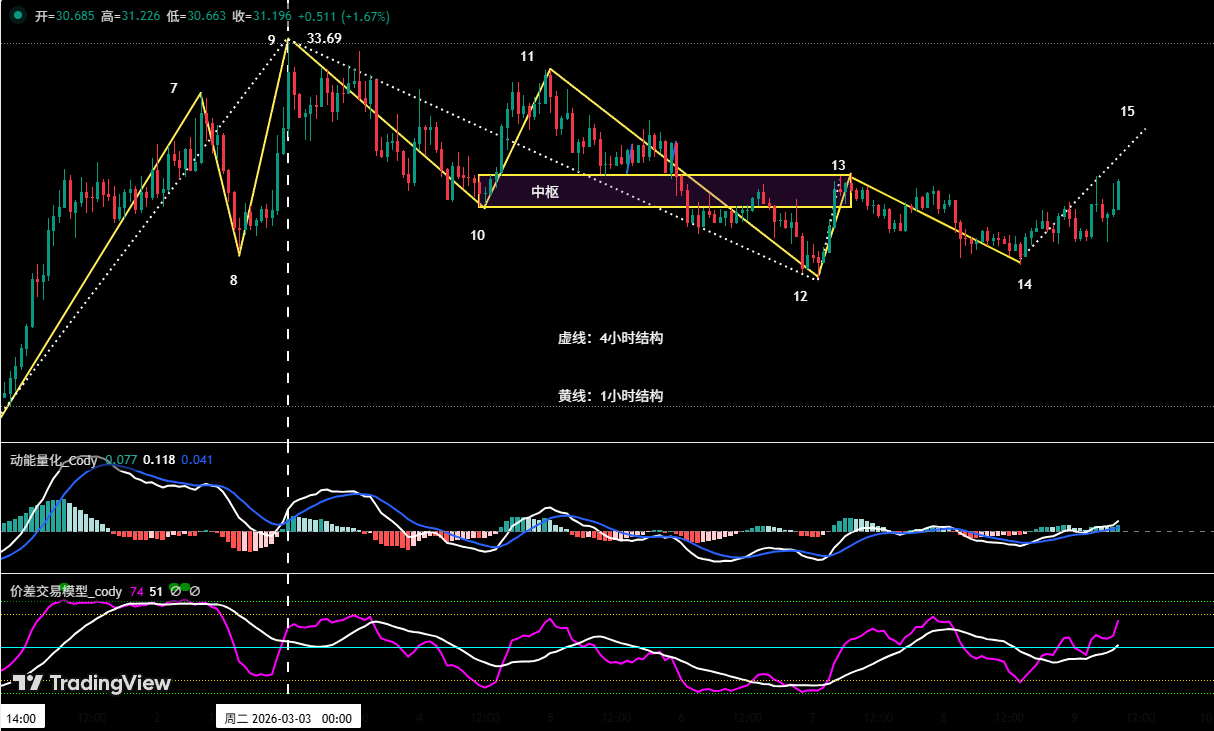
Figure 2
As shown in (Figure 2), HYPE upward move starting from the low on February 24 entered a correction phase after touching the high of $33.69 on March 2. Below, we will start with the 1-hour chart structure to analyze the end signals and potential turning points of this correction in detail.
• Internal Structure Division:(From the high of $33.69 on March 2 to present)
It can be subdivided into a 5-segment structure: 9-10, 10-11, 11-12, 12-13, 13-14, forming a complete corrective move.
• Central Pivot (Zhongshu) Construction: In the 5-segment structure, 9-10 is the entering segment, 13-14 is the leaving segment, and 10-11, 11-12, 12-13 these 3 segments form the central pivot structure.
• Correction Turning Point Formation and Validation: As shown in (Figure 2), a divergence signal has formed between the entering segment and the leaving segment. Therefore, we believe the probability is high that this correction ended at endpoint 12. If the upward move starting from endpoint 12 first effectively stabilizes above the $31.5 resistance level, and then breaks through the local previous high of $32.75, the probability of this correction ending and a new upward wave beginning will significantly increase. (Special emphasis: Any subsequent correction in HYPE should not fall below the price of endpoint 12 (approx. $29.44). Otherwise, the above conclusion is invalid, and the correction turning point will be delayed)
3. HYPE Upside Risk Warning: Although HYPE's trend has some independence, it cannot completely detach from Bitcoin's overall environment. If Bitcoin continues to weaken and breaks below key support (e.g., around $65,000), it may increase selling pressure across the altcoin market, thereby affecting HYPE's rebound momentum.
4. HYPE Short-term Trading Review (1x Leverage):(03.02~03.08)
We anticipated that HYPE was in an upward trend on the daily chart. Last week, based on the core trading strategy of "following the trend" and combined with the analysis of the hourly correction, we did not open any new (long) positions during this period.
II. Bitcoin Last Week's Trading Strategy and Key Level Review:(03.02~03.08)
1、Short-term Strategy Review:(See Table 1)
Strictly following the trading signals from our self-built Spread Trading Model and Momentum Quantification Model, and combined with market trend forecasts, we completed one short-term (short) trade last week, with a profit of 6.41%.
1、Bitcoin Short-term Trade Details Summary:(Leverage*1x)
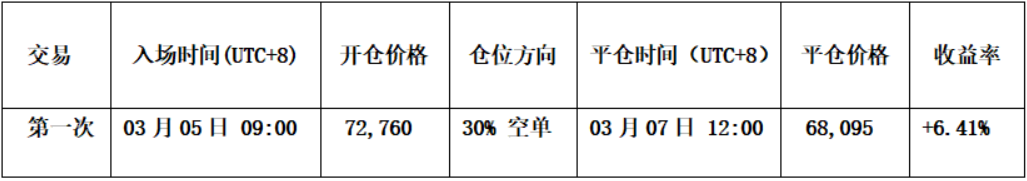
Table 1
2、Short-term Trade Review:(See Figure 3)
• Entry: The price rebounded to near the important resistance level of $74,500, encountered resistance, and the Spread Trading Model triggered a top warning signal (green dot in the chart). Combined with sell signals from both models, a 30% short position was established at $72,760.
• Risk Control: Initial stop-loss for the short position was set above $75,500.
• Exit: The price fell to near $68,000, and the Spread Trading Model triggered a bottom warning signal (red dot in the chart). The position was fully closed near $68,095.
• Summary: This trade yielded a profit of 6.41%.
Bitcoin 60-minute K-Line Chart:(Momentum Quantification Model + Spread Trading Model)
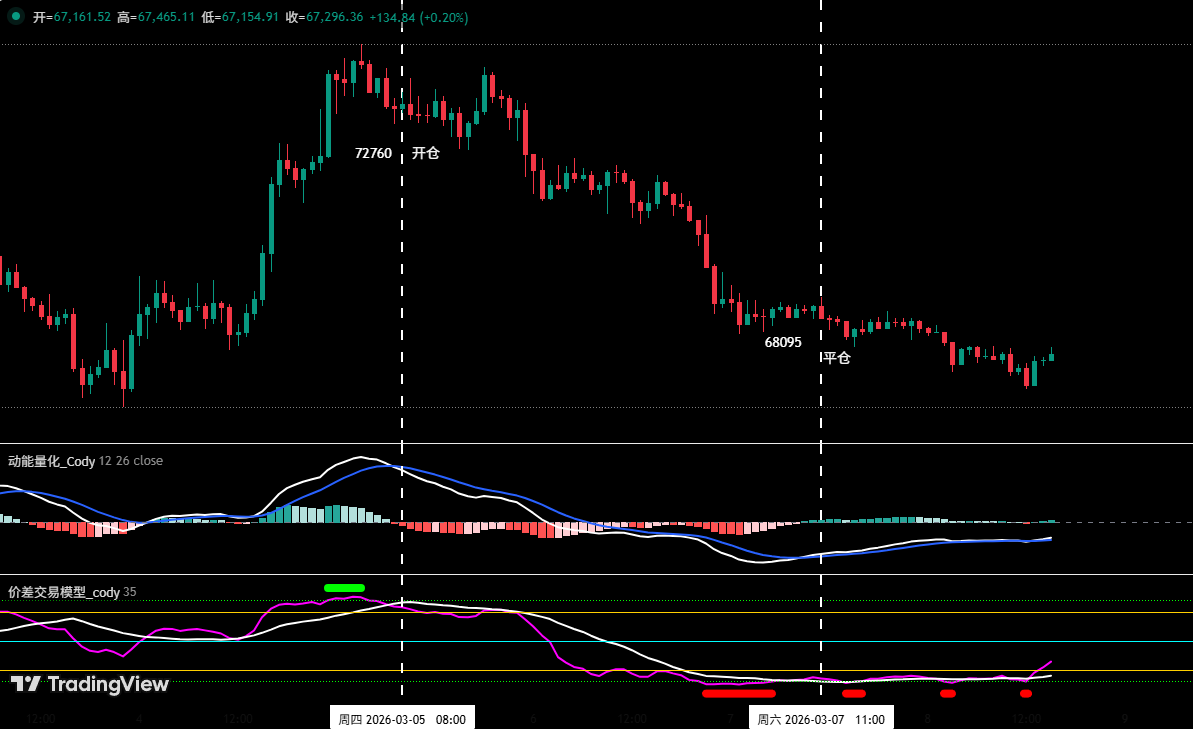
Figure 3 (Short-term Trade Illustration)
2、 Medium-term Strategy Review:
Medium-term Strategy: Continue holding the 60% short position established near $89,000 (January 28). As of last week's close (closing price approx. $65,971), the profit is about 25.88%.
III. Bitcoin Technical Indicator Analysis
Combining market movements, the author conducts an in-depth analysis of various Bitcoin technical indicators from multiple models and multi-dimensional perspectives based on a self-built trading system.
1. Analysis from the weekly chart level, as shown in (Figure 4):
Bitcoin Weekly K-Line Chart:(Momentum Quantification Model + Sentiment Quantification Model)
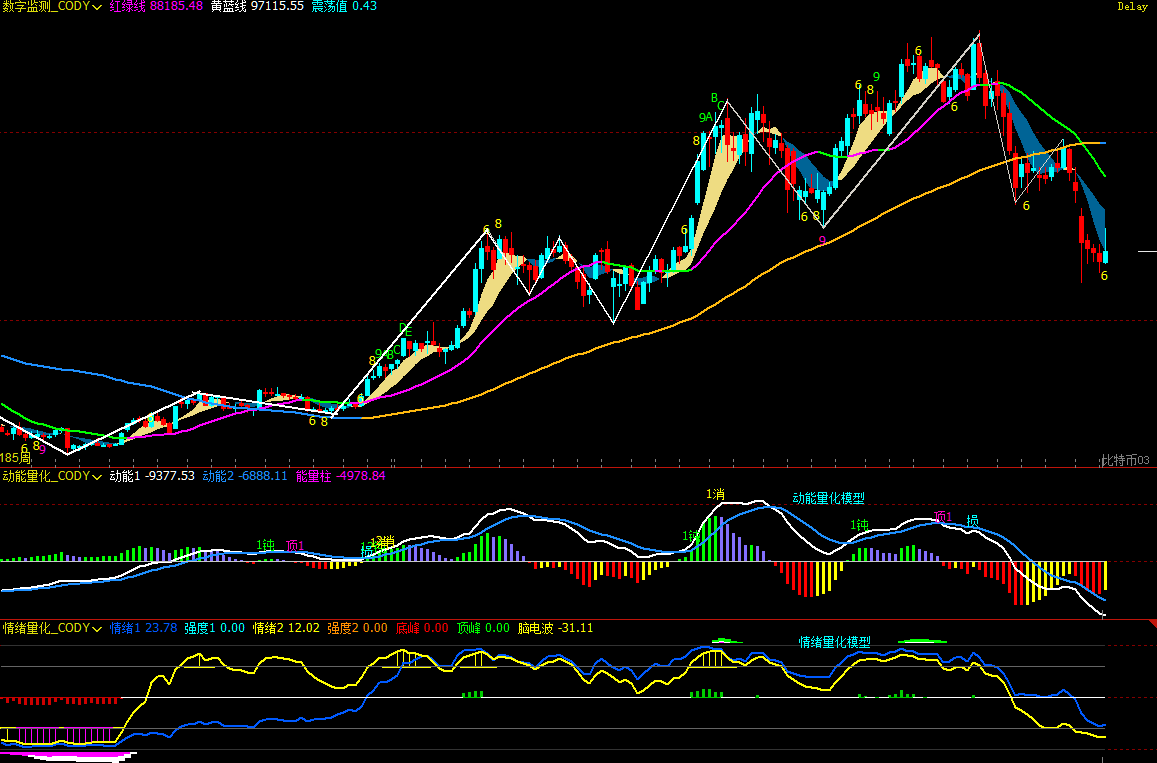
Figure 4
• Momentum Quantification Model: Technical indicators show the momentum line declining synchronously, negative energy bars gradually shortening, with no momentum divergence signal appearing.
• Sentiment Quantification Model: Blue sentiment line value 23, intensity zero; Yellow sentiment line value 11, intensity zero, peak value is 0.
• Digital Monitoring Model: Moving averages show a bearish alignment. Last week closed with a small bullish candle with a long upper shadow, up 0.3%; No bottom digital monitoring signal appeared.
Comprehensive Analysis: Based on the data from the above three models, we believe the current Bitcoin weekly chart bearish trend is clear and continuing. Whether it's momentum divergence, extreme sentiment release intensity, or bottom signals from the digital model, none have appeared. It is currently in a falling mid-way pattern. After several weeks of sideways consolidation, the market is more likely to choose to探底 (explore lower levels) again.
2. Analysis from the daily chart level: As shown in (Figure 5)
Bitcoin Daily K-Line Chart:(Momentum Quantification Model + Sentiment Quantification Model)
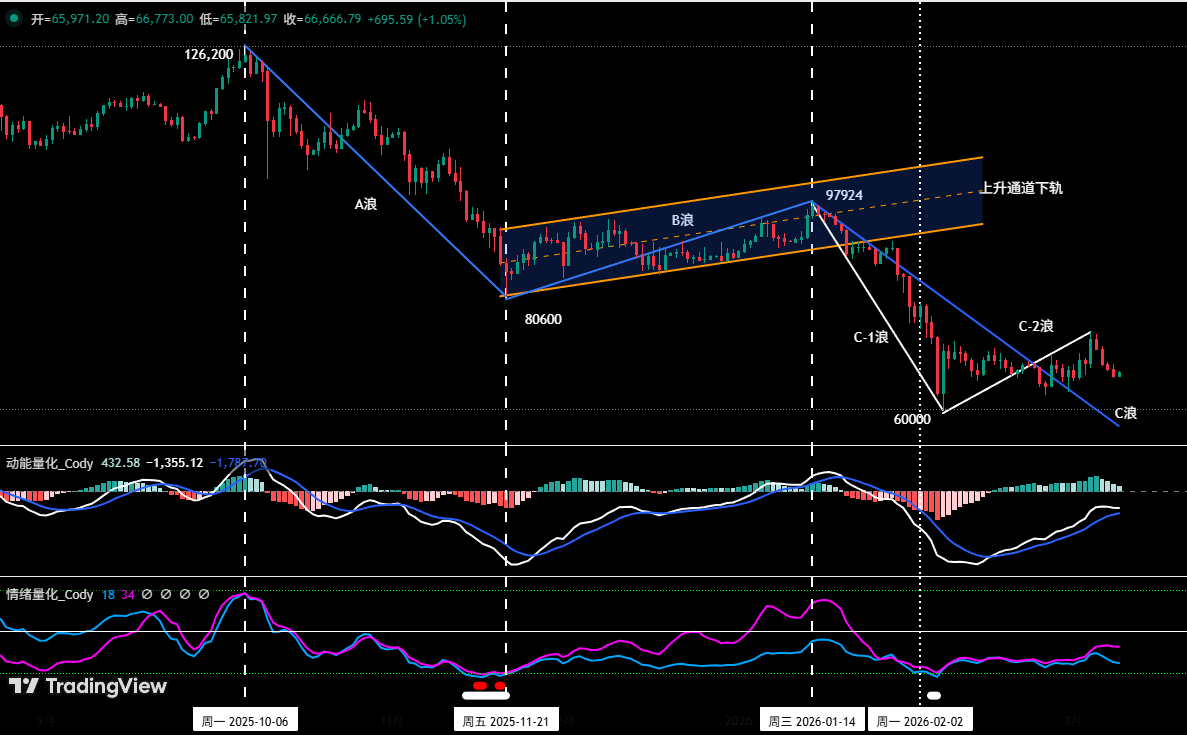
Figure 5
• Momentum Quantification Model: Last week's overall performance was "rising first then falling later". The momentum line is rising synchronously below the zero axis, positive energy bar changes are disordered.
• Sentiment Quantification Model: At the end of last week's daily session, the blue sentiment line value was 19, intensity zero; the purple sentiment line value was 35, intensity zero, slowly exiting the oversold area.
Comprehensive Analysis: After analyzing the data from the Momentum Quantification and Sentiment Quantification models, we believe the technical structure of Bitcoin's daily bearish trend has not changed. The current行情 (market movement) is an oversold rebound, and due to disordered buying momentum, cautious market sentiment, and low capital participation, this rebound is weak with poor sustainability.
IV. This Week's Market Forecast:(03.09~03.15)
1、Bitcoin Upward Central Pivot Construction (Based on post-February 6 low):(Updated weekly)
Bitcoin 4-hour K-Line Chart
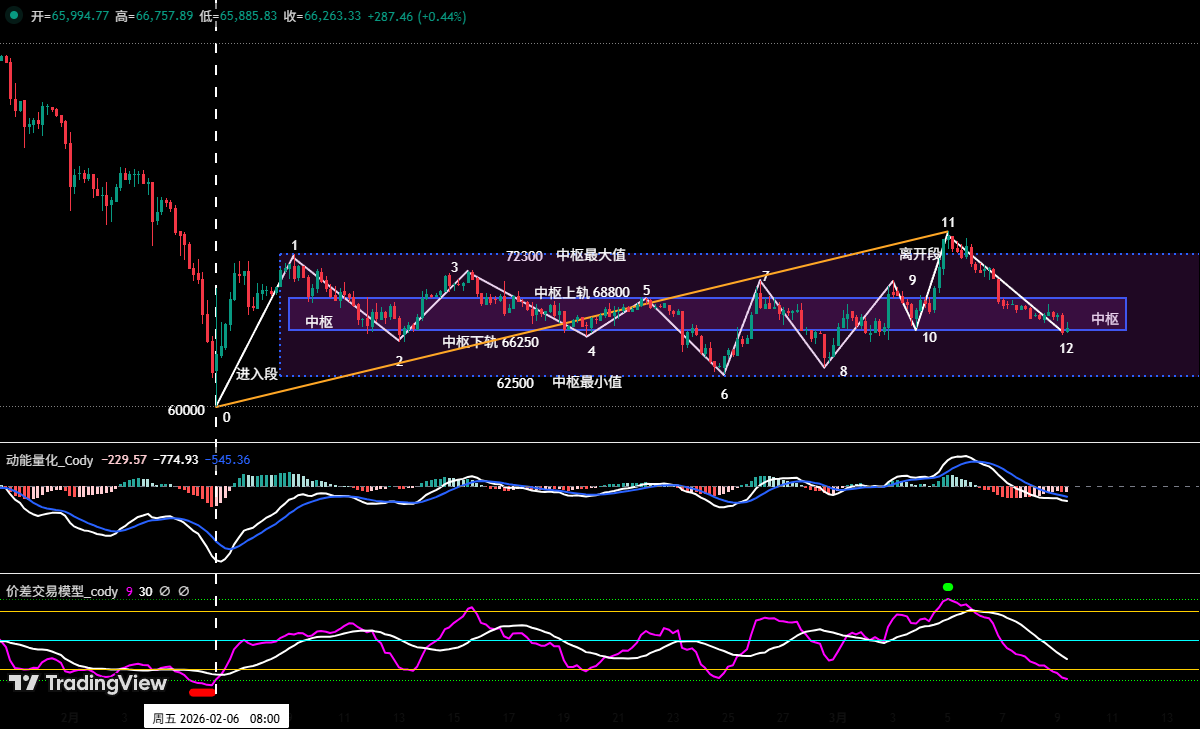
Figure 6
Using Bitcoin's 4-hour chart as the analysis周期 (cycle):
• Central Pivot Construction: As seen in (Figure 6): The "Upward Central Pivot" structure is basically formed. Its highest resistance is around $72,300, and the lowest support is around $62,500; the upper轨 (rail) of the pivot is around $68,800, and the lower轨 (rail) is around $66,250.
2、 C-2 Wave Rebound End Judgment:
• We maintain the previous core analysis framework: The upward move in Bitcoin starting from the low on February 6 (approx. $60,000) is, in nature, an oversold rebound within the large-scale C wave correction, specifically the C-2 wave. This is expected to be followed by a C-3 wave corrective行情 (market movement).
• Bottom Warning: As seen in (Figure 6): Our self-built Spread Trading Model triggered a bottom warning signal (red dot) near Endpoint 0 on February 6, accurately capturing the start of the C-2 wave.
• Top Warning: At the recently formed Endpoint 11, the Spread Quantification Model triggered a top warning signal (green dot). The successive appearance of bottom and top warning signals confirms the formation of a complete rebound wave from a model perspective, suggesting upward momentum may be exhausted.
3、This Week's Core View: Maintain the range-bound oscillation pattern. The C-2 wave oversold rebound may be nearing its end. Pay attention to the direction choice. Strategically, firmly implement the operational principle of "reduce positions (longs) on rallies, control risk".
4、Core Resistance Levels:
• First Resistance Area: $72,300-$74,500 area (Previous high volume transaction area)
• Second Resistance Area: $79,500-$80,600 area (Near the November 2025 low)
5、Core Support Levels:
• First Support Level: Around $65,000 (Previous important support area)
• Second Support Level: $60,000~$62,500 area (Near the February 6 low)
• Third Support Level: Around $57,400
V. This Week's Trading Strategy (Excluding Sudden News Impact):(03.09~03.15)
1、 Medium-term Strategy: See Figure Seven
Bitcoin Daily K-Line Chart:(Position Monitoring Model)
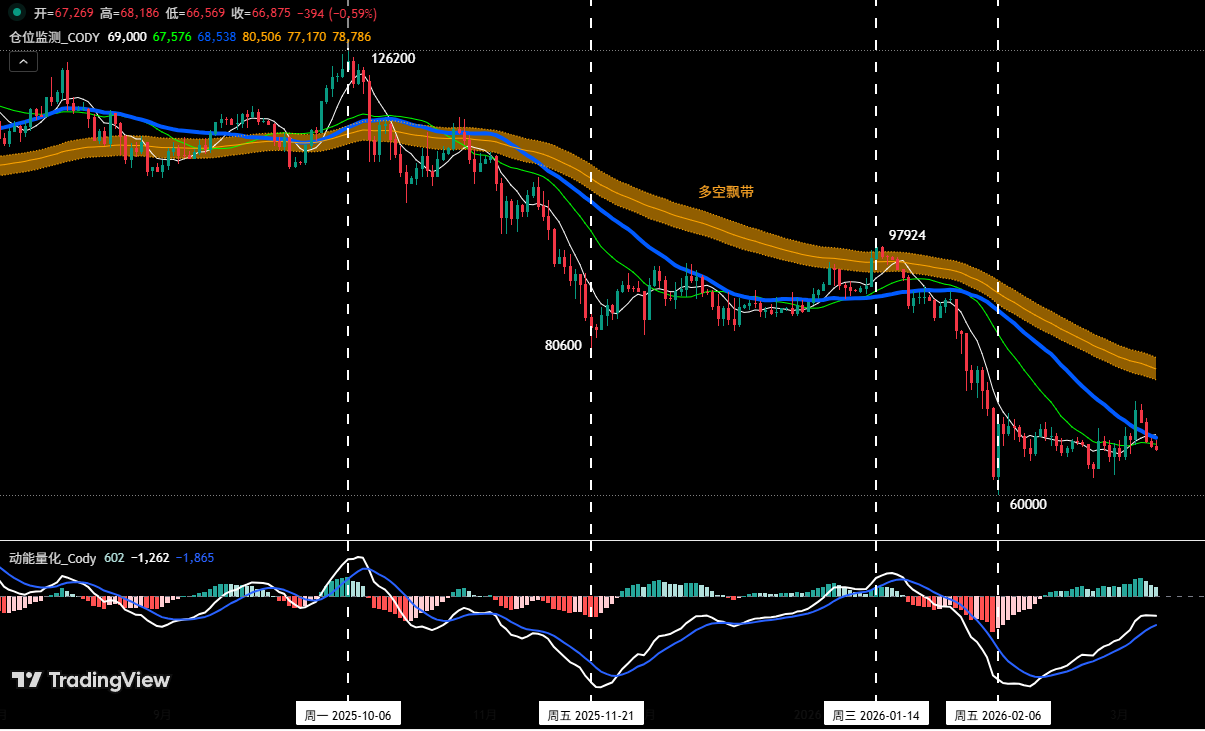
Figure 7
Position Monitoring Model: The current price is below the Bull-Bear Ribbon (yellow), so continue holding the 60% short position established at $89,000 (January 28).
• If the price反弹 (rebounds) and effectively breaks above $74,500, reduce the medium-term position to 40%.
• If the price反弹 (rebounds) and effectively breaks above and stabilizes above the Bull-Bear Ribbon, clear all medium-term positions.
2、 Short-term Strategy: Use 30% of the position, set stop-loss points, and look for "spread" opportunities based on support and resistance levels. (Use 30-minute/60-minute as the operation cycle).
3、 Since the medium-term market direction is bearish, to dynamically respond to complex market changes and combined with signals from our self-built trading model, we have prepared A/B two short-term operation plans:
• Plan A: Sell on rallies encountering resistance.
• Entry: When the price反弹 (rebounds) to the $72,300~$74,500 area, triggers resistance signals, and combines with model top signals, establish a 30% short position.
• Risk Control: Initial stop-loss for the short position set above $75,500.
• Exit: When falling near important support levels and combined with model signals, gradually close the position to take profits.
• Plan B: Follow-through breakout short.
• Entry: When the price effectively breaks below the lower轨 (rail) of the central pivot at $66,250, then retraces to this level but fails to hold above it, and combines with model top signals,顺势 (follow the trend) to establish a 30% short position.
• Risk Control: Initial stop-loss for the short position set above $67,500.
• Exit: When falling to support levels and combined with model signals, gradually close the position to take profits.
VI. Special Notes:
1. When opening a position: Immediately set the initial stop-loss level.
2. When profit reaches 1%: Move the stop-loss to the entry price (breakeven point) to ensure capital safety.
3. When profit reaches 2%: Move the stop-loss to the 1% profit level.
4. Continuous Tracking: Thereafter, for every additional 1% profit, move the stop-loss up 1%同步 (synchronously), dynamically protecting and locking in profits.
Financial markets change rapidly. All market analysis and trading strategies require dynamic adjustment. All views, analytical models, and operational strategies involved in this article are derived from personal technical analysis, intended solely for personal trading log purposes, and do not constitute any investment advice or operational basis. The market involves risks, investment requires caution. Do not make decisions based solely on this.