Bitcoin Market Faces A Potential Profitability Reset As More Coins Slip Out Of Profit

bitcoinistPublished on 2026-06-12Last updated on 2026-06-12

Abstract

The Bitcoin market is experiencing significant pressure, with the price dropping to around $61,000, leading to a sharp decline in the percentage of BTC supply held in profit. Analysts note this metric is approaching a critical 45% threshold, historically associated with market stress and a potential "profitability reset." This shift indicates broad-based weakness, moving many holders from unrealized gains to losses, which often helps eliminate excess market speculation. The process involves a redistribution of coins from weaker to longer-term investors, potentially creating short-term volatility but a healthier market structure over time. While not pinpointing a market bottom, such low profitability levels have coincided with capitulation risks and long-term buying opportunities in past cycles. Current analysis points to key liquidity zones at $64,000-$66,500 (upside) and $58,000-$60,000 (downside), with the market undergoing a deep reset rather than a euphoric phase.

The Bitcoin market continues to take a hit, and investors both big and small are heavily feeling the ongoing market pressure, which has caused its price to drop to $61,000. The amount of BTC in profit territory is steadily dropping following the recent decline in price, putting the market in a more bearish condition.

Supply In Profit Contracts Amid Waning Bitcoin Price Action

With a substantial fall in the percentage of circulating supply held in profit, Bitcoin is nearing a turning point. After the sharp decline, crypto analysts suggest that the market is drawing closer to what they describe as a historical profitability reset.

CryptoZone highlighted in a CryptoQuant Quicktake post that the BTC on-chain structure is showing signs of a significant profitability contraction as the percentage of supply on profit metric falls toward the 45% threshold. Historically, this zone has coincided with periods of heightened market stress, where a large share of market players move from unrealized gains to unrealized losses.

According to the expert, this decline indicates that the recent price weakness is having a broad impact across the network rather than being limited to a small group of holders. With profitability metrics rapidly changing, this trend offers clues to the balance between fear, capitulation, and opportunity.

Source: Chart from CryptoZone on CryptoQuant

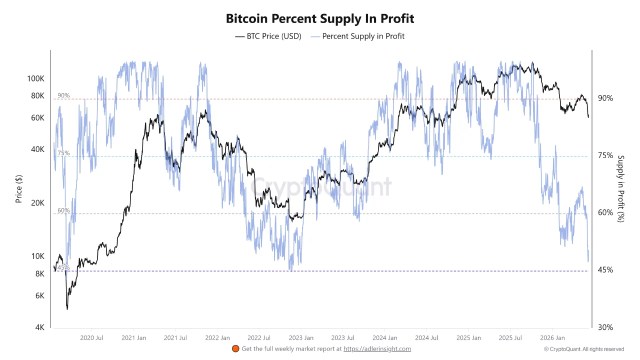
During previous market cycles, the expert stated that profitability levels above 90% were often linked to strong bullish momentum and widespread investor confidence. In contrast, when the metrics drop to 45%, it usually unfolds during late-stage corrections when sentiment becomes increasingly pessimistic.

Since the current correction began, a substantial portion of Bitcoin supply has already lost its profit cushion, reflecting a meaningful reset in market expectations. From an on-chain perspective, profitability compression is frequently used as a method to eliminate excess speculation from the market.

A Redistribution Process For The BTC Market

As weaker holders take out their positions under pressure, coins are slowly migrating toward investors with longer investment horizons. This redistribution process can generate short-term volatility. However, in the past, it has contributed to healthier market structures over time.

The metric nearing the 45% level is a development that should be monitored closely. While no single metric can determine an exact market bottom, previous cycles suggest that profitability readings in this range mostly occur with elevated capitulation risk and the emergence of long-term accumulation opportunities.

Currently, the data underscores a market that is witnessing a deep reset rather than operating on a phase of euphoria, highlighting the importance of monitoring holder behavior in the upcoming weeks. Crypto analyst Ted Pillows noted that Bitcoin is demonstrating decent liquidity clusters to both upside and downside.

On the upside, the crypto king has short-side liquidity around the $64,000 to $66,500 zone. Meanwhile, on the downside, BTC showcases long-side liquidity around the $58,000 to $60,000 range. Despite the significant decline, fresh longs are still coming in.

BTC trading at $62,775 on the 1D chart | Source: BTCUSDT on Tradingview.com

Related Questions

QAccording to the article, what is the significance of the Bitcoin 'supply in profit' metric approaching the 45% threshold?

AHistorically, the 45% threshold for the 'supply in profit' metric has coincided with periods of heightened market stress and late-stage corrections, where a large share of market players move from unrealized gains to unrealized losses. It signals a potential profitability reset and often occurs alongside elevated capitulation risk and the emergence of long-term accumulation opportunities.

QWhat are the current upside and downside liquidity clusters for Bitcoin as mentioned by crypto analyst Ted Pillows?

AAccording to analyst Ted Pillows, Bitcoin has short-side liquidity (upside) around the $64,000 to $66,500 zone. On the downside, it showcases long-side liquidity around the $58,000 to $60,000 range.

QWhat broader impact does the decline in the percentage of Bitcoin supply in profit indicate, according to the expert from CryptoZone?

AThe decline indicates that the recent price weakness is having a broad impact across the entire Bitcoin network, rather than being limited to just a small group of holders. It reflects a meaningful reset in market expectations and offers clues to the balance between fear, capitulation, and opportunity.

QHow does the article describe the process happening in the BTC market as weaker holders exit their positions?

AThe article describes it as a redistribution process. As weaker holders exit their positions under pressure, their coins slowly migrate toward investors with longer investment horizons. While this can generate short-term volatility, historically it has contributed to healthier market structures over time.

QWhat historical profitability levels are linked to strong bullish momentum, and what does the current level suggest about the market phase?

AHistorically, profitability levels above 90% are often linked to strong bullish momentum and widespread investor confidence. The current data, with metrics nearing 45%, underscores a market witnessing a deep reset rather than operating in a phase of euphoria, highlighting the importance of monitoring holder behavior.

Related Reads

pump.fun's New Feature Brings 'Black Mirror' Into Reality

The article begins by recounting a dark fictional story from *Black Mirror* (Season 7, Episode 1 "Common People"), where a man is forced to perform humiliating tasks online to pay for his wife's life-sustaining medical subscription. It then draws a parallel to a new real-world feature on the crypto platform pump.fun called "Pump.fun Go," which allows users to post and complete paid bounty tasks. This feature gained mainstream attention, often negatively, through extreme examples. A prominent case involved a bounty of 40 SOL (~$2,600) offered to permanently tattoo "$bountywork" on one's forehead. An Indian man completed the task, stating the money "changed his life," and later earned significantly more from a related meme coin. Another bounty paid 200 SOL (~$14,000) for a "bounty.fun" forehead tattoo, with the participant simply stating, "We need the money." The article highlights how this system can amplify darkness, citing the dev behind $Bountywork who spent thousands on bounties for attention-grabbing stunts like eating bugs or drinking hot sauce for small sums. It compares this to past tragic live-streaming incidents where people harmed themselves for money, noting regulation cannot stop those in desperate need. However, it also points to positive, altruistic bounties that have emerged, such as organizing anti-work rallies in New York, performing random acts of kindness for strangers, organizing community food drives, or even helping an elderly person cross the street. The piece concludes by acknowledging the platform reflects both the dark and light sides of human nature when actions are given a price, hoping for more of the latter.

marsbit4m ago

pump.fun's New Feature Brings 'Black Mirror' Into Reality

marsbit4m ago

As the US and Japan Hike Interest Rates, Which Asset Class is Most at Risk?

This week, global markets face two major events: the Bank of Japan's likely interest rate hike and the US Federal Reserve's FOMC meeting. For risk assets, it is a pivotal and volatile week. In the US, expectations for rate cuts have faded dramatically. May's higher-than-expected CPI and resilient jobs data have shifted the Fed's focus from potential cuts to the possibility of future hikes. New Fed Chair Wash is unlikely to raise rates at this meeting, but any hawkish shift in communication, the dot plot, or the policy statement could lead markets to price in tighter policy, pushing up short-term Treasury yields and strengthening the dollar. High-valuation growth stocks, AI-related assets, and small-cap stocks reliant on cheap funding are most vulnerable to rising rates. In Japan, a 25 basis point hike is almost fully priced in (98.3% probability), which would bring the policy rate to 1%, its highest since 1995. The concern is not the hike itself, but its potential to unwind the massive "carry trade," where investors borrowed low-yielding yen to invest globally. Historically, Japan's rate hikes have coincided with global market stress (2000, 2007, 2024). While this well-telegraphed hike may be digested smoothly, two key factors increase uncertainty: 1) Governor Ueda's absence due to illness, putting communication in the hands of less-familiar deputies, and 2) the Fed meeting occurring just days later, creating potential for a compounded market reaction if both central banks sound hawkish. Asset implications: * **Bonds:** US short-term yields sensitive to Fed signals. Japan's rate hike could pressure its massive US Treasury holdings. * **Currencies:** Dollar likely supported by Fed; Yen's reaction hinges on BoJ's forward guidance. * **Equities:** US growth stocks, small-caps most at risk. Japanese stocks face pressure from a stronger yen. * **Crypto:** Assets like Bitcoin face headwinds from higher rates and tighter liquidity; high-beta altcoins are even more vulnerable. The convergence of these two central bank meetings amplifies market volatility risks, with potential spillovers across asset classes globally.

marsbit9m ago

As the US and Japan Hike Interest Rates, Which Asset Class is Most at Risk?

marsbit9m ago

Data Decrypts the BTC Cycle: Three Major Bottom Signals Illuminate Simultaneously, Q4 Could Be a Crucial Turning Point Window?

"Decoding the Bitcoin Cycle: Three Bottom Signals Flash Simultaneously, Is Q4 the Key Turning Point?" The article analyzes Bitcoin's current market position, comparing it to historical cycles. BTC has corrected over 52% from its October 2025 peak of $126,198 to around $59,100 in June 2026. While significant, this drawdown is milder than the 77-86% declines seen in past bear markets. The analysis is framed within Bitcoin's four-year halving cycle. Past cycles show a pattern: prices peak 12-18 months post-halving, bottom 12-14 months after the peak, with lows typically occurring roughly 17 months before the next halving. Following the April 2024 halving and the October 2025 peak, this pattern suggests a potential bottoming window around Q4 2026, ahead of the expected 2028 halving. Three key on-chain metrics are signaling undervaluation: The MVRV Z-Score has dropped near 0.27, approaching historic bottom zones. The market price is only about 9% above the network's average realized price of ~$53,600, a rare low premium. Bitcoin's price recently touched its 200-week moving average (~$62,200), a level that aligned with bottoms in 2015, 2018, and 2020. While US spot Bitcoin ETFs saw record outflows in May/June 2026, indicating retail panic, whale addresses (holding 100+ BTC) reached a yearly high. Entities like MicroStrategy resumed buying, and long-term holders control a near-record 78% of the supply, suggesting accumulation. A major macro overhang was partially removed with a US-Iran ceasefire agreement in mid-June 2026, which eased oil prices and triggered a sharp BTC rally. However, persistent inflation means high-interest rates remain a constraint. The conclusion notes that genuine investment opportunities often arise when confidence is lowest, amidst narratives that "this time is different." While not guaranteeing an immediate bottom, the confluence of cycle timing, undervaluation signals, and shifting macro risks suggests late 2026 may be a critical period for reassessing risk/reward and patient accumulation for long-term believers.

marsbit9m ago

Data Decrypts the BTC Cycle: Three Major Bottom Signals Illuminate Simultaneously, Q4 Could Be a Crucial Turning Point Window?

marsbit9m ago

Trading

Spot
Futures

Hot Articles

What is $BITCOIN

DIGITAL GOLD ($BITCOIN): A Comprehensive Analysis Introduction to DIGITAL GOLD ($BITCOIN) DIGITAL GOLD ($BITCOIN) is a blockchain-based project operating on the Solana network, which aims to combine the characteristics of traditional precious metals with the innovation of decentralized technologies. While it shares a name with Bitcoin, often referred to as “digital gold” due to its perception as a store of value, DIGITAL GOLD is a separate token designed to create a unique ecosystem within the Web3 landscape. Its goal is to position itself as a viable alternative digital asset, although specifics regarding its applications and functionalities are still developing. What is DIGITAL GOLD ($BITCOIN)? DIGITAL GOLD ($BITCOIN) is a cryptocurrency token explicitly designed for use on the Solana blockchain. In contrast to Bitcoin, which provides a widely recognized value storage role, this token appears to focus on broader applications and characteristics. Notable aspects include: Blockchain Infrastructure: The token is built on the Solana blockchain, known for its capacity to handle high-speed and low-cost transactions. Supply Dynamics: DIGITAL GOLD has a maximum supply capped at 100 quadrillion tokens (100P $BITCOIN), although details regarding its circulating supply are currently undisclosed. Utility: While precise functionalities are not explicitly outlined, there are indications that the token could be utilized for various applications, potentially involving decentralized applications (dApps) or asset tokenization strategies. Who is the Creator of DIGITAL GOLD ($BITCOIN)? At present, the identity of the creators and development team behind DIGITAL GOLD ($BITCOIN) remains unknown. This situation is typical among many innovative projects within the blockchain space, particularly those aligning with decentralized finance and meme coin phenomena. While such anonymity may foster a community-driven culture, it intensifies concerns about governance and accountability. Who are the Investors of DIGITAL GOLD ($BITCOIN)? The available information indicates that DIGITAL GOLD ($BITCOIN) does not have any known institutional backers or prominent venture capital investments. The project seems to operate on a peer-to-peer model focused on community support and adoption rather than traditional funding routes. Its activity and liquidity are primarily situated on decentralized exchanges (DEXs), such as PumpSwap, rather than established centralized trading platforms, further highlighting its grassroots approach. How DIGITAL GOLD ($BITCOIN) Works The operational mechanics of DIGITAL GOLD ($BITCOIN) can be elaborated on based on its blockchain design and network attributes: Consensus Mechanism: By leveraging Solana’s unique proof-of-history (PoH) combined with a proof-of-stake (PoS) model, the project ensures efficient transaction validation contributing to the network's high performance. Tokenomics: While specific deflationary mechanisms have not been extensively detailed, the vast maximum token supply implies that it may cater to microtransactions or niche use cases that are still to be defined. Interoperability: There exists the potential for integration with Solana’s broader ecosystem, including various decentralized finance (DeFi) platforms. However, the details regarding specific integrations remain unspecified. Timeline of Key Events Here is a timeline that highlights significant milestones concerning DIGITAL GOLD ($BITCOIN): 2023: The initial deployment of the token occurs on the Solana blockchain, marked by its contract address. 2024: DIGITAL GOLD gains visibility as it becomes available for trading on decentralized exchanges like PumpSwap, allowing users to trade it against SOL. 2025: The project witnesses sporadic trading activity and potential interest in community-led engagements, although no noteworthy partnerships or technical advancements have been documented as of yet. Critical Analysis Strengths Scalability: The underlying Solana infrastructure supports high transaction volumes, which could enhance the utility of $BITCOIN in various transaction scenarios. Accessibility: The potential low trading price per token could attract retail investors, facilitating wider participation due to fractional ownership opportunities. Risks Lack of Transparency: The absence of publicly known backers, developers, or an audit process may yield skepticism regarding the project's sustainability and trustworthiness. Market Volatility: The trading activity is heavily reliant on speculative behavior, which can result in significant price volatility and uncertainty for investors. Conclusion DIGITAL GOLD ($BITCOIN) emerges as an intriguing yet ambiguous project within the rapidly evolving Solana ecosystem. While it attempts to leverage the “digital gold” narrative, its departure from Bitcoin's established role as a store of value underscores the need for a clearer differentiation of its intended utility and governance structure. Future acceptance and adoption will likely depend on addressing the current opacity and defining its operational and economic strategies more explicitly. Note: This report encompasses synthesised information available as of October 2023, and developments may have transpired beyond the research period.

368 Total ViewsPublished 2025.05.13Updated 2025.05.13

What is $BITCOIN

Discussions

Welcome to the HTX Community. Here, you can stay informed about the latest platform developments and gain access to professional market insights. Users' opinions on the price of BTC (BTC) are presented below.

活动图片