Bitcoin Just Reached A Critical Point In The Cycle, And Here’s What To Watch Out For

bitcoinistPublished on 2026-04-08Last updated on 2026-04-08

Abstract

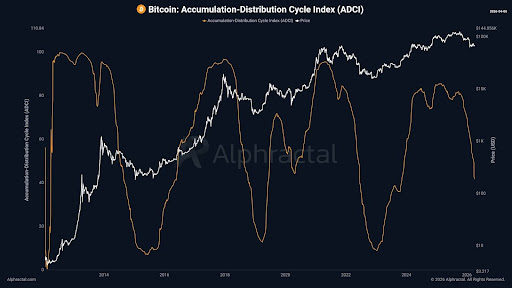
Bitcoin is approaching a critical phase in its market cycle, as indicated by the Accumulation Distribution Cycle Index (ADCI). This macro-level tool, developed by @arch_physicist and used by Alphractal, categorizes Bitcoin’s market behavior into three ranges: accumulation (0-30), trending (30-70), and distribution (70-100). The ADCI suggests Bitcoin may be entering the distribution zone, where the risk of larger holders offloading supply increases. Unlike past cycles that ended with sharp tops and corrections, distribution in the current mature market may occur more slowly—marked by sideways movement, weakening rallies, and exhaustion in momentum. Investors should monitor structural signals like the index's climb alongside slowing price action, rather than short-term spikes, to gauge whether the cycle transition is underway.

Bitcoin is approaching a sensitive stage in its broader market cycle, according to new analysis shared by Joao Wedson. The post pointed to a macro indicator designed to track the long-term structure of the market. Based on the latest reading of this model, the data suggests Bitcoin may be moving toward a zone where distribution risks may begin to increase, making the next phase of the cycle particularly important to monitor.

Bitcoin’s Macro Cycle Indicator Explains Where The Market Stands

In a recent X post, Wedson drew attention to the Accumulation Distribution Cycle Index (ADCI), a macro framework created by @arch_physicist and now used in research at Alphractal. The indicator was designed to analyze Bitcoin’s position within the broader structure described by the Wyckoff Method.

The ADCI organizes the market cycle into three distinct ranges, each representing a different stage of market behavior. When the index stays between 0 and 3, Bitcoin is typically in accumulation. These periods usually appear when sentiment is weak and participation is low, allowing larger investors to quietly absorb supply.

The 30 to 70 range signals a market that has already begun moving. In this zone, trends start to develop and expand. The direction of the index during this phase can reveal whether momentum is strengthening or beginning to deteriorate.

When the index moves between 70 and 100, the risk of distribution increases. This phase historically appears when market optimism grows, and demand expands, creating conditions where larger holders can begin offloading supply.
Source: X

The chart shared alongside the post illustrates this pattern across multiple Bitcoin cycles. Previous peaks in the indicator appear near major price highs, while deep drops in the index tend to align with long accumulation periods that later preceded large price expansions.

What Investors Should Watch As Bitcoin Approaches This Phase

Wedson noted that distribution in the current cycle may not appear the same way it did in earlier markets. In the past, Bitcoin cycles often ended with a sharp blow-off top followed by a rapid correction.

However, as the market matures, distribution may occur more gradually. Instead of a sudden spike and collapse, the market could move sideways for extended periods while repeated rallies begin losing strength.

This type of structure allows stronger holders to slowly release supply while public demand remains active. Because of this, the key signal to watch is not just price spikes but signs of repeated exhaustion, slowing momentum, and prolonged sideways movement.

This is why macro indicators like the ADCI are being emphasized. By focusing on structural positioning rather than short-term price action, the model aims to identify whether Bitcoin is being accumulated or distributed before the shift becomes obvious to the wider market. If the index continues rising toward its upper range while price action begins showing exhaustion, it could indicate the market is entering the distribution phase of the cycle.

BTC price crosses $71,000 | Source: BTCUSD on Tradingview.com

Trending Cryptos

Related Questions

QWhat is the Accumulation Distribution Cycle Index (ADCI) and what does it measure?

AThe Accumulation Distribution Cycle Index (ADCI) is a macro framework created by @arch_physicist and used in research at Alphractal. It is designed to analyze Bitcoin's position within the broader market structure as described by the Wyckoff Method, tracking the long-term structure of the market to identify whether Bitcoin is in an accumulation or distribution phase.

QAccording to the ADCI, what does a reading between 70 and 100 indicate for the Bitcoin market?

AWhen the ADCI index moves between 70 and 100, it indicates that the risk of distribution increases. This phase historically appears when market optimism is high and demand expands, creating conditions where larger holders can begin offloading their supply.

QHow might distribution in the current Bitcoin cycle differ from previous cycles?

AIn the current cycle, distribution may occur more gradually rather than as a sharp blow-off top followed by a rapid correction. The market could move sideways for extended periods while repeated rallies begin losing strength, allowing stronger holders to slowly release supply while public demand remains active.

QWhat are the key signals to watch for, besides price spikes, to identify a potential distribution phase?

AThe key signals to watch for are signs of repeated exhaustion, slowing momentum, and prolonged sideways movement. These indicators, combined with a rising ADCI index, can suggest the market is entering a distribution phase.

QWhat are the three distinct ranges of the ADCI and what do they represent?

AThe ADCI organizes the market cycle into three ranges: 0 to 3 indicates accumulation (weak sentiment, low participation), 30 to 70 signals a market that has begun moving with developing trends, and 70 to 100 indicates increased distribution risk (high optimism, potential supply offloading).

Related Reads

Wall Street's Most Famous 'Cassandra' Now Has His Sights Set on Nvidia

Michael Burry, the famed "Big Short" investor, has once again captured Wall Street's attention with a series of short positions against major tech and semiconductor stocks, most notably Nvidia. In late June and July, through his "Cassandra Unchained" newsletter, Burry disclosed short bets against Nvidia, Tesla, Applied Materials, Caterpillar, the SOXX semiconductor ETF, and later, Micron Technology. His core thesis revolves around potential distortions in the AI infrastructure boom, specifically questioning whether extended depreciation schedules (e.g., 6 years vs. a realistic 2-3 years for AI chips) by cloud giants like Microsoft and Google artificially inflate profits. He also raises concerns about possible "off-balance-sheet circular financing," where chip demand might be propped up by vendor-backed funding to clients. Nvidia's stock experienced volatility following these disclosures, briefly dipping but largely holding near Burry's reported entry points, leaving his positions roughly flat or slightly underwater as of late July. This move is part of a pattern for Burry, whose track record since his legendary 2008 bet is mixed. He has faced notable losses, such as on Tesla in 2021, while scoring on broader market turns like the 2020 pandemic crash. His methodology focuses intensely on free cash flow and scrutinizing original financial documents to spot overvaluation and structural risks, but it often struggles with timing the market. The article contrasts Burry's stance with other prominent investors. Steve Eisman, another "Big Short" figure, is not shorting Nvidia, citing strong fundamentals but expressing nervousness about sustainability. Jim Chanos agrees with the broad "accounting mismatch" concern—comparing it to the dot-com bubble—but targets financial leverage in private equity firms rather than the chip stocks themselves. While Nvidia's short interest remains relatively low at 1.3-1.4% of float, the massive stock size means absolute short losses have been significant, exceeding $5 billion earlier this year. The piece concludes that for ordinary investors, the key takeaway is not replicating specific short bets but learning from the critical frameworks these investors use: questioning rosy accounting, identifying structural vulnerabilities, and maintaining skepticism during market euphoria, even if pinpointing the exact catalyst for a downturn remains elusive.

marsbit6m ago

Wall Street's Most Famous 'Cassandra' Now Has His Sights Set on Nvidia

marsbit6m ago

Weekly Selection丨Epic Stock Market Volatility, Changxin Tech's IPO Reshapes Storage Landscape, Saylor Aims to Re-Anchor STRC Around September 8th

PANews Weekly Digest: Market Turmoil, Tech Breakthroughs, and Crypto Developments. The week saw significant volatility across global markets. South Korea's KOSPI index experienced extreme turbulence, including multiple trading halts, largely driven by sharp declines in AI hardware stocks like SK Hynix. In contrast, China's Changxin Xinqiao (CXC) achieved a landmark IPO with a market cap surpassing 4 trillion yuan, marking a major success for the domestic DRAM industry after a decade of losses. In the crypto and Web3 space, several key narratives emerged. AI is driving demand for new infrastructure, with projects like AI agent wallets and programmable payments gaining traction, attracting interest from firms like Coinbase. The Bitcoin mining sector is pivoting, with companies like MARA focusing on energy management as electricity becomes a core AI-era asset. Meanwhile, the RWA (Real World Assets) sector faces a "utilization puzzle," with hundreds of billions in on-chain assets remaining dormant. Notable market movements included a historic single-day surge of over 17% for the KOSPI index and a significant migration of $16.5 billion in staked ETH within the Lido ecosystem. Michael Saylor announced a target to re-peg the STRC stablecoin around September 8th. Other highlights include discussions on Ethereum's ambitious 2030 roadmap for scaling and privacy, analysis showing high protocol revenues not always translating to token price gains, and warnings from Citi about potential extreme commodity price shocks by late 2026.

marsbit12m ago

Weekly Selection丨Epic Stock Market Volatility, Changxin Tech's IPO Reshapes Storage Landscape, Saylor Aims to Re-Anchor STRC Around September 8th

marsbit12m ago

When the Market Begins to Question AI Capex: A Full Analysis of Q2 Earnings Reports from Five Tech Giants

In late July 2026, five major US tech giants—Alphabet, Intel, Microsoft, Meta, and Apple—released their Q2 earnings reports. While all companies exceeded revenue and profit expectations, driven by strong AI-related business growth, investor reactions diverged sharply due to concerns over escalating AI capital expenditures (capex) and their impact on free cash flow. Alphabet reported strong revenue growth and a surging cloud business, but its stock fell after announcing a doubled year-on-year capex and negative quarterly free cash flow for the first time. Intel posted its strongest revenue growth in over 15 years, but its stock experienced volatile trading after significantly raising its full-year capex guidance. Microsoft saw its stock surge after beating estimates and, crucially, lowering its capex forecast while projecting positive free cash flow. Meta faced the most severe sell-off as its profits declined despite revenue beats, with free cash flow plunging over 90% and its capex guidance raised. Apple reported record June-quarter results, but its stock plummeted after providing Q4 revenue guidance that fell short of expectations, citing supply chain constraints and forex headwinds. The overall takeaway is that the market's focus has shifted from validating AI demand to scrutinizing the timeline for returns on massive AI investments. Companies demonstrating a clearer path to managing capex and preserving free cash flow, like Microsoft, were rewarded, while those signaling continued aggressive spending faced investor skepticism.

Odaily星球日报21m ago

When the Market Begins to Question AI Capex: A Full Analysis of Q2 Earnings Reports from Five Tech Giants

Odaily星球日报21m ago

a16z: From Companies to DAOs, DUNA May Become the Next Generation Organizational Form

This article, "From Companies to DAOs: How DUNA Could Become the Next Organizational Form," traces the 500-year evolution of business collaboration. It begins with medieval structures like the *commenda* and Florentine *compagnia*, which exposed partners to personal risk. The modern corporation, exemplified by the Dutch East India Company (VOC), was a revolutionary leap, enabling large-scale, capital-intensive ventures by offering limited liability and reducing coordination costs. However, corporations introduced new challenges like principal-agent problems and bureaucratic overhead. The piece argues that software and internet-native protocols are now reducing these traditional overheads. Decentralized Autonomous Organizations (DAOs) emerged as a new model for coordination without centralized management. Yet, DAOs face a significant legal vacuum: they lack legal recognition, leaving members exposed to unlimited personal liability, and their tokens are vulnerable to being classified as securities under unclear regulations (e.g., the Howey Test). This has forced projects into suboptimal workarounds like offshore foundations. The article identifies the Decentralized Unincorporated Nonprofit Association (DUNA) as a potential solution. Recently legalized in states like Wyoming, the DUNA provides a legal wrapper for decentralized networks. It grants key protections—legal personality, limited liability, and perpetual existence—to a group without imposing a traditional hierarchical management structure. This allows token-holder communities to govern, hold assets, and contract as a single legal entity, aligning with their decentralized nature. While DUNA doesn't solve all governance challenges or magically resolve securities law questions, it represents a crucial step. It fills the legal recognition gap, offering a native legal form for internet-scale, decentralized collaboration and extending the separation of personal risk from organizational venture into a new domain.

marsbit1h ago

a16z: From Companies to DAOs, DUNA May Become the Next Generation Organizational Form

marsbit1h ago

2026 Mid-Year Report On-Chain RWA: Tokenized Stock Market Cap Doubles in a Year, But 90% of Rights Are Hollow Shells

The 2026 Mid-Year Report on On-Chain RWA highlights a significant growth in tokenized stock market capitalization, which nearly doubled from $951 million in March to $1.89 billion by July. However, the report reveals a fundamental contradiction in this "layer 2.5" ecosystem: products with the strongest legal foundation (like regulated U.S. infrastructure) lack liquidity and distribution, while freely tradable offshored wrapper products often lack substantive ownership rights. The increase is driven largely by a few products (SECZ, FGRS, STRCx) and platforms (Ondo, xStocks, Securitize collectively hold over 85% share). While distributed value across networks like Ethereum, Solana, and BNB Chain has grown, the market remains fragmented. Products referencing the same underlying asset (e.g., Apple stock) are distinct legal liabilities with different intermediaries and jurisdictional rules, offering varying degrees of legal claim. The report cautions that headline numbers are misleading, as they reflect changes in distributed token value—driven by issuance, conversions, and price movements—not pure investor inflows. True "canonical shares" with legal ownership, wide wallet distribution, institutional liquidity, and independent on-chain price discovery do not yet exist at scale. Tokenized treasuries show stronger product-market fit, and ETFs may be easier to scale than single stocks. The core takeaway is a trade-off: legal certainty versus liquidity and composability.

marsbit1h ago

2026 Mid-Year Report On-Chain RWA: Tokenized Stock Market Cap Doubles in a Year, But 90% of Rights Are Hollow Shells

marsbit1h ago

Trading

Spot

Hot Articles

What is $BITCOIN

DIGITAL GOLD ($BITCOIN): A Comprehensive Analysis Introduction to DIGITAL GOLD ($BITCOIN) DIGITAL GOLD ($BITCOIN) is a blockchain-based project operating on the Solana network, which aims to combine the characteristics of traditional precious metals with the innovation of decentralized technologies. While it shares a name with Bitcoin, often referred to as “digital gold” due to its perception as a store of value, DIGITAL GOLD is a separate token designed to create a unique ecosystem within the Web3 landscape. Its goal is to position itself as a viable alternative digital asset, although specifics regarding its applications and functionalities are still developing. What is DIGITAL GOLD ($BITCOIN)? DIGITAL GOLD ($BITCOIN) is a cryptocurrency token explicitly designed for use on the Solana blockchain. In contrast to Bitcoin, which provides a widely recognized value storage role, this token appears to focus on broader applications and characteristics. Notable aspects include: Blockchain Infrastructure: The token is built on the Solana blockchain, known for its capacity to handle high-speed and low-cost transactions. Supply Dynamics: DIGITAL GOLD has a maximum supply capped at 100 quadrillion tokens (100P $BITCOIN), although details regarding its circulating supply are currently undisclosed. Utility: While precise functionalities are not explicitly outlined, there are indications that the token could be utilized for various applications, potentially involving decentralized applications (dApps) or asset tokenization strategies. Who is the Creator of DIGITAL GOLD ($BITCOIN)? At present, the identity of the creators and development team behind DIGITAL GOLD ($BITCOIN) remains unknown. This situation is typical among many innovative projects within the blockchain space, particularly those aligning with decentralized finance and meme coin phenomena. While such anonymity may foster a community-driven culture, it intensifies concerns about governance and accountability. Who are the Investors of DIGITAL GOLD ($BITCOIN)? The available information indicates that DIGITAL GOLD ($BITCOIN) does not have any known institutional backers or prominent venture capital investments. The project seems to operate on a peer-to-peer model focused on community support and adoption rather than traditional funding routes. Its activity and liquidity are primarily situated on decentralized exchanges (DEXs), such as PumpSwap, rather than established centralized trading platforms, further highlighting its grassroots approach. How DIGITAL GOLD ($BITCOIN) Works The operational mechanics of DIGITAL GOLD ($BITCOIN) can be elaborated on based on its blockchain design and network attributes: Consensus Mechanism: By leveraging Solana’s unique proof-of-history (PoH) combined with a proof-of-stake (PoS) model, the project ensures efficient transaction validation contributing to the network's high performance. Tokenomics: While specific deflationary mechanisms have not been extensively detailed, the vast maximum token supply implies that it may cater to microtransactions or niche use cases that are still to be defined. Interoperability: There exists the potential for integration with Solana’s broader ecosystem, including various decentralized finance (DeFi) platforms. However, the details regarding specific integrations remain unspecified. Timeline of Key Events Here is a timeline that highlights significant milestones concerning DIGITAL GOLD ($BITCOIN): 2023: The initial deployment of the token occurs on the Solana blockchain, marked by its contract address. 2024: DIGITAL GOLD gains visibility as it becomes available for trading on decentralized exchanges like PumpSwap, allowing users to trade it against SOL. 2025: The project witnesses sporadic trading activity and potential interest in community-led engagements, although no noteworthy partnerships or technical advancements have been documented as of yet. Critical Analysis Strengths Scalability: The underlying Solana infrastructure supports high transaction volumes, which could enhance the utility of $BITCOIN in various transaction scenarios. Accessibility: The potential low trading price per token could attract retail investors, facilitating wider participation due to fractional ownership opportunities. Risks Lack of Transparency: The absence of publicly known backers, developers, or an audit process may yield skepticism regarding the project's sustainability and trustworthiness. Market Volatility: The trading activity is heavily reliant on speculative behavior, which can result in significant price volatility and uncertainty for investors. Conclusion DIGITAL GOLD ($BITCOIN) emerges as an intriguing yet ambiguous project within the rapidly evolving Solana ecosystem. While it attempts to leverage the “digital gold” narrative, its departure from Bitcoin's established role as a store of value underscores the need for a clearer differentiation of its intended utility and governance structure. Future acceptance and adoption will likely depend on addressing the current opacity and defining its operational and economic strategies more explicitly. Note: This report encompasses synthesised information available as of October 2023, and developments may have transpired beyond the research period.

1.3k Total ViewsPublished 2025.05.13Updated 2025.05.13

What is $BITCOIN

Discussions

Welcome to the HTX Community. Here, you can stay informed about the latest platform developments and gain access to professional market insights. Users' opinions on the price of BTC (BTC) are presented below.

活动图片