Bitcoin Halving Clock Points To Bottoming Phase, But Cycle Signal Needs Caution

bitcoinistPublished on 2026-06-14Last updated on 2026-06-14

Abstract

Crypto analyst Crypto Rover claims Bitcoin is currently in a post-halving "bottoming phase," based on a historical cycle chart suggesting repeatable market rhythms. However, the analysis is flagged as speculative trader commentary, not a confirmed signal. The article cautions that halving-cycle models are less reliable in today's more mature, institutional market influenced by ETFs, derivatives, and macro factors. While such narratives can shape trader sentiment, actual confirmation of a bottom requires support from price action, liquidity, on-chain data, and broader risk appetite. The key takeaway is to view the cycle argument as an interesting framework, not a trade signal, until Bitcoin demonstrates it can hold key support levels and build a stronger price structure.

Trusted Editorial content, reviewed by leading industry experts and seasoned editors. Ad Disclosure

TL;DR

  • Crypto Rover argues Bitcoin is in a halving-cycle bottoming phase.
  • The post is speculative and should be treated as trader commentary, not a confirmed signal.
  • The key issue is whether price action, liquidity and broader market structure support the cycle claim.
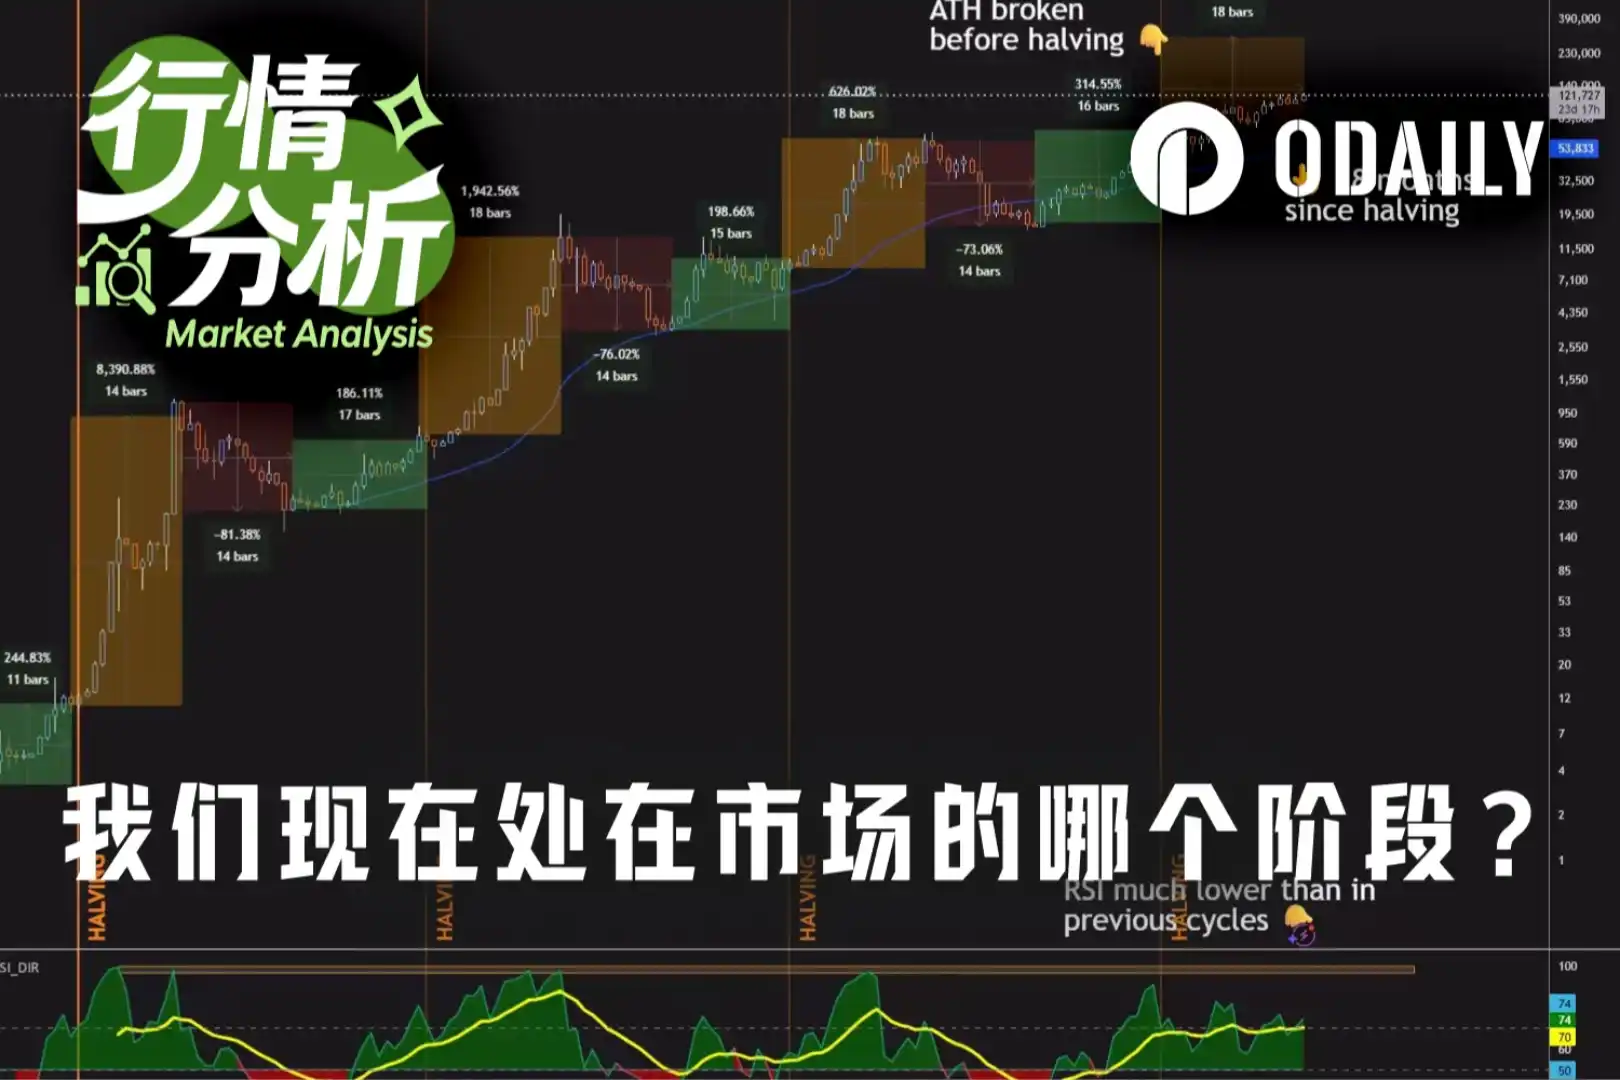
Halving Cycle Chart Points To A Bottoming Phase

Crypto Rover has shared a Bitcoin halving-cycle chart arguing that BTC is moving through a familiar “bottoming phase,” with the post claiming the market is following the same rhythm and structure seen in previous cycles.

The claim is simple: Bitcoin’s post-halving cycle has historically moved through repeatable phases, and the current chart is being interpreted as a similar stage before a stronger bullish phase. That makes the post part of a wider set of cycle-based arguments that remain popular whenever Bitcoin consolidates after a major macro move.

The setup is worth covering because halving-cycle models still influence trader psychology. When enough market participants anchor to the same historical cycle map, the model can shape sentiment even if it does not prove what price will do next.

Why The Claim Needs A Cautious Frame

This should not be treated as a confirmed signal. Crypto Rover is flagged internally as a high-risk influencer source because his posts can lean heavily bullish and promotional. The chart does not provide a statistical model, on-chain confirmation or a clear invalidation level.

Halving-cycle analysis also becomes less reliable as Bitcoin matures. Earlier cycles happened in a smaller, less liquid market with fewer institutional products. Today’s market includes spot ETFs, larger derivatives flows, macro-sensitive capital and more sophisticated arbitrage activity.

The stronger read is that the post reflects renewed interest in cycle timing, not proof that Bitcoin has already bottomed. Confirmation would need to come from price structure, liquidity, on-chain behavior and broader risk appetite.

What Traders Are Watching Now

The market signal is whether Bitcoin can hold key support areas while building higher lows. If BTC continues to consolidate without breaking down, cycle-based traders will likely keep arguing that the market is forming a base.

The risk is that cycle charts can overfit the past. A chart that matched previous halving windows may fail if macro conditions, ETF flows or liquidity conditions shift sharply.

This leaves traders watching whether the cycle narrative is supported by actual market behavior. A stronger recovery would give the halving-clock argument more traction, while a breakdown would turn it into another failed overlay.

This report is based on the attributed X post and should be read as market commentary, not a confirmed price prediction. View the source post.

The direct market takeaway is therefore conditional. The cycle chart gives bulls a timing narrative, but BTC still needs to prove that buyers are defending the current range. Until that happens, the halving-clock argument remains an interesting framework rather than a trade signal.

Editorial Process for bitcoinist is centered on delivering thoroughly researched, accurate, and unbiased content. We uphold strict sourcing standards, and each page undergoes diligent review by our team of top technology experts and seasoned editors. This process ensures the integrity, relevance, and value of our content for our readers.

Bitcoinist Editorial Team

Follow

Full Profile

Related Posts

Ripple Launches XRPL AI Starter Kit For XRP And RLUSD Agent Payments

Zcash Founder Says Anthropic AI Audit Found No Serious Protocol Bugs

Bitcoin To $400,000? Analyst Uses Gold Overlay To Make Bold 2026 Case

Bitcoin Trader Says Cycle Tops And Bottoms Match Exact Day Counts

Coinbase And Ethena Launch High Yield USDC Vault Powered By Morpho

Exploit Wallet Converts Stolen Tokens Into 18,510 ETH And 1,548 BNB

Related Questions

QWhat is the main argument made by Crypto Rover regarding Bitcoin's current market phase?

ACrypto Rover argues that Bitcoin is currently in the 'bottoming phase' of its halving cycle, suggesting it is following the same rhythm and structure observed in previous cycles before a bullish move.

QWhy does the article suggest the halving-cycle claim should be treated with caution?

AThe article advises caution because Crypto Rover is a high-risk influencer source whose posts are often promotional. The chart lacks a statistical model, on-chain confirmation, or clear invalidation levels, and halving-cycle analysis becomes less reliable as Bitcoin's market matures with new factors like ETFs.

QWhat key market factors would be needed to confirm the 'bottoming phase' argument?

ATo confirm the argument, the market would need to see Bitcoin hold key support areas while building higher lows. Confirmation requires support from price structure, liquidity, on-chain behavior, and broader risk appetite, not just historical cycle overlays.

QAccording to the article, what is the primary risk of relying on halving-cycle charts for trading decisions?

AThe primary risk is that cycle charts can 'overfit the past.' A chart matching previous halving windows may fail if current macro conditions, ETF flows, or liquidity dynamics shift sharply, making the historical pattern unreliable.

QHow does the article frame Crypto Rover's post for traders and readers?

AThe article frames the post as speculative market commentary and trader psychology, not a confirmed price signal. It should be viewed as an interesting framework reflecting renewed interest in cycle timing, but not as a definitive trade signal.

Related Reads

pump.fun's New Feature Brings 'Black Mirror' Into Reality

The article begins by recounting a dark fictional story from *Black Mirror* (Season 7, Episode 1 "Common People"), where a man is forced to perform humiliating tasks online to pay for his wife's life-sustaining medical subscription. It then draws a parallel to a new real-world feature on the crypto platform pump.fun called "Pump.fun Go," which allows users to post and complete paid bounty tasks. This feature gained mainstream attention, often negatively, through extreme examples. A prominent case involved a bounty of 40 SOL (~$2,600) offered to permanently tattoo "$bountywork" on one's forehead. An Indian man completed the task, stating the money "changed his life," and later earned significantly more from a related meme coin. Another bounty paid 200 SOL (~$14,000) for a "bounty.fun" forehead tattoo, with the participant simply stating, "We need the money." The article highlights how this system can amplify darkness, citing the dev behind $Bountywork who spent thousands on bounties for attention-grabbing stunts like eating bugs or drinking hot sauce for small sums. It compares this to past tragic live-streaming incidents where people harmed themselves for money, noting regulation cannot stop those in desperate need. However, it also points to positive, altruistic bounties that have emerged, such as organizing anti-work rallies in New York, performing random acts of kindness for strangers, organizing community food drives, or even helping an elderly person cross the street. The piece concludes by acknowledging the platform reflects both the dark and light sides of human nature when actions are given a price, hoping for more of the latter.

marsbit4m ago

pump.fun's New Feature Brings 'Black Mirror' Into Reality

marsbit4m ago

As the US and Japan Hike Interest Rates, Which Asset Class is Most at Risk?

This week, global markets face two major events: the Bank of Japan's likely interest rate hike and the US Federal Reserve's FOMC meeting. For risk assets, it is a pivotal and volatile week. In the US, expectations for rate cuts have faded dramatically. May's higher-than-expected CPI and resilient jobs data have shifted the Fed's focus from potential cuts to the possibility of future hikes. New Fed Chair Wash is unlikely to raise rates at this meeting, but any hawkish shift in communication, the dot plot, or the policy statement could lead markets to price in tighter policy, pushing up short-term Treasury yields and strengthening the dollar. High-valuation growth stocks, AI-related assets, and small-cap stocks reliant on cheap funding are most vulnerable to rising rates. In Japan, a 25 basis point hike is almost fully priced in (98.3% probability), which would bring the policy rate to 1%, its highest since 1995. The concern is not the hike itself, but its potential to unwind the massive "carry trade," where investors borrowed low-yielding yen to invest globally. Historically, Japan's rate hikes have coincided with global market stress (2000, 2007, 2024). While this well-telegraphed hike may be digested smoothly, two key factors increase uncertainty: 1) Governor Ueda's absence due to illness, putting communication in the hands of less-familiar deputies, and 2) the Fed meeting occurring just days later, creating potential for a compounded market reaction if both central banks sound hawkish. Asset implications: * **Bonds:** US short-term yields sensitive to Fed signals. Japan's rate hike could pressure its massive US Treasury holdings. * **Currencies:** Dollar likely supported by Fed; Yen's reaction hinges on BoJ's forward guidance. * **Equities:** US growth stocks, small-caps most at risk. Japanese stocks face pressure from a stronger yen. * **Crypto:** Assets like Bitcoin face headwinds from higher rates and tighter liquidity; high-beta altcoins are even more vulnerable. The convergence of these two central bank meetings amplifies market volatility risks, with potential spillovers across asset classes globally.

marsbit9m ago

As the US and Japan Hike Interest Rates, Which Asset Class is Most at Risk?

marsbit9m ago

Data Decrypts the BTC Cycle: Three Major Bottom Signals Illuminate Simultaneously, Q4 Could Be a Crucial Turning Point Window?

"Decoding the Bitcoin Cycle: Three Bottom Signals Flash Simultaneously, Is Q4 the Key Turning Point?" The article analyzes Bitcoin's current market position, comparing it to historical cycles. BTC has corrected over 52% from its October 2025 peak of $126,198 to around $59,100 in June 2026. While significant, this drawdown is milder than the 77-86% declines seen in past bear markets. The analysis is framed within Bitcoin's four-year halving cycle. Past cycles show a pattern: prices peak 12-18 months post-halving, bottom 12-14 months after the peak, with lows typically occurring roughly 17 months before the next halving. Following the April 2024 halving and the October 2025 peak, this pattern suggests a potential bottoming window around Q4 2026, ahead of the expected 2028 halving. Three key on-chain metrics are signaling undervaluation: The MVRV Z-Score has dropped near 0.27, approaching historic bottom zones. The market price is only about 9% above the network's average realized price of ~$53,600, a rare low premium. Bitcoin's price recently touched its 200-week moving average (~$62,200), a level that aligned with bottoms in 2015, 2018, and 2020. While US spot Bitcoin ETFs saw record outflows in May/June 2026, indicating retail panic, whale addresses (holding 100+ BTC) reached a yearly high. Entities like MicroStrategy resumed buying, and long-term holders control a near-record 78% of the supply, suggesting accumulation. A major macro overhang was partially removed with a US-Iran ceasefire agreement in mid-June 2026, which eased oil prices and triggered a sharp BTC rally. However, persistent inflation means high-interest rates remain a constraint. The conclusion notes that genuine investment opportunities often arise when confidence is lowest, amidst narratives that "this time is different." While not guaranteeing an immediate bottom, the confluence of cycle timing, undervaluation signals, and shifting macro risks suggests late 2026 may be a critical period for reassessing risk/reward and patient accumulation for long-term believers.

marsbit9m ago

Data Decrypts the BTC Cycle: Three Major Bottom Signals Illuminate Simultaneously, Q4 Could Be a Crucial Turning Point Window?

marsbit9m ago

Trading

Spot
Futures

Hot Articles

What is $BITCOIN

DIGITAL GOLD ($BITCOIN): A Comprehensive Analysis Introduction to DIGITAL GOLD ($BITCOIN) DIGITAL GOLD ($BITCOIN) is a blockchain-based project operating on the Solana network, which aims to combine the characteristics of traditional precious metals with the innovation of decentralized technologies. While it shares a name with Bitcoin, often referred to as “digital gold” due to its perception as a store of value, DIGITAL GOLD is a separate token designed to create a unique ecosystem within the Web3 landscape. Its goal is to position itself as a viable alternative digital asset, although specifics regarding its applications and functionalities are still developing. What is DIGITAL GOLD ($BITCOIN)? DIGITAL GOLD ($BITCOIN) is a cryptocurrency token explicitly designed for use on the Solana blockchain. In contrast to Bitcoin, which provides a widely recognized value storage role, this token appears to focus on broader applications and characteristics. Notable aspects include: Blockchain Infrastructure: The token is built on the Solana blockchain, known for its capacity to handle high-speed and low-cost transactions. Supply Dynamics: DIGITAL GOLD has a maximum supply capped at 100 quadrillion tokens (100P $BITCOIN), although details regarding its circulating supply are currently undisclosed. Utility: While precise functionalities are not explicitly outlined, there are indications that the token could be utilized for various applications, potentially involving decentralized applications (dApps) or asset tokenization strategies. Who is the Creator of DIGITAL GOLD ($BITCOIN)? At present, the identity of the creators and development team behind DIGITAL GOLD ($BITCOIN) remains unknown. This situation is typical among many innovative projects within the blockchain space, particularly those aligning with decentralized finance and meme coin phenomena. While such anonymity may foster a community-driven culture, it intensifies concerns about governance and accountability. Who are the Investors of DIGITAL GOLD ($BITCOIN)? The available information indicates that DIGITAL GOLD ($BITCOIN) does not have any known institutional backers or prominent venture capital investments. The project seems to operate on a peer-to-peer model focused on community support and adoption rather than traditional funding routes. Its activity and liquidity are primarily situated on decentralized exchanges (DEXs), such as PumpSwap, rather than established centralized trading platforms, further highlighting its grassroots approach. How DIGITAL GOLD ($BITCOIN) Works The operational mechanics of DIGITAL GOLD ($BITCOIN) can be elaborated on based on its blockchain design and network attributes: Consensus Mechanism: By leveraging Solana’s unique proof-of-history (PoH) combined with a proof-of-stake (PoS) model, the project ensures efficient transaction validation contributing to the network's high performance. Tokenomics: While specific deflationary mechanisms have not been extensively detailed, the vast maximum token supply implies that it may cater to microtransactions or niche use cases that are still to be defined. Interoperability: There exists the potential for integration with Solana’s broader ecosystem, including various decentralized finance (DeFi) platforms. However, the details regarding specific integrations remain unspecified. Timeline of Key Events Here is a timeline that highlights significant milestones concerning DIGITAL GOLD ($BITCOIN): 2023: The initial deployment of the token occurs on the Solana blockchain, marked by its contract address. 2024: DIGITAL GOLD gains visibility as it becomes available for trading on decentralized exchanges like PumpSwap, allowing users to trade it against SOL. 2025: The project witnesses sporadic trading activity and potential interest in community-led engagements, although no noteworthy partnerships or technical advancements have been documented as of yet. Critical Analysis Strengths Scalability: The underlying Solana infrastructure supports high transaction volumes, which could enhance the utility of $BITCOIN in various transaction scenarios. Accessibility: The potential low trading price per token could attract retail investors, facilitating wider participation due to fractional ownership opportunities. Risks Lack of Transparency: The absence of publicly known backers, developers, or an audit process may yield skepticism regarding the project's sustainability and trustworthiness. Market Volatility: The trading activity is heavily reliant on speculative behavior, which can result in significant price volatility and uncertainty for investors. Conclusion DIGITAL GOLD ($BITCOIN) emerges as an intriguing yet ambiguous project within the rapidly evolving Solana ecosystem. While it attempts to leverage the “digital gold” narrative, its departure from Bitcoin's established role as a store of value underscores the need for a clearer differentiation of its intended utility and governance structure. Future acceptance and adoption will likely depend on addressing the current opacity and defining its operational and economic strategies more explicitly. Note: This report encompasses synthesised information available as of October 2023, and developments may have transpired beyond the research period.

368 Total ViewsPublished 2025.05.13Updated 2025.05.13

What is $BITCOIN

Discussions

Welcome to the HTX Community. Here, you can stay informed about the latest platform developments and gain access to professional market insights. Users' opinions on the price of BTC (BTC) are presented below.

活动图片