Authored by: Glassnode
Compiled by: AididiaoJP, Foresight News
Summary
- Bitcoin price remains stuck near key on-chain cost bases, with support levels being tested. Sufficient market confidence is needed to prevent further structural weakness.
- Short-term holder sentiment is fragile. If the price cannot recover above key breakeven levels, recently invested holders may face renewed selling pressure.
- Overall, holder behavior remains conservative. This suggests the current market is in a phase of absorption, not expansion.
- Liquidity remains a key variable. Despite declining participation, the price has held stable. However, sustained breakout momentum still requires follow-up buying.
- Spot ETF flows are stabilizing. After a period of sustained outflows, the 30-day average flow has returned near neutral levels, easing mechanical selling pressure.
- Spot CVD (Cumulative Volume Delta) bias across exchanges is improving, led by Binance, indicating marginal buying pressure is returning. Coinbase remains relatively flat.
- Leverage in perpetual futures markets remains low, with funding rates mostly neutral. Speculative positioning is still cautious and easily shaken out by volatility.
- Options markets are shifting towards seeking downside protection: put skew is rising, short-term implied volatility is increasing, and dealer Gamma has turned negative, increasing sensitivity to price declines.
On-Chain Insights
Weakening Again
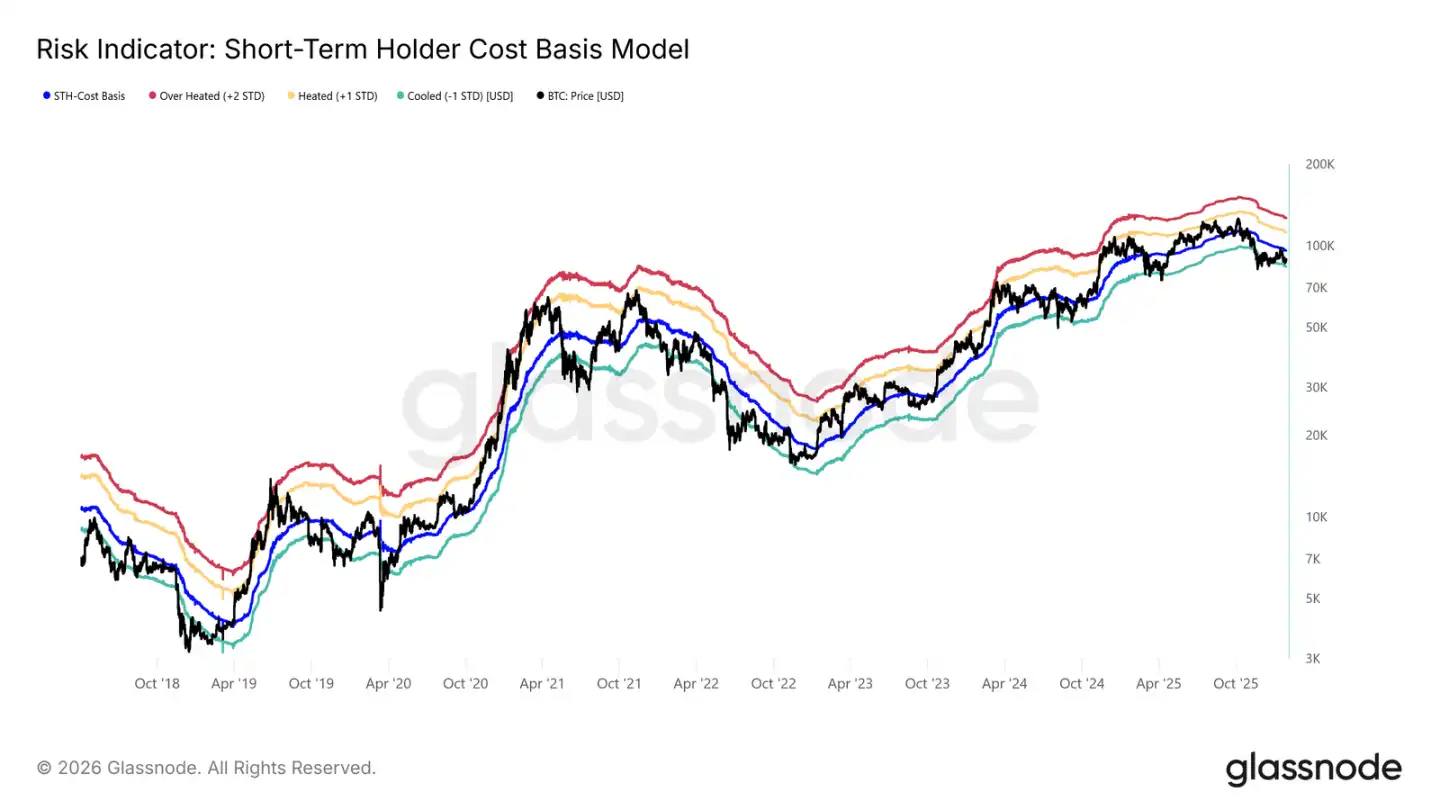
The market has entered a slight correction after the spot price failed to hold above the Short-Term Holder cost basis.
The current price is below the critical bull-bear divider of $96.5k, with market structure showing similarities to Q1 2022 and Q2 2018.
As the chart shows, the lower bound of the current consolidation range (-1 standard deviation) sits at $83.4k. This is a key near-term support level; a break below could trigger a deeper correction towards the True Market Mean price of $80.7k.
Support Sensitivity
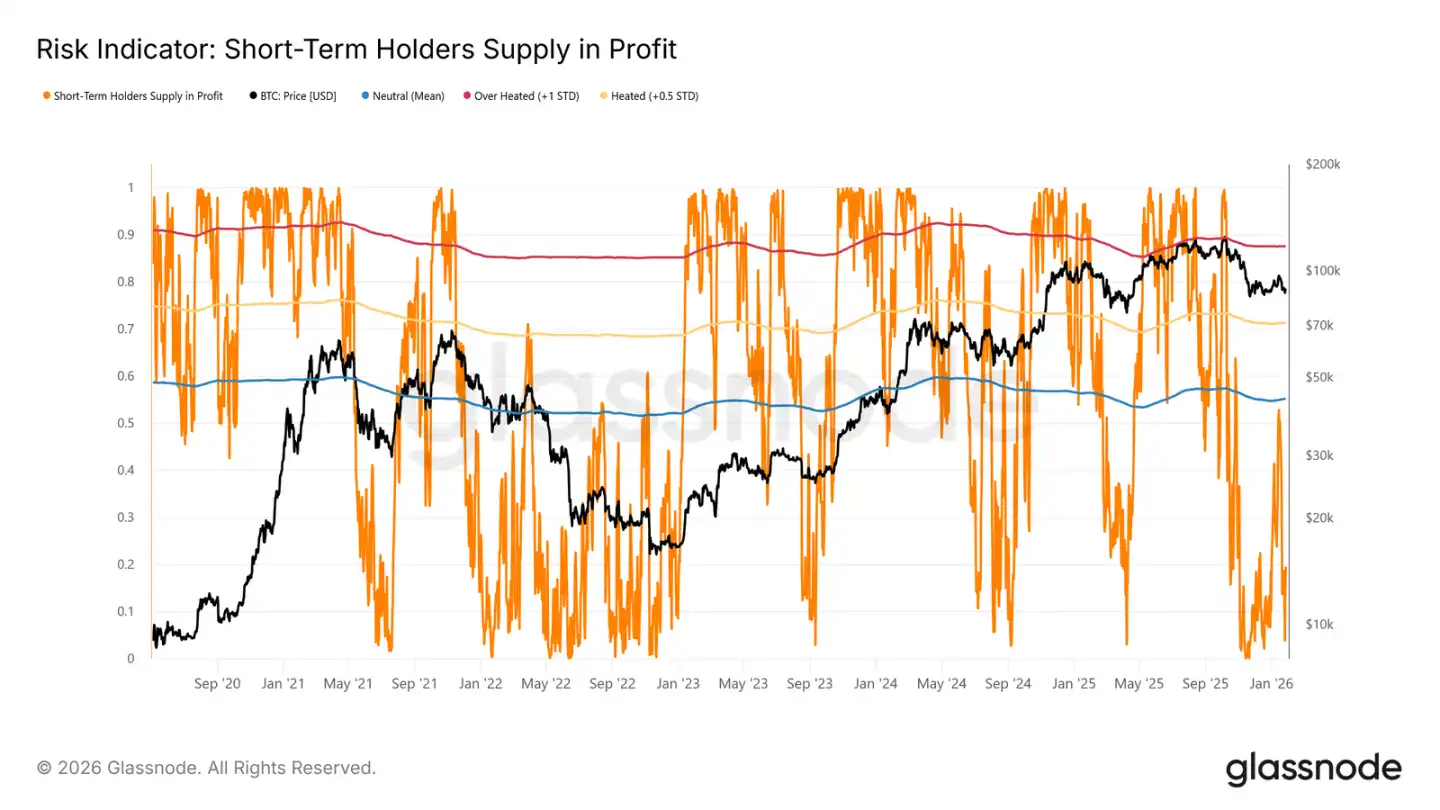
The market is so sensitive to the lower bound of the STH cost basis and the True Market Mean because a high proportion of recently acquired coins are in loss. In this state, historically price-sensitive Short-Term Holders are more likely to sell at a loss, increasing selling pressure.
Therefore, these price levels are the last line of defense against the market sliding into a deep bear market akin to 2022-2023.
Currently, the percentage of the STH supply in loss has fallen to 19.5%, well below the 55% neutral threshold. This indicates that while downside risk persists, a large-scale panic sell-off from STHs has not yet materialized.
Liquidity is Key
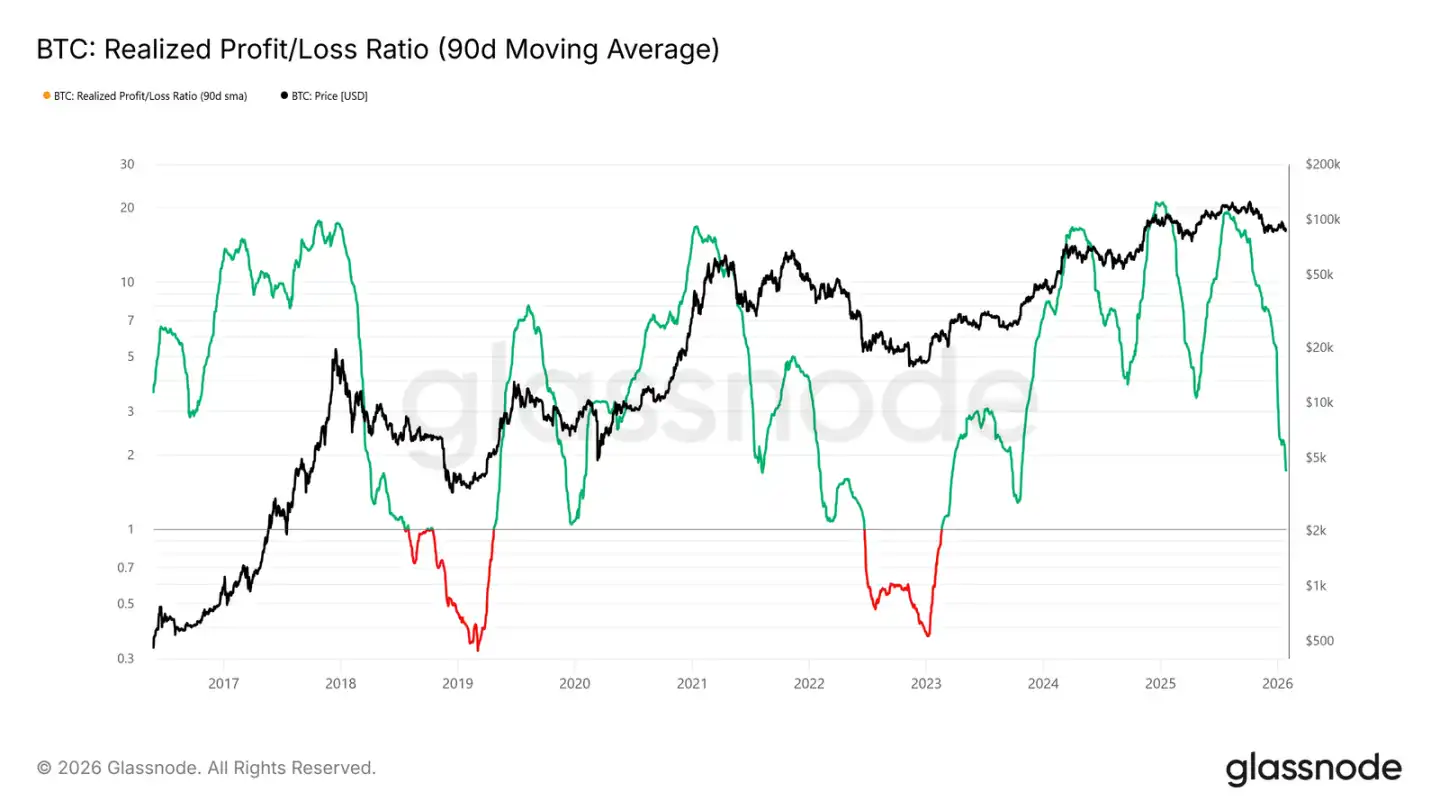
Given the importance of holding the key support zone between $80.7k and $83.4k, liquidity conditions are now in focus. Any material shift towards a sustainable rally should be reflected in liquidity-sensitive metrics, such as the Realized Profit/Loss Ratio (90D MA).
Historically, including cycle rallies over the past two years, strong uptrend phases required this ratio to rise and sustain around 5. This marks the re-entry of new capital into the market.
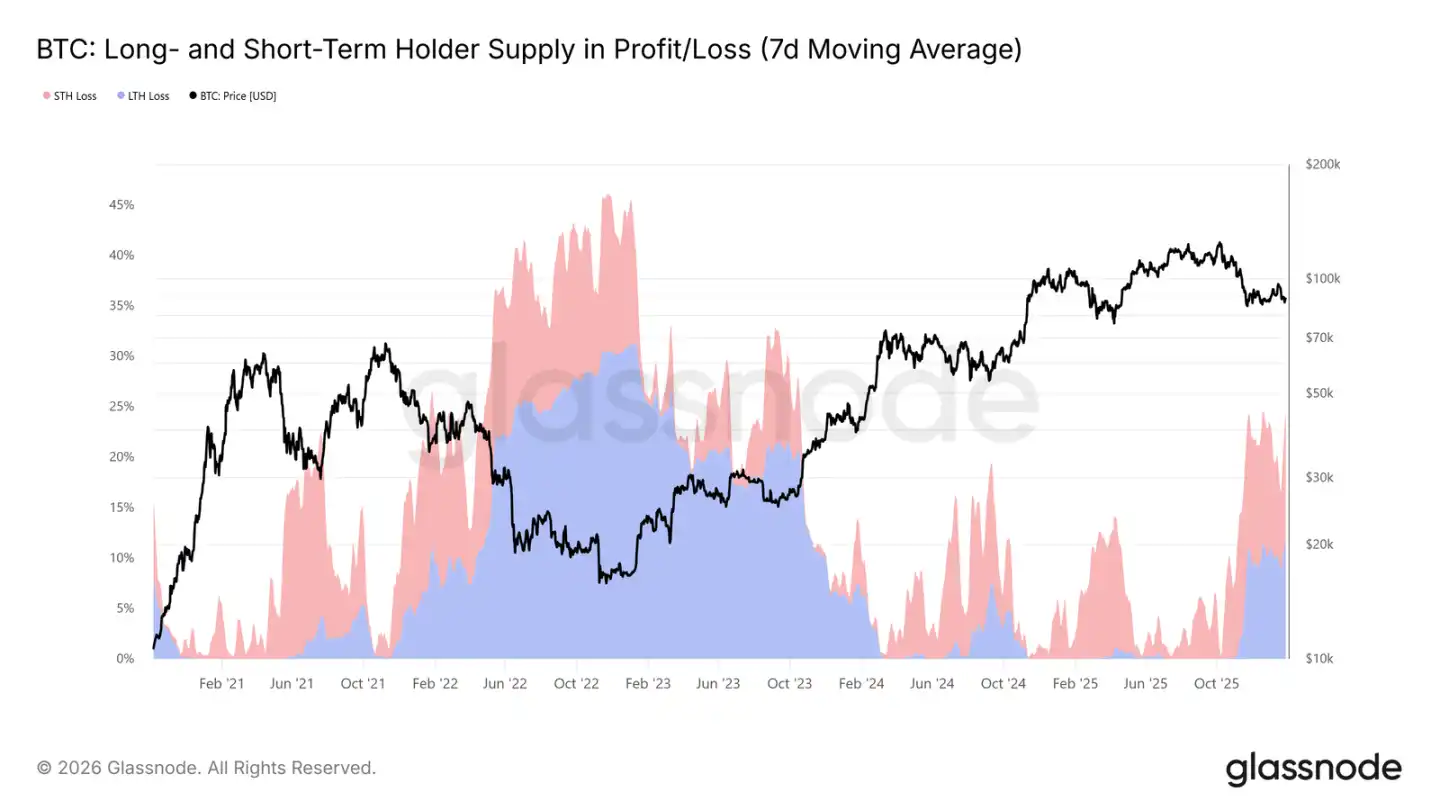
Supply Under Pressure
Another core on-chain metric influencing medium-term market structure is the Profit/ Loss Supply for Long/Short-Term Holders. This data shows that over 22% of the circulating supply is currently at a loss, similar to Q1 2022 and Q2 2018.
As coins bought near the top gradually 'age' into Long-Term Holder status, and investors choose to hold coins acquired during the previous rally, the proportion of LTH supply in loss increases over time.
These steadfast holders are now under pressure from both time and price. If the price breaks below the aforementioned key support levels (lower STH cost basis and True Market Mean), it could trigger stop-losses even from LTHs, increasing medium-term downside risk.
Off-Chain Insights
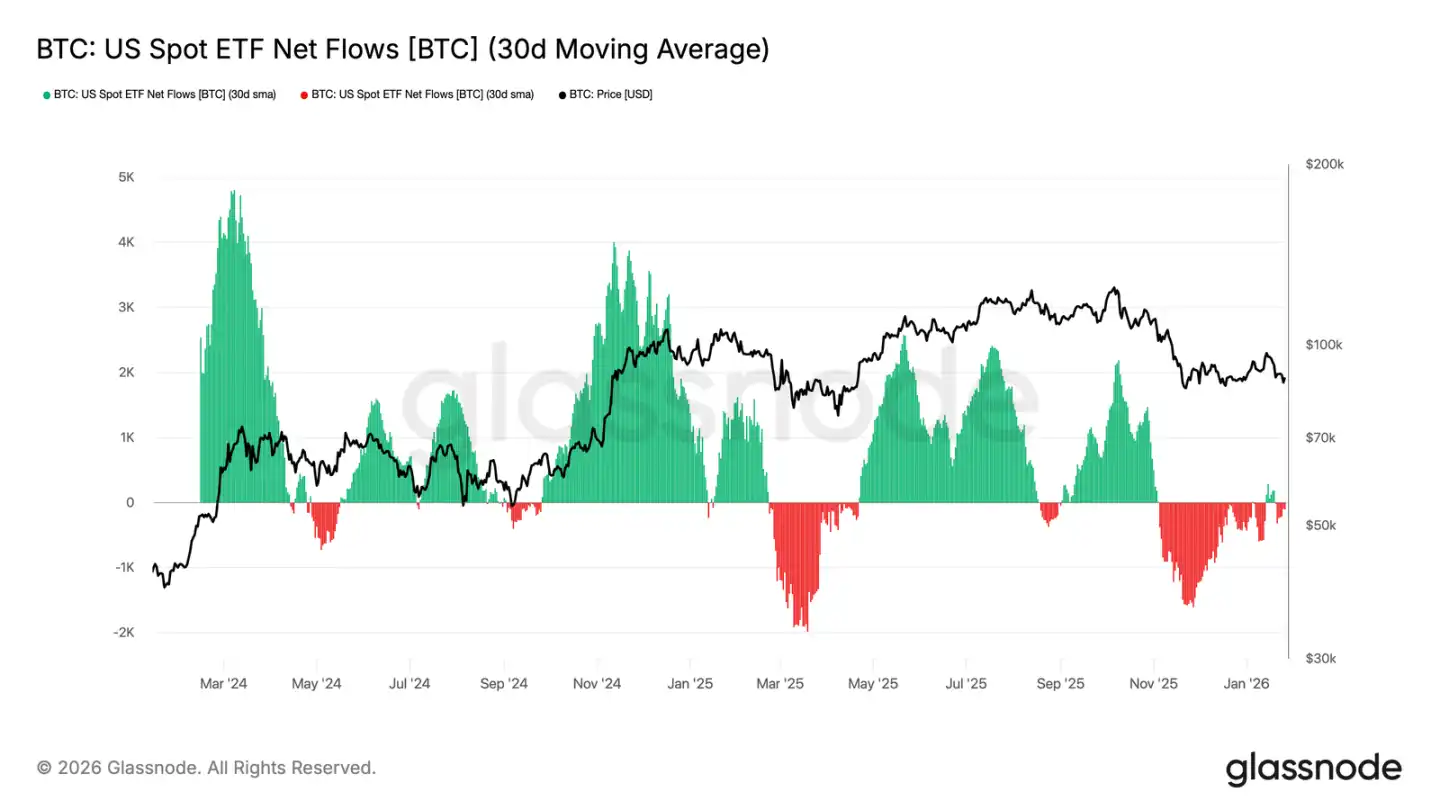
Spot ETF Outflows Slow
Net flows for US spot Bitcoin ETFs have returned to balance. After a prolonged period of net outflows, their 30-day moving average has approached the neutral line. This indicates a significant easing of structural selling pressure from ETFs.
Notably, the recent rebound in inflows lacks the intensity seen during the accumulation waves in early and late 2024. This suggests institutional demand remains cautious rather than aggressively chasing rallies. With weakened inflow momentum, BTC's ability to hold its higher range seems to rely more on the conviction of spot holders than fresh demand from ETFs.
A return to sustained net inflows would be beneficial for the continuation of the uptrend. Failure to do so could see BTC continue to consolidate, as the market lacks the external liquidity injections that previously drove the rally.
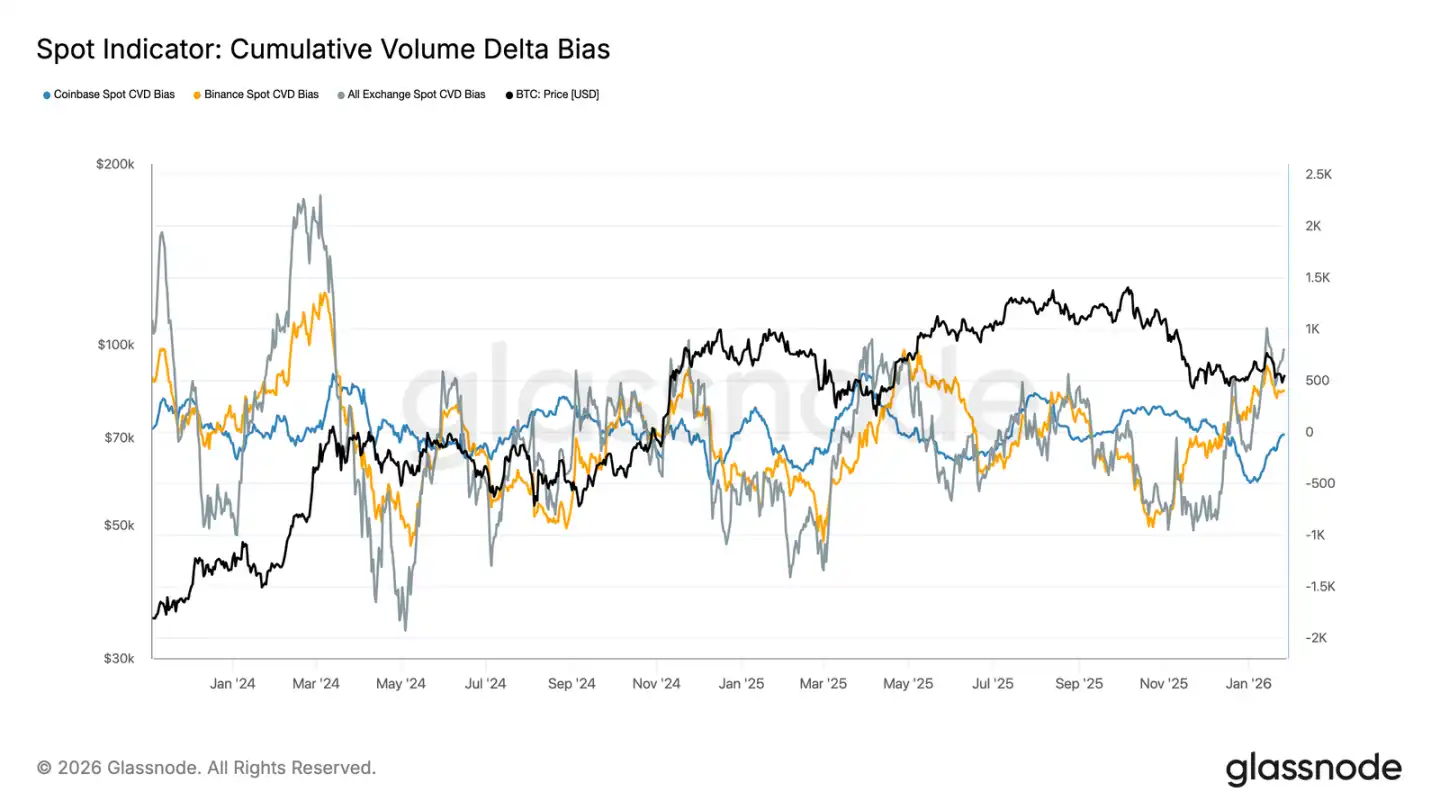
Spot Flow Improvement
Spot CVD bias across major exchanges is rising, showing a return of buying pressure after a long slump. Binance is leading the rebound, recovering sharply from deeply negative levels; the aggregated CVD bias across all exchanges has also turned positive.
However, Coinbase's CVD bias continues to oscillate within a range, indicating relatively stable domestic US demand, though less active than offshore markets. This divergence suggests marginal buying power is returning, but its primary driver is global risk appetite rather than decisive domestic buying.
If buying dominance can persist, it will support further price stabilization or even appreciation. But this cycle has repeatedly failed to sustain positive CVD trends, making follow-through buying key.
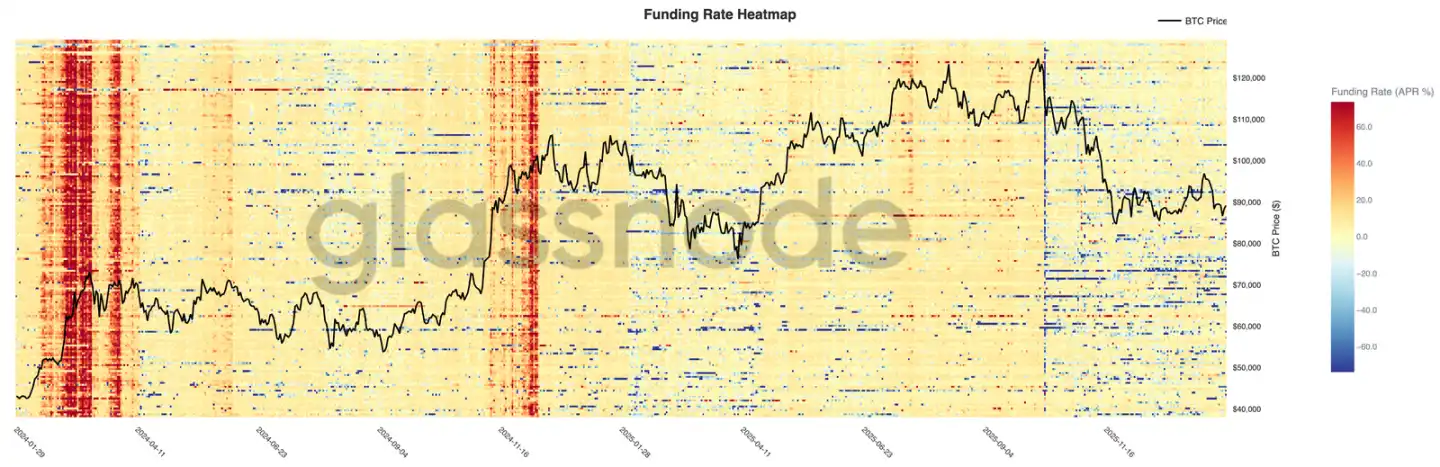
Perp Markets Remain Calm
Perpetual funding rates across exchanges remain mostly neutral, despite significant price volatility. This indicates leverage has been cleaned out, with long and short positions relatively balanced, and neither side consistently paying high funding.
Notably, brief positive funding rate spikes still occur during local bounces, reflecting transient long chasing. But these peaks fail to sustain, reinforcing the view of fragile and fleeting speculative sentiment.
With funding rates compressed and non-directional, the market increasingly relies on spot demand to drive trends. Sustained positive funding would indicate leverage rebuilding and risk appetite returning; persistent neutrality suggests a potential shift into a slow, choppy consolidation phase.
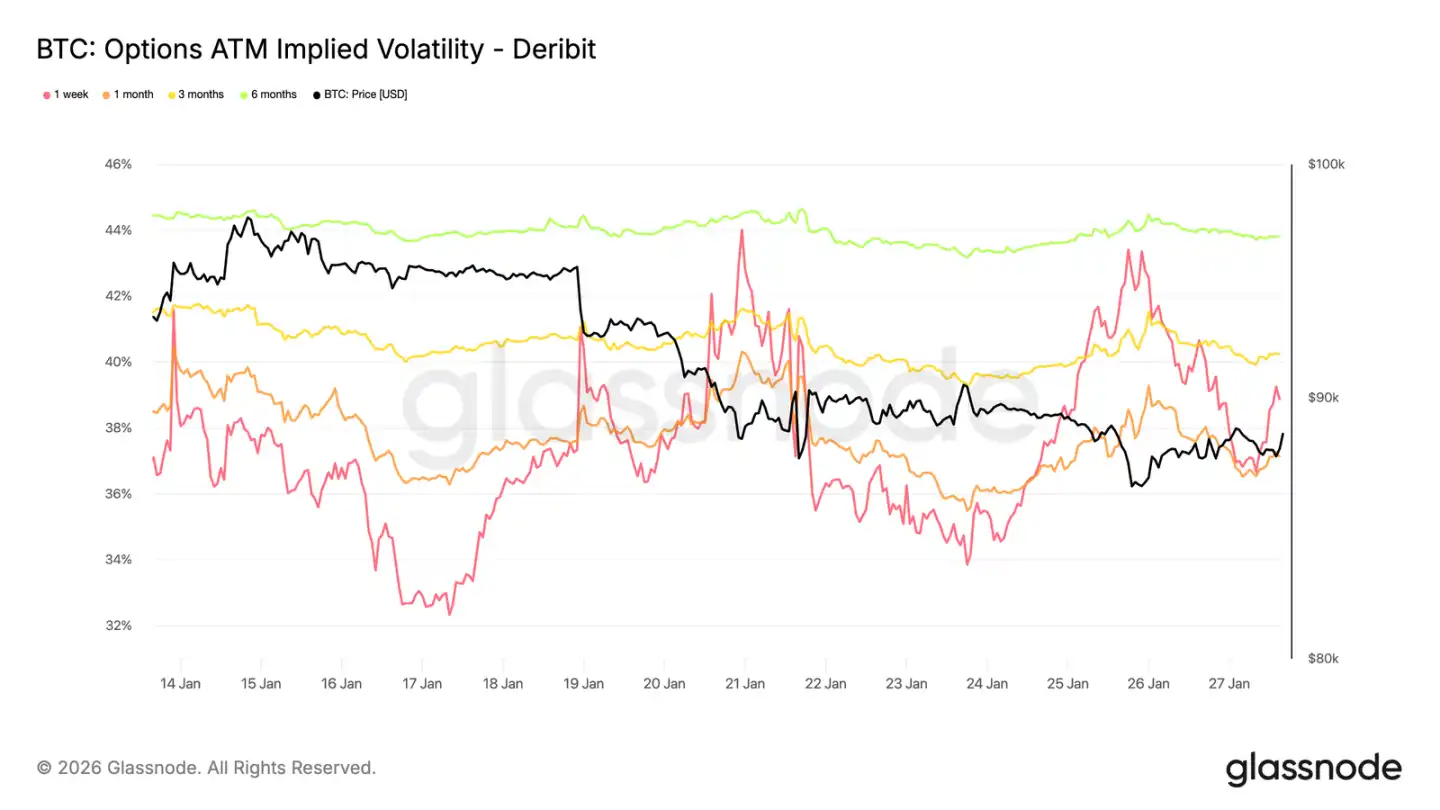
Implied Volatility: Short-Term Up, Long-Term Stable
Short-term ATM implied volatility spiked sharply over the weekend, reflecting increased market sensitivity to the broader short-term risk environment (not just crypto-specific factors).
This shift coincided with rising geopolitical uncertainty and macro risk flare-ups, which typically impact the front end of the volatility curve first. Volatility repricing was concentrated in short-dated options, while longer-dated implied vol remained relatively stable.
This suggests the market is reassessing near-term uncertainty rather than shifting long-term risk expectations—a reaction to external risks, not a sign of internal stress or structural imbalance.
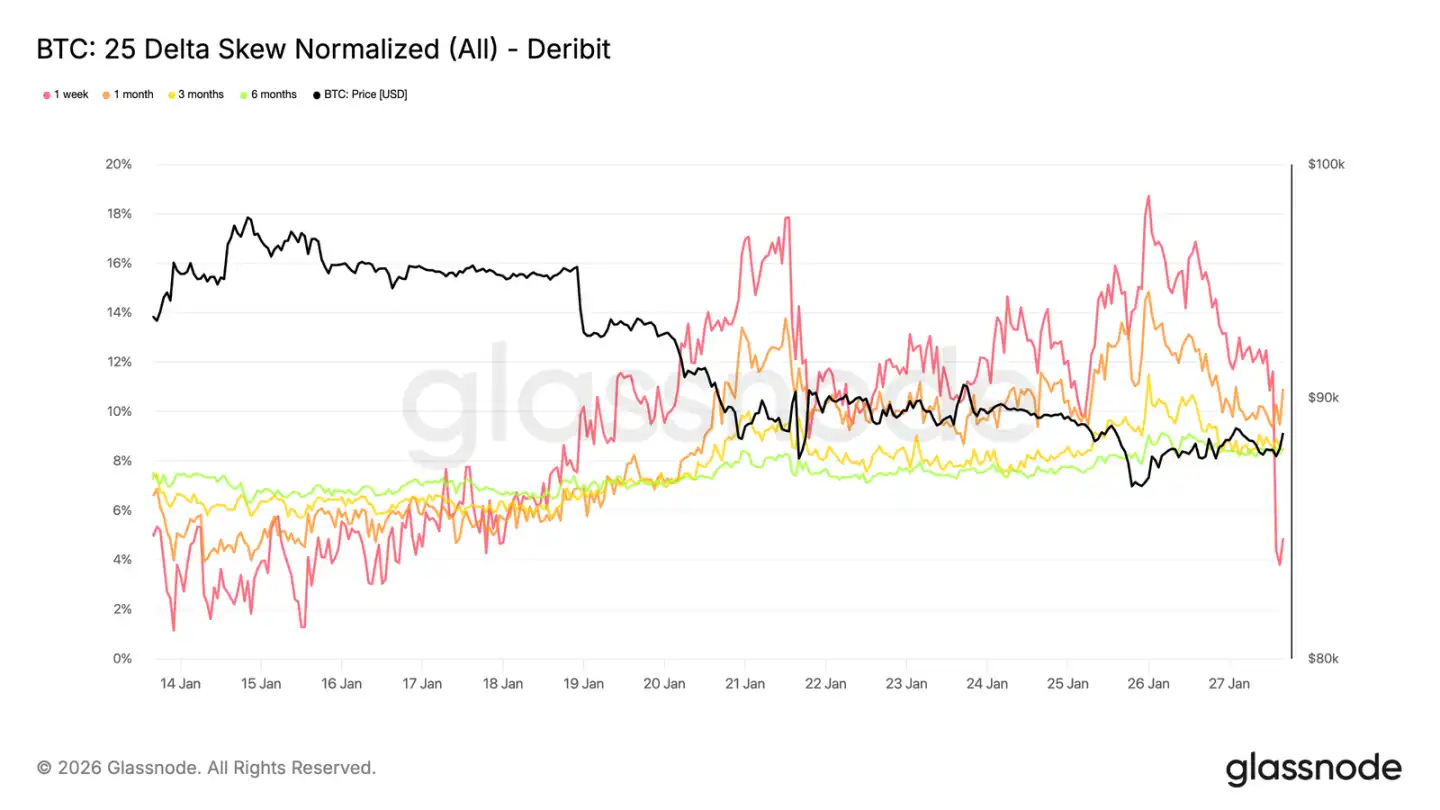
25 Delta Skew: Bearish Sentiment Spreads
As volatility adjusts, skew provides a clearer read on sentiment. 25 Delta skew across tenors has shifted bearish, indicating increased relative demand for downside protection.
This shift implies a more cautious market view over the medium-to-long term, even as spot price action remains orderly. The adjustment is gradual, suggesting deliberate hedging rather than panic buying of puts.
Short-dated skew (especially 1-week) is more volatile, while the overall curve is slightly more bearish than last week. This divergence shows caution expressed across timeframes, but not extreme tension.
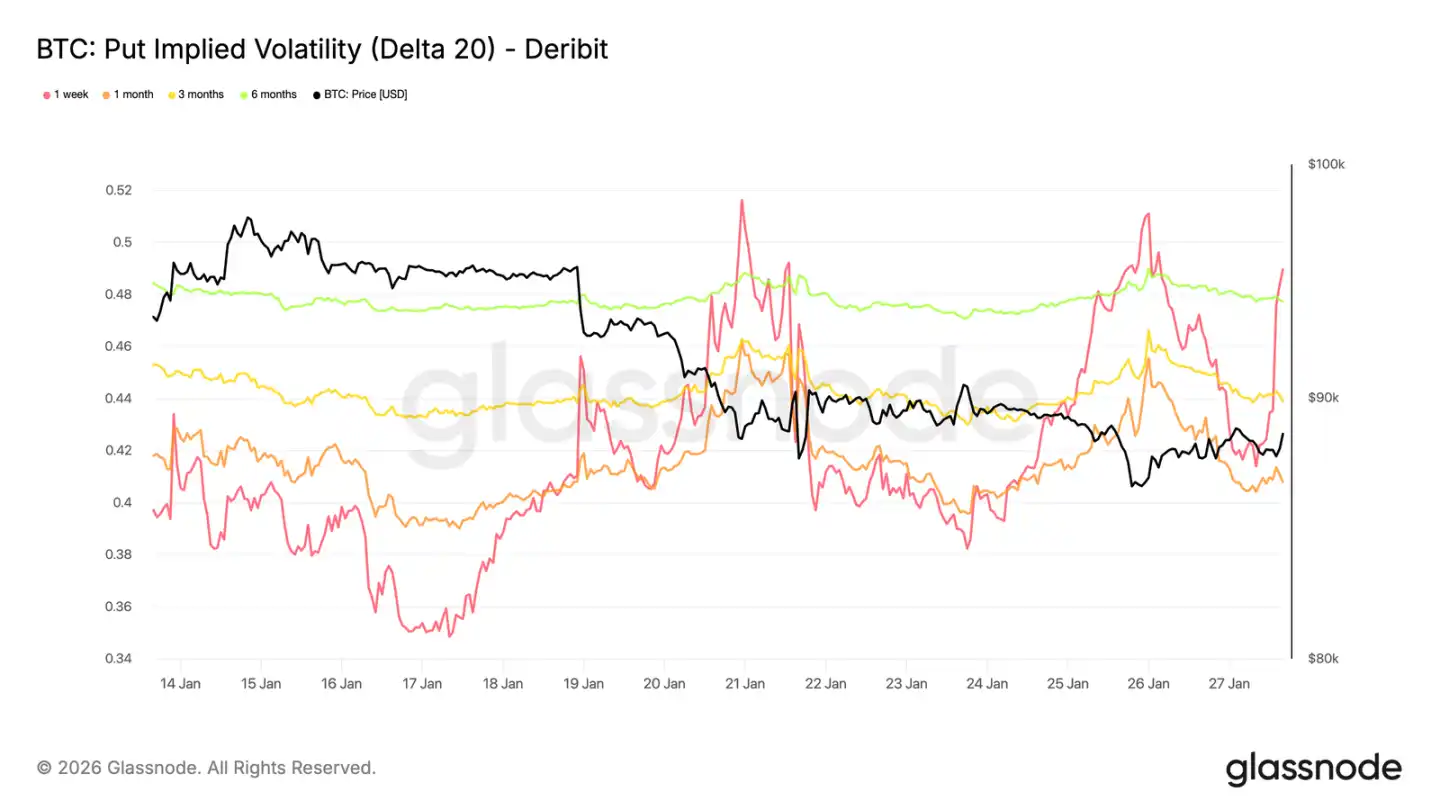
Downside IV: Protected, But No Crash Priced
Interpolated delta-specific implied volatility allows smooth observation of the vol surface across tenors. Here we focus on 20-delta puts, which clearly reflect longer-term downside protection demand.
Despite bearish skew, downside implied vol remains relatively modest across tenors. Even looking at options out to end-2026, the market only prices a modest decline.
This reveals an important nuance: participants are willing to pay more for downside protection than upside, but do not anticipate a sharp collapse. Sentiment is clearly defensive, but expectations for the magnitude of decline remain limited.
This aligns with the 'orderly decline, not panic sell-off' characterization seen recently in spot markets.
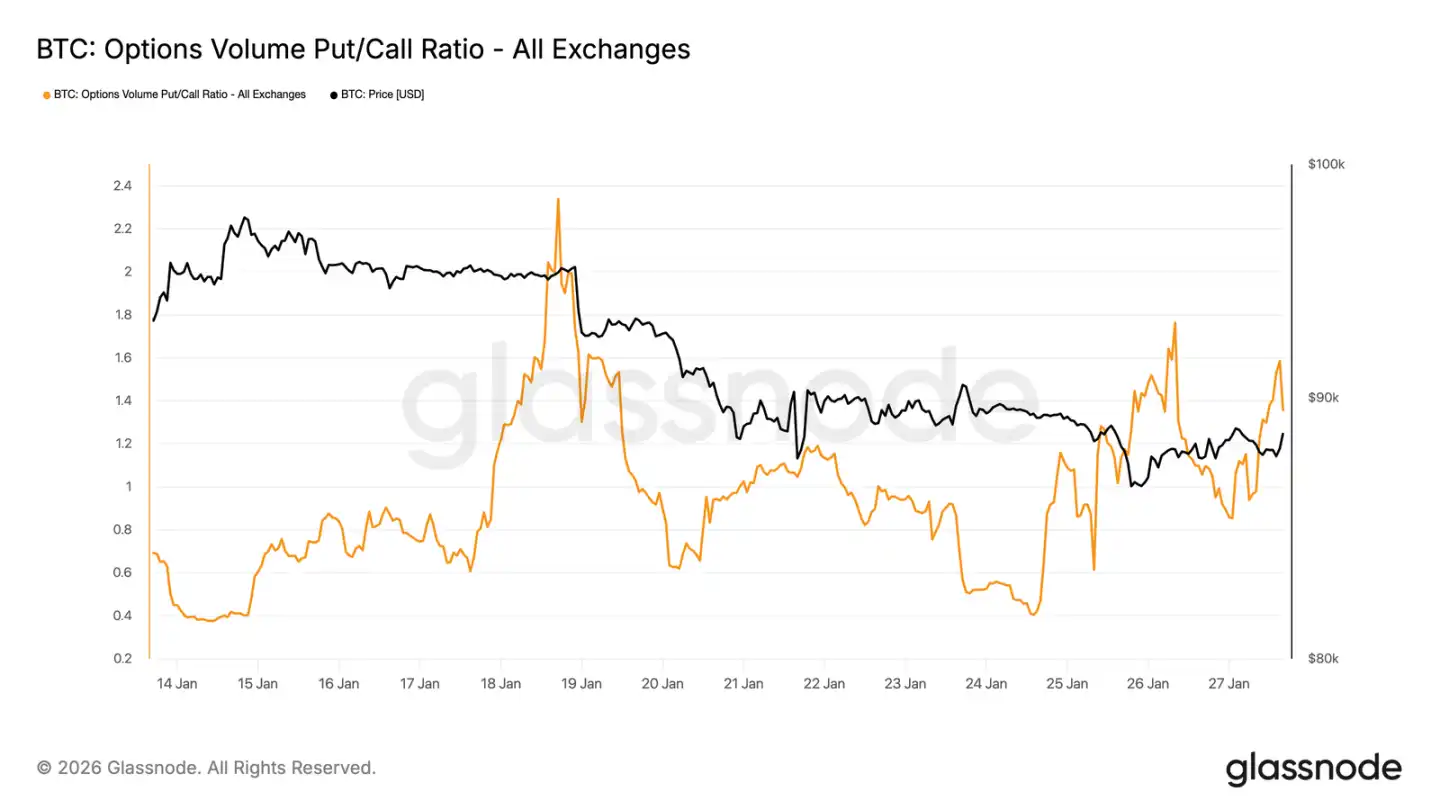
Put Volume Leads
Looking at volume, the put/call ratio in options markets confirms this defensive posture. Put volume has increased relative to calls, but without the volume explosion typically associated with panic hedging.
Activity is active but orderly, suggesting traders are adjusting positions gradually, not chasing moves emotionally. This fits the cautious tone of a market acknowledging downside risks while stepping down in a controlled manner.
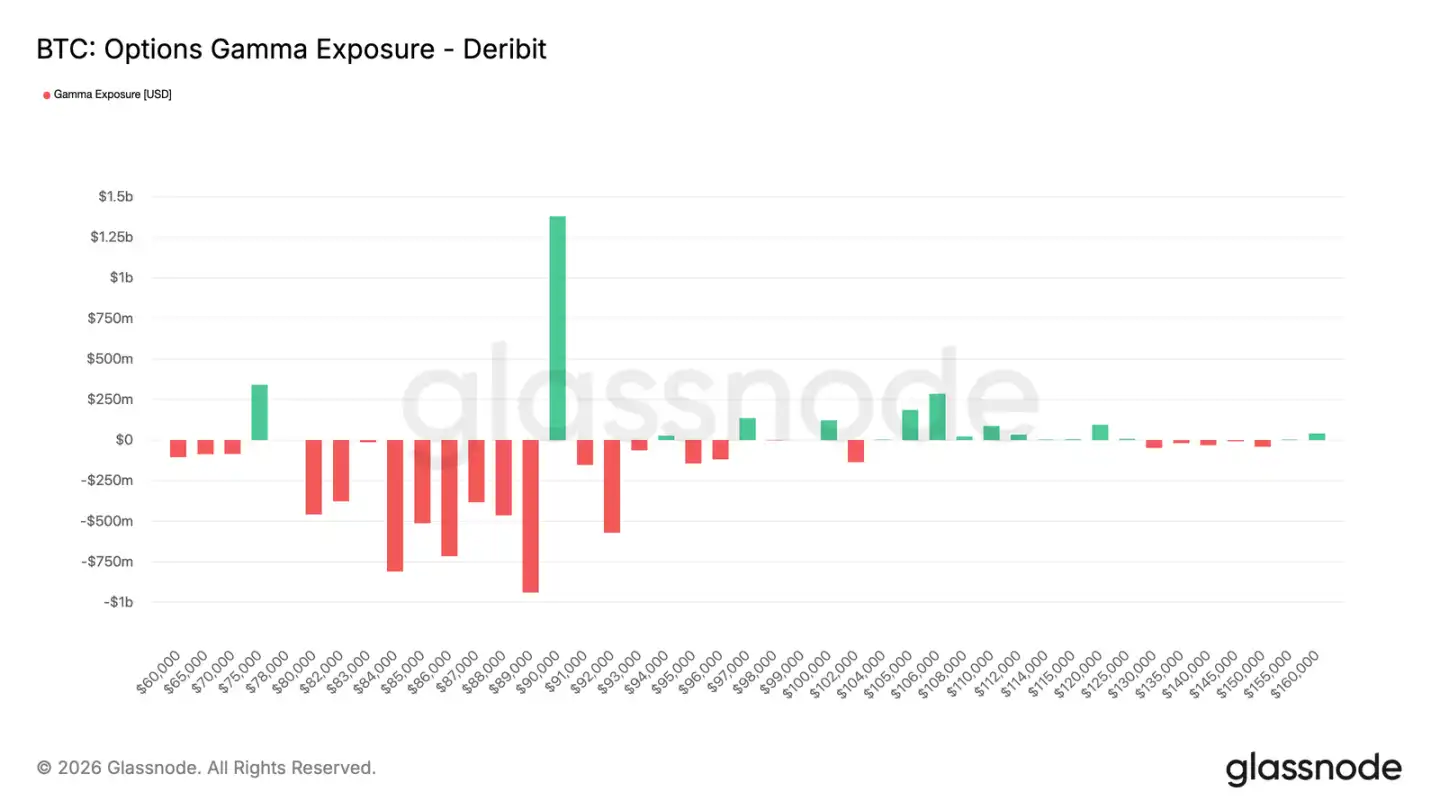
Dealer Gamma: Below $90k Favors Downside
Dealer Gamma exposure reveals an important structural feature of the current market. Dealers hold short Gamma across a wide range from $90k down to ~$75k. This range coincides with a significant support band.
In a short Gamma environment, dealer hedging activity amplifies price moves. As spot declines, dealers sell futures or spot to hedge their short put exposure, mechanically exacerbating the downward momentum. This explains why corrections can deepen even without heavy selling.
Simultaneously, a significant long Gamma concentration remains near $90k. This means breaking above this level requires sustained, forceful buying, not sporadic interest.
Until those conditions appear, market structure favors a slow, controlled grind lower rather than a sharp reversal.
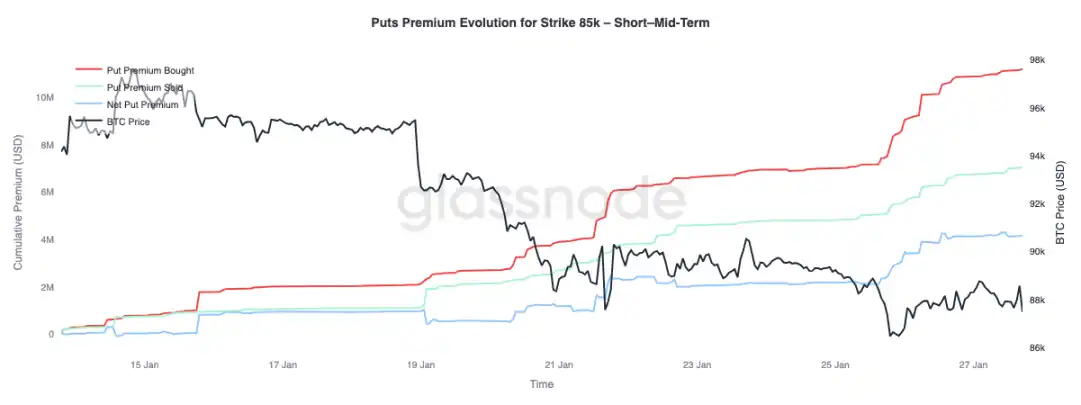
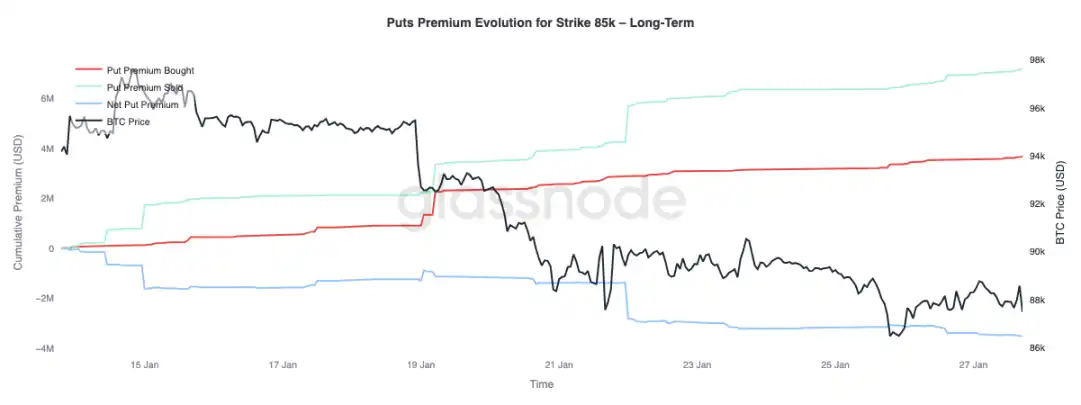
Put Premium: Buying Short-Dated, Selling Long-Dated
Focusing on premium changes for $85k strike puts reveals a term structure divergence: net premium buying dominates for tenors under 3 months, driving net premium higher; tenors beyond 3 months show net premium selling.
This reflects a market response to a potential decline from the mid-$90k range to the high-$80k range: hedging near-term downside risk, while simultaneously being willing to sell longer-dated downside protection. This structure suggests caution is short-lived, with longer-term risk expectations not deteriorating.
Conclusion
Bitcoin continues to consolidate around key on-chain price levels, with a delicate balance between holder conviction and marginal demand. The state of Short-Term Holders remains fragile, and a break of support could trigger a new wave of selling.
However, overall flows are stabilizing: ETF selling pressure has eased, and spot market positioning (especially offshore) shows initial signs of improvement, suggesting buying interest is reviving. Meanwhile, derivative markets show restraint, with neutral funding rates implying low leverage and reduced reliance on speculative capital for price moves.
Options positioning reinforces the cautious stance: skew has turned bearish, short-term protection demand is up, and negative dealer Gamma adds risk of amplified price moves.
The path forward hinges on whether demand via spot and ETF channels can persist. A return to sustained net inflows coupled with stronger spot buying would support trend continuation; conversely, persistent fragility and rising downside hedging demand could lead to further consolidation or deeper correction.