Assessing if OKB crypto is ready to rally after a 54% decline

ambcryptoPublished on 2025-12-23Last updated on 2025-12-23

Abstract

OKB, the utility token of the OKEx exchange, gained 2.39% in 24 hours but remains down 54% from its October high of $238. Despite the sharp decline, technical analysis suggests a potential bullish reversal. The price recently rebounded after nearly retesting a key Fibonacci support level at $90.71. While indicators like the A/D show increasing buying pressure, the RSI has struggled to break above the neutral 50 level, indicating bearish momentum is weakening but not yet fully reversed. Given ongoing market pressure from Bitcoin's bearish trend, OKB may continue consolidating rather than experiencing an immediate explosive rally. Traders are advised to consider buying above the $104.4 support level, with short-term targets at $115.4 and $118.8, using a drop below $104.4 as an invalidation point.

The utility token of the OKEx crypto exchange, OKB [OKB], saw a 2.39% gain over the past 24 hours, at press time. This performance was not overwhelmingly positive, especially considering the price action in recent months.

OKB reached $258 in August. A retracement and a subsequent rally toward the end of September saw the price reach $238 in the first week of October. Since that move, OKB has shed 54% in under three months.

AMBCrypto observed that there is a chance the token is turning bullish.

Why an OKB recovery is possible

As the weekly chart illustrates, the swift uptick in July from $45 to $258 occurred in the space of ten days. The move came after a massive OKB token burn and its transformation into the gas of the X Layer.

Fibonacci retracement levels showed that the 78.6% level is at $90.71. The price reached a low of $91.77 on the 21st of November, a near-perfect retest of the support level, before bouncing higher.

The rebound has been far from straightforward. Momentum has shifted back and forth — first favoring the bulls, then swinging toward the bears, shown in cyan and orange.

During this period, technical indicators started to lean bullish but had not fully confirmed the trend. Notably, the A/D indicator signaled rising buying pressure over the past month, a constructive sign following the deep retracement.

The RSI was pushing toward neutral 50, but was unable to break through. It showed bearish momentum was weakening, but the trend was not yet wholly bullish.

Is OKB ready for a rally, or will it need more time?

Despite the deep retracement in recent months, the higher timeframe swing structure was bullish. The daily chart was oscillating between bear and bull. Given the bearish pressure on Bitcoin [BTC], an OKB rally would be difficult.

The events of 10/10 were not easily forgotten, and investor sentiment remained wary. Liquidity was also likely affected as market makers took a hit.

Hence, it is possible that OKB would spend more time consolidating.

Traders, here’s why OKB is a buy

The 1-day structure break came from the $104.4 swing low. The lower timeframe Fibonacci levels highlighted the importance of the $106-$108 zone as support. The imbalance on the 4-hour chart at $107 (white) also has confluence with the Fibonacci levels.

Traders can buy OKB, with a drop below $104.4 being their invalidation. Short-term targets would be $115.4 and $118.8.


Final Thoughts

  • The OKB rally a few months ago has retraced, and the token is now consolidating and trying to push higher.
  • It might not see an explosive breakout soon, but steady buying pressure could give lower timeframe traders a chance to go long and make profits.

Disclaimer: The information presented does not constitute financial, investment, trading, or other types of advice and is solely the writer’s opinion

Related Questions

QWhat was the recent price performance of OKB and what significant decline did it experience?

AOKB saw a 2.39% gain in the past 24 hours, but it has experienced a 54% decline from its October high of $238 in under three months.

QWhat key technical support level did OKB retest in November, and what was the price at that level?

AOKB retested the 78.6% Fibonacci retracement level, reaching a low of $91.77 on November 21st, which was near the key support at $90.71.

QWhat is the primary reason cited in the article that an OKB recovery is possible?

AThe article cites the successful retest of a major Fibonacci support level and a shift in the A/D indicator, which signaled rising buying pressure over the past month, as reasons a recovery is possible.

QAccording to the article, what is the suggested invalidation level for a long trade on OKB?

AThe suggested invalidation level for a long trade is a drop below the $104.4 swing low.

QWhat is the overall market condition that could make an immediate OKB rally difficult?

AThe article states that given the bearish pressure on Bitcoin [BTC], an immediate OKB rally would be difficult.

Related Reads

Bitroot Public Chain Invited to Attend Tencent Cloud Singapore AI Conference, Discussing the Future Alongside Solana

On May 19, Bitroot, an emerging Layer 1 blockchain, participated in the Tencent Cloud AI Summit in Singapore alongside key industry players like Solana Foundation. The event explored the intersection of AI infrastructure, enterprise applications, AI Agents, and Web3. Bitroot's invitation, despite being pre-mainnet, highlights industry interest in its focus on high-performance, AI-native architecture tailored for future AI Agent execution and verifiable on-chain automation. Bitroot CEO Juan Jose emphasized that AI competition is shifting from model performance to data, real-world application scenarios, and trust infrastructure. He argued that for AI Agents to evolve from assistants to autonomous executors managing transactions and assets, they require low-latency, low-cost, and high-throughput blockchain environments. Bitroot aims to address this through its EVM-compatible design, optimistic parallel execution, and a consensus mechanism targeting high scalability. Currently in its Testnet 5.0 phase, Bitroot reports metrics like over 50,000 peak TPS and sub-0.3 second average block time. Its narrative positions it within a growing landscape where next-generation Layer 1s like Monad and Aptos also compete on performance, while Bitroot differentiates by integrating AI computational capabilities natively across its stack. The summit underscored that the fusion of AI and Web3 is moving from concept to infrastructure competition, where networks balancing performance, security, and verifiability will be crucial for enabling scalable AI-driven applications.

marsbit7m ago

Bitroot Public Chain Invited to Attend Tencent Cloud Singapore AI Conference, Discussing the Future Alongside Solana

marsbit7m ago

Hedge Fund Q1 Interpretation: Everyone Is Selling Software, Buying Chips

Hedge Funds and Mutual Funds Aligned in Q1: Dumping Software, Buying Chips A clear consensus emerged among major U.S. hedge funds and mutual funds in Q1: they were simultaneously selling software stocks and pouring capital into the semiconductor sector. This aggressive rotation pushed semiconductor exposure in hedge fund long portfolios to a record high. Hedge funds delivered a 7% return year-to-date, while only 30% of large-cap active mutual funds outperformed their benchmarks. The average short interest for S&P 500 constituents rose to 3% of market cap, the highest since 2011. Within technology, the structural shift was stark. Hedge funds' semiconductor weighting hit an all-time high, while software fell to its lowest since 2019. Excluding Microsoft, mutual funds' relative overexposure to semis vs. software was the largest since 2012. Microsoft was among the most net-sold stocks by both groups. Hedge funds net purchased semiconductor names like LRCX and AMAT. Strategies diverged on leverage and cash. Hedge funds increased their net exposure to near a one-year high after an initial cut. Mutual funds raised their cash allocation, though it remains historically low at 1.4%. Sector alignment was high in Industrials (both overweight) but divergent in Tech: hedge funds increased their Tech net tilt by a record 853 basis points, while mutual funds reduced theirs. Clear splits also appeared in Financials and Consumer Discretionary. Four stocks appeared on both Goldman's hedge fund VIP and mutual fund overweight lists: BA, MA, MRVL, and V. This "shared favorites" basket has returned 10% YTD, outperforming the equal-weight S&P 500. Notably, all "Magnificent Seven" stocks are on the hedge fund VIP list but are uniformly underweighted by mutual funds.

marsbit17m ago

Hedge Fund Q1 Interpretation: Everyone Is Selling Software, Buying Chips

marsbit17m ago

The Evolution Path of Physical Bitcoin

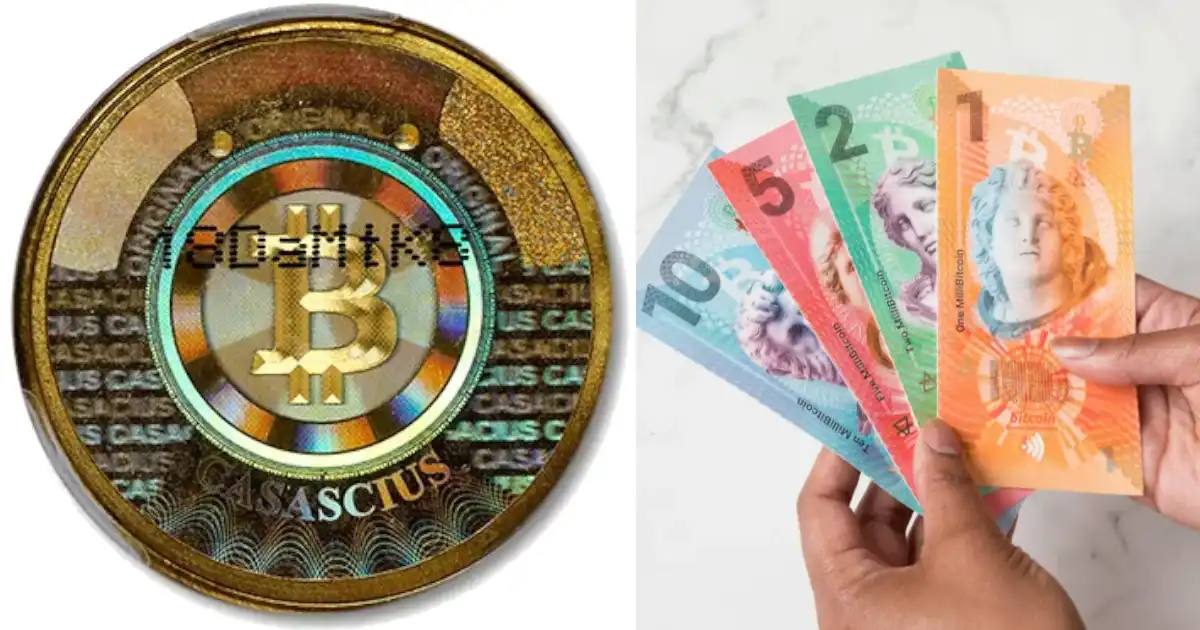
The Evolution of Physical Bitcoin Bitcoin's digital nature is its core strength, enabling self-custody and rapid global transfers. However, its intangibility also hinders mainstream adoption. For over a decade, creators have attempted to materialize Bitcoin while preserving its cash-like properties, yielding notable results. Casascius Coins, launched in 2011, were the first and most iconic physical Bitcoin. Creator Mike Caldwell generated private keys offline, printed them on coins, and sealed them with tamper-evident holograms. This model relied on user trust in the centralized issuer. Production ceased in 2013 due to regulatory pressure from FinCEN. RavenBit Coins emerged in 2014 aiming to decentralize minting by letting users generate and apply their own keys. However, this led to trust issues with numerous untrusted minters and insecure key generation methods. In 2016, Coinkite introduced Opendimes—a breakthrough in bearer asset technology. These USB-shaped devices generate and store keys internally. Funds can be received by checking the public key, but spending requires physically breaking the device to extract the private key. While innovative and open-source, its cost (~$20) and form factor limit its use for small, everyday transactions. Satochip's Satodime, a card-shaped device using similar secure chip technology, followed. It supports NFC interaction and comes in various forms. While potentially cheaper in bulk (~13€), it remains a high-security hardware wallet, not a low-cost cash substitute. A fundamental cost barrier exists. For physical Bitcoin to achieve widespread commercial use, hardware costs must drop below $1 to match the production cost of fiat banknotes. Current secure chips capable of running Bitcoin's cryptographic algorithms (like secp256k1) are too expensive. Chips like NXP's NTAG X DNA (~$3) show cost-reduction potential but lack native Bitcoin curve support. Projects like OfflineCash embed chips in banknote-like paper, but face challenges with durability, the need for custom Bitcoin-enabled chips, and the inherent requirement for users to verify balances online—which conflicts with Bitcoin's trustless ideal. Coinkite's Tapsigner, a ~$20 card with a proprietary Bitcoin NFC chip, is seen as a more practical step forward. It functions as a reloadable hardware wallet for contactless payments, solving the "change" problem and focusing on real-world retail integration, a direction also pursued by companies like Cash App and Square. In summary, the journey to physical Bitcoin has progressed from trusted centralized mints (Casascius) to user-generated keys (RavenBit) and finally to self-contained secure hardware (Opendimes, Satodime, Tapsigner). The core challenge remains developing a sufficiently low-cost, durable, and truly trustless physical bearer asset that can function like cash in daily transactions. Current solutions are either too expensive or introduce new trust assumptions, keeping the ideal of ubiquitous physical Bitcoin just out of reach for now.

marsbit1h ago

The Evolution Path of Physical Bitcoin

marsbit1h ago

Trading

Spot
Futures

Hot Articles

How to Buy ZEST

Welcome to HTX.com! We've made purchasing Zest Protocol (ZEST) simple and convenient. Follow our step-by-step guide to embark on your crypto journey.Step 1: Create Your HTX AccountUse your email or phone number to sign up for a free account on HTX. Experience a hassle-free registration journey and unlock all features.Get My AccountStep 2: Go to Buy Crypto and Choose Your Payment MethodCredit/Debit Card: Use your Visa or Mastercard to buy Zest Protocol (ZEST) instantly.Balance: Use funds from your HTX account balance to trade seamlessly.Third Parties: We've added popular payment methods such as Google Pay and Apple Pay to enhance convenience.P2P: Trade directly with other users on HTX.Over-the-Counter (OTC): We offer tailor-made services and competitive exchange rates for traders.Step 3: Store Your Zest Protocol (ZEST)After purchasing your Zest Protocol (ZEST), store it in your HTX account. Alternatively, you can send it elsewhere via blockchain transfer or use it to trade other cryptocurrencies.Step 4: Trade Zest Protocol (ZEST)Easily trade Zest Protocol (ZEST) on HTX's spot market. Simply access your account, select your trading pair, execute your trades, and monitor in real-time. We offer a user-friendly experience for both beginners and seasoned traders.

396 Total ViewsPublished 2026.05.19Updated 2026.05.19

How to Buy ZEST

HTX Learn: Learn Hot Tokens to Share 1000 USDT​

To enhance your understanding of this week's featured cryptos, we are rolling out various rewarding events. Join them now and bring home generous rewards through learning and trading.

19.0k Total ViewsPublished 2026.05.21Updated 2026.05.21

HTX Learn: Learn Hot Tokens to Share 1000 USDT​

Discussions

Welcome to the HTX Community. Here, you can stay informed about the latest platform developments and gain access to professional market insights. Users' opinions on the price of A (A) are presented below.

活动图片