
Author: SOL, the Unfathomable
After losing $20 million, I finally understood the probabilities of investing: for A-shares, the most important thing is to exit at the top; for U.S. stocks, the most important thing is to buy the dip.
Exiting the top in A-shares, especially a major top, is both the easiest and the most difficult. It's easy because the top of A-shares is typically a peak of euphoria; in hindsight, the word "major top" is almost written on the chart.
It's difficult because A-shares only make money when going long, and the stock market generally rises over the long term. Exiting the top locks in profits but doesn't make money by itself, and human nature is inherently greedy.
In contrast, the most important thing for U.S. stocks is to buy the dip. Looking at the market over the past 20 years, buying on every dip has been the most important investment rule.
One could say that for money already invested, it's simply a matter of holding on; the key is when to buy the dip with new money? And for investing in U.S. stocks, the easiest and most difficult thing is also buying the dip.
It's easy because buying the dip in U.S. stocks means "buy a little on small dips, buy a lot on big dips, don't buy when there's no dip."
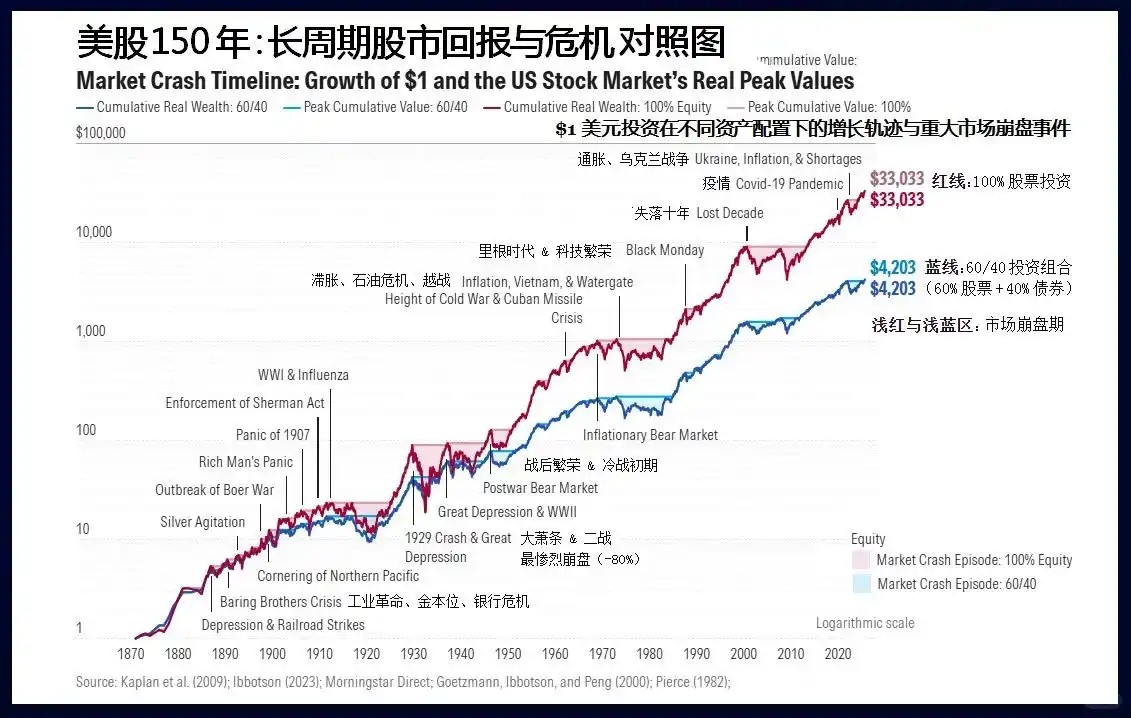
Since 1776, everyone who has bet against America has ultimately ended in their own miserable failure.
It's most difficult because most people come from A-shares, where they've experienced "buying the dip halfway down the mountain," suffering from "dip-buying PTSD syndrome." They always want to buy lower to give themselves some safety cushion, resulting in not daring to buy during the dip and then chasing the rebound.
Therefore, when a dip-buying opportunity arises in U.S. stocks, everyone must clarify two questions:
1. Under normal circumstances, how much does a typical U.S. stock correction fall?
2. If a black swan event occurs and the fall seems endless, what should be done?
1. How deep are U.S. stock corrections? First, let's define what a "correction" is.
Corrections are usually divided into three levels: daily, weekly, and monthly. A round of decline must meet one of two conditions: magnitude or duration (everyone's definition may differ; this article only represents my standard).
- Daily level: A drop of 5% or more from the highest point, or a duration of more than two weeks (referring to the time span from the highest to the lowest point);
- Weekly level: A drop of 10% or more from the highest point, or a duration of more than 4 weeks;
- Monthly level: A drop of 15% or more from the highest point, or a duration of more than 4 months.
Meeting one of the two conditions is sufficient. Some corrections are not deep in magnitude but drag on for a long time; others are the opposite. After clarifying the definition, buying the dip essentially has two goals:
- Goal one: Buy all the positions you want
- Goal two: Buy as cheaply as possible
Market trends are always clear in hindsight but confusing in real-time. When a correction is happening, we can only be sure of two things—how much it has fallen from the previous high to today, and how many days it has been falling?
It could continue to fall, consolidate, or start rising again.
So these two goals conflict. Buying too quickly might achieve goal one but at a higher price;
But if you only focus on buying cheap, you might miss out and the price could rise without you.
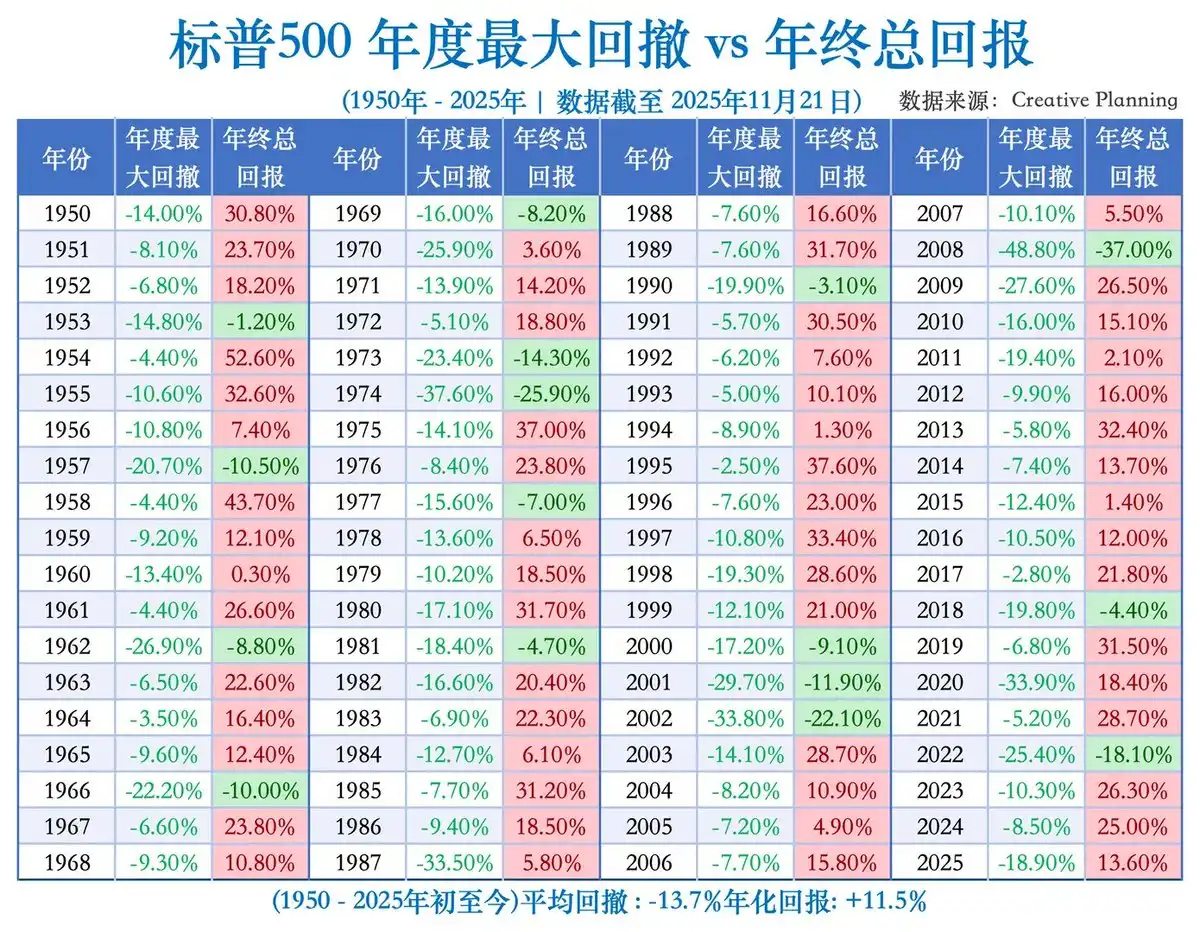
This requires us to have a probabilistic understanding of the magnitude of corrections in the historical trends of U.S. stocks to set a reasonable goal.
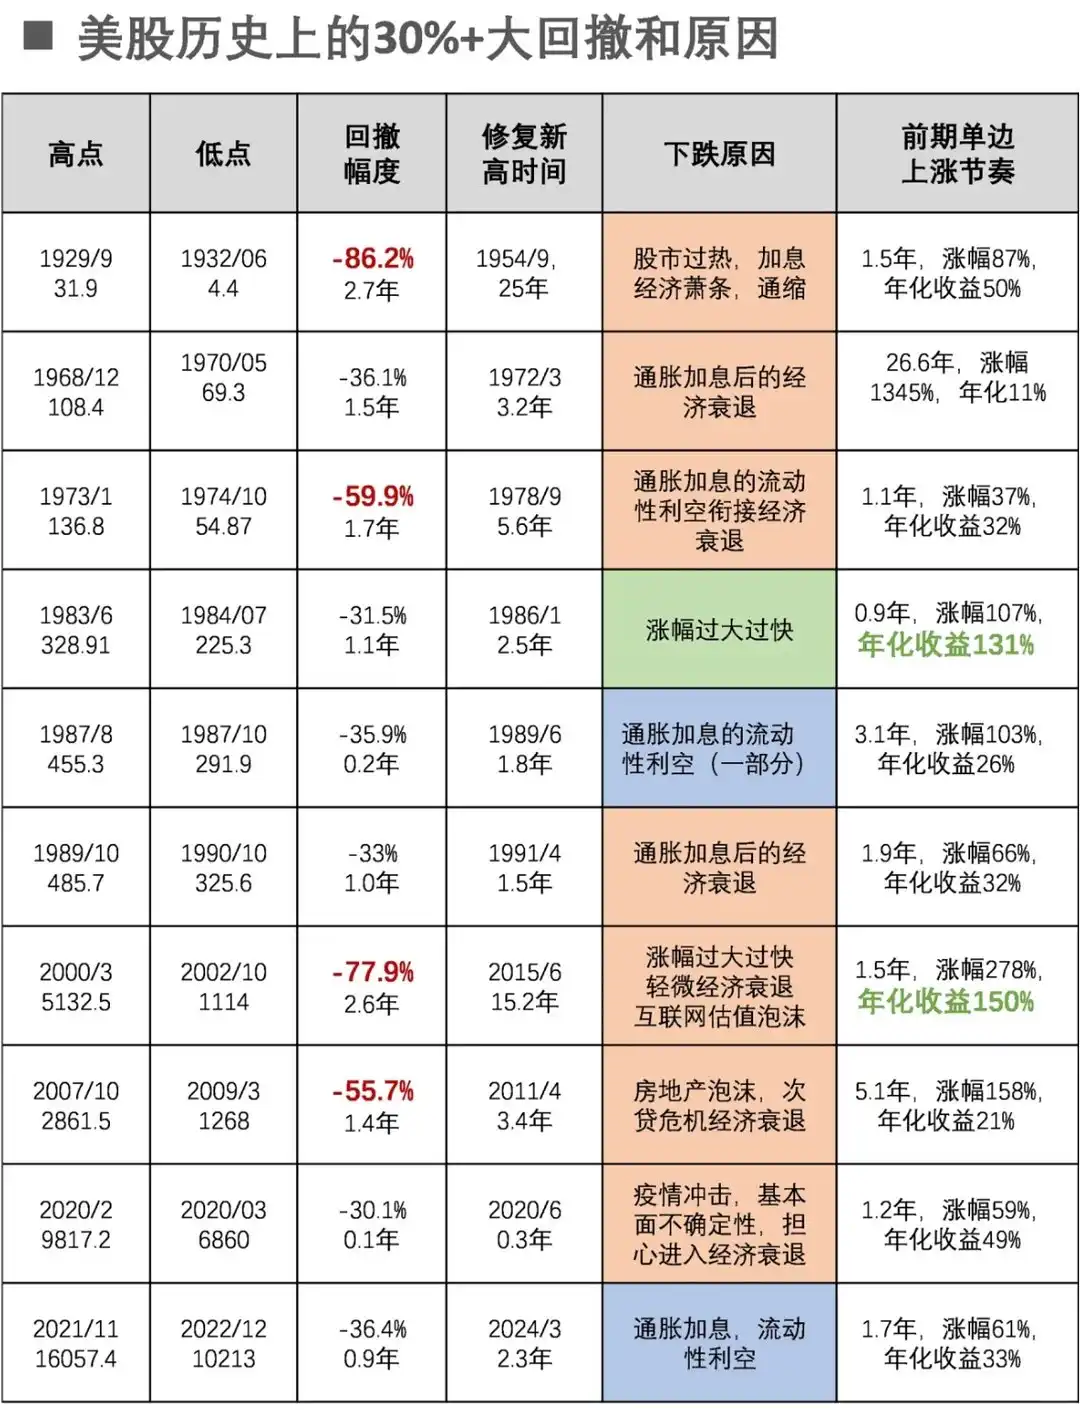
Major Drawdowns of 30%+ in U.S. Stock History and Their Causes
Taking the S&P 500 Index as an example, there have been only 7 monthly-level corrections in the past 20 years since 2004, with reasons分别为:
- Jan-Oct 2022: The most aggressive interest rate hike cycle in 40 years
- Feb-Mar 2020: Global public health event
- Sep-Dec 2018: Trade war combined with interest rate hikes
- Jul 2015 - Feb 2016: Chinese economic slowdown combined with interest rate hike expectations
- Apr-Sep 2011: Deepening European debt crisis
- Apr-Jun 2010: European debt crisis and Goldman Sachs fraud scandal
- Oct 2007 - Mar 2009: Subprime mortgage crisis
So monthly-level corrections in U.S. stocks are still very rare, occurring on average once every three years, each with macro-fundamental reasons. From September 2011 to July 2015, there was a 44-month period without one, a proper long bull market.
Weekly-level corrections are more frequent, happening 2-3 times a year, and don't necessarily require fundamental reasons; just rising too much can lead to a correction.
Therefore, when buying the dip, the first thing to judge is whether this is a weekly-level or a monthly-level correction?
But stock movements are influenced by various new pieces of information, making accurate prediction difficult. The Fed isn't your family's business; negative and positive news won't arrive according to your plan—fortunately, you can still decide your own goal.
You need to think about a question, imagine it's haggling with a vendor: if you can only choose one goal between "buying" and "buying cheaply," which do you choose?
If it's the former, you should assume the correction is weekly-level and plan accordingly. This way, even if it turns out to be a monthly-level correction, you can still complete your first goal. Similarly, if your goal is "buying cheaply," you should prepare a dip-buying plan for a monthly-level correction.
However, generally, I recommend making "buying" the primary goal, especially when you have idle cash. First, because monthly-level corrections occur only every three years, the probability is indeed low. Second, with idle cash, if you don't buy U.S. stocks, you might end up buying other high-risk products.
With a goal, the plan becomes much simpler.
2. Time Plan vs. Price Plan: The First Question in Buying U.S. Stock Dips—When to Start the Plan?
Taking a weekly-level correction's dip-buying as an example, as long as it doesn't hit a new high for two weeks, a daily-level correction is already happening, and you should prepare a dip-buying plan for a weekly-level correction.
The core of buying U.S. stock dips is two words—scale in.
There are two types of scaling-in plans: one is time-based scaling, buying at fixed time intervals; the other is price-based scaling, buying when the price falls to certain levels. Based on the trends of the past 20 years, for weekly-level corrections (excluding monthly-level ones), the average time from high to bottom is 10 weeks. Thus, time-based scaling can be divided into three batches: starting from the high, buy the dip every three weeks afterward, with a longer interval between the second and first batches.
Price-based scaling can also be divided into three batches, buying one batch at a 3% drop from the high. If the maximum drop is 10%, the entire dip-buying plan can be completed.
The completion probabilities of these two plans differ. The time plan can generally be completed unless it's only a daily-level correction that quickly hits new highs—which isn't regrettable, as you've at least seized a daily-level correction opportunity to add positions.
But the price-based plan might not be completed. Many weekly-level corrections in U.S. stocks only last longer without reaching a 10% drop.
For weekly-level corrections, with "completing the dip buy" as the primary goal, "time-based scaling" should be prioritized. Even if the drop hasn't reached the target, once the correction time arrives, execute the scaling-in plan.
Now, considering a dip-buying plan targeting monthly-level corrections: the average time to bottom is 6.5 months, but it varies greatly. So, adopt the mindset of "probably won't complete the buy" and buy as much as possible.
Don't average the position sizes; instead, use a front-heavy approach: three batches at 1/2, 1/3, and 1/6 of the total plan.
The time plan can be batched as: first month, third month, sixth month. The price plan can be batched as: 3% drop, 8% drop, 15% drop. Often, when you target a "monthly-level" correction, you end up completing a weekly-level correction's dip-buying plan but with insufficient volume. Hence, I initially suggest focusing on the weekly-level correction plan as much as possible.
Buying U.S. stock dips can be simply summarized as three dos and three don'ts:
1. Do make a scaling-in plan; don't make random decisions or trade impulsively during the session;
2. Prioritize "buying enough" over "buying cheaply";
3. Prioritize "time-based scaling" over "price-based scaling." Buying U.S. stock dips is a very mechanical plan, and the premise of this plan is the long-term upward and relatively low-volatility trend of U.S. stocks.
But the stock market is ultimately a place of human博弈, and economic operations themselves are unpredictable. Black swan events can happen at any time and will inevitably happen.
If the correction's duration or depth exceeds the plan, how should you respond? If a black swan event occurs, what should be done?
3. Black Swan Events
The above corrections are divided into monthly and weekly levels, which has the advantage of clear standards. But even among monthly-level corrections, differences are significant. For instance, 2008 and 2020 were actually economic crises, not mere stock market corrections.
Thus, market adjustments can also be categorized into three types based on causes:
1. Natural correction due to excessive cumulative gains, but macro fundamentals are generally positive—Most daily and weekly-level corrections fall into this category.
2. Correction due to overvaluation combined with economic recession or a shift to hawkish monetary policy—A minority of weekly and most monthly-level corrections belong here.
3. Economic crisis or major recession caused by systemic risk—A minority of monthly-level corrections or long-term bear markets fall into this category.
In the past 20 years, the 2008 subprime crisis and the 2020 public health event belong to the third type. The former fell 58% in over a year; the latter fell 35% in two months. So the third situation exceeds our dip-buying plan and requires separate analysis.
However, crises and corrections are indistinguishable at the beginning. When U.S. stocks started falling in 2007, the market thought it was an economic recession. After the Fed began cutting rates, the market rebounded. By early 2008, investors were already buying the dip aggressively.
Therefore, during the dip-buying process, continuously observe whether new events have occurred initially or whether the initial causes of the decline have worsened.
Taking recent deep declines as examples: A standard bear market like the 27% drop in 2022 is actually the easiest to judge. It's driven by standard macro logic; everyone is discussing rate hikes; all prices are soaring; every month, data tells you it's worse than the last. At most, you might have losses at the initial confirmation of the dip buy; later, you'll naturally know it's a protracted battle, requiring an extended dip-buying timeline.
A "once-in-a-lifetime" crash like the 36% drop in one month during the 2020 public health event, triggered by non-economic black swan factors, is indeed panic-inducing short-term, but once it's over, it's over. In this case, you can only endure.
The most difficult was the 58% drop during the 2008 financial crisis, which was a mix of the above two situations. A crisis event during an ordinary recession triggered a deep recessionary bear market. It couldn't be predicted, only responded to.
Going further back, the 2000 dot-com bubble burst was a rare暴跌 caused by excessive valuation, which in turn dragged down the economy. But the valuation levels then were much, much higher than now. It was a discernible gray rhino event, but no one wanted to "get off first."
Synthesizing these types of U.S. stock declines, you'll find that it's best not to predict U.S. stock declines in advance. The most important thing is to face reality and respond after it happens; the sky won't fall.
Of course, having no expectations and making timely and correct responses after the fact requires you to pay attention to the market. You can't just allocate like wealth management without management. You still need to assess, after a certain stage of decline, whether it might evolve into a crisis.


