Movements identified using the blockchain analysis tool Btcparser.com pertain to bitcoins held in addresses created between 2010 and 2017. The comparison is striking, as the August dataset covers only ten days, with data for August 10th still incomplete, whereas the July data covers almost the entire month.
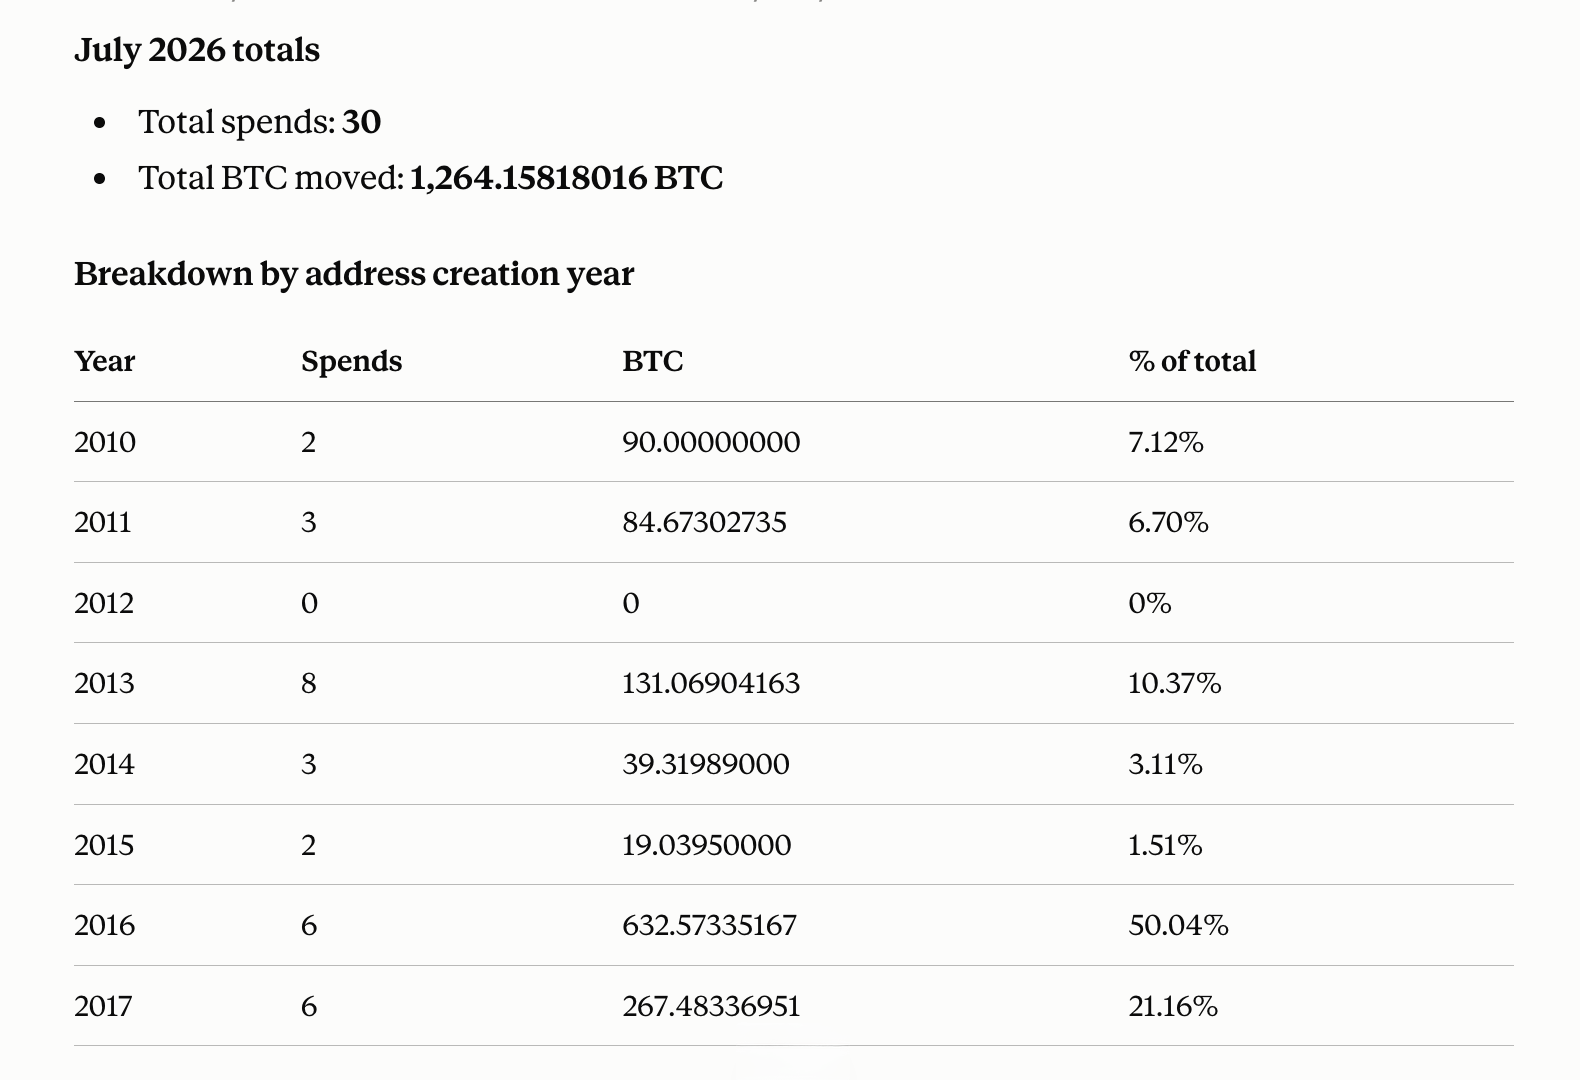
In July, an average of about 40.78 $BTC was moved per day. In August, this figure is 220.91 $BTC per day, more than five times the July rate.
Activity of Inactive Bitcoins Accelerates
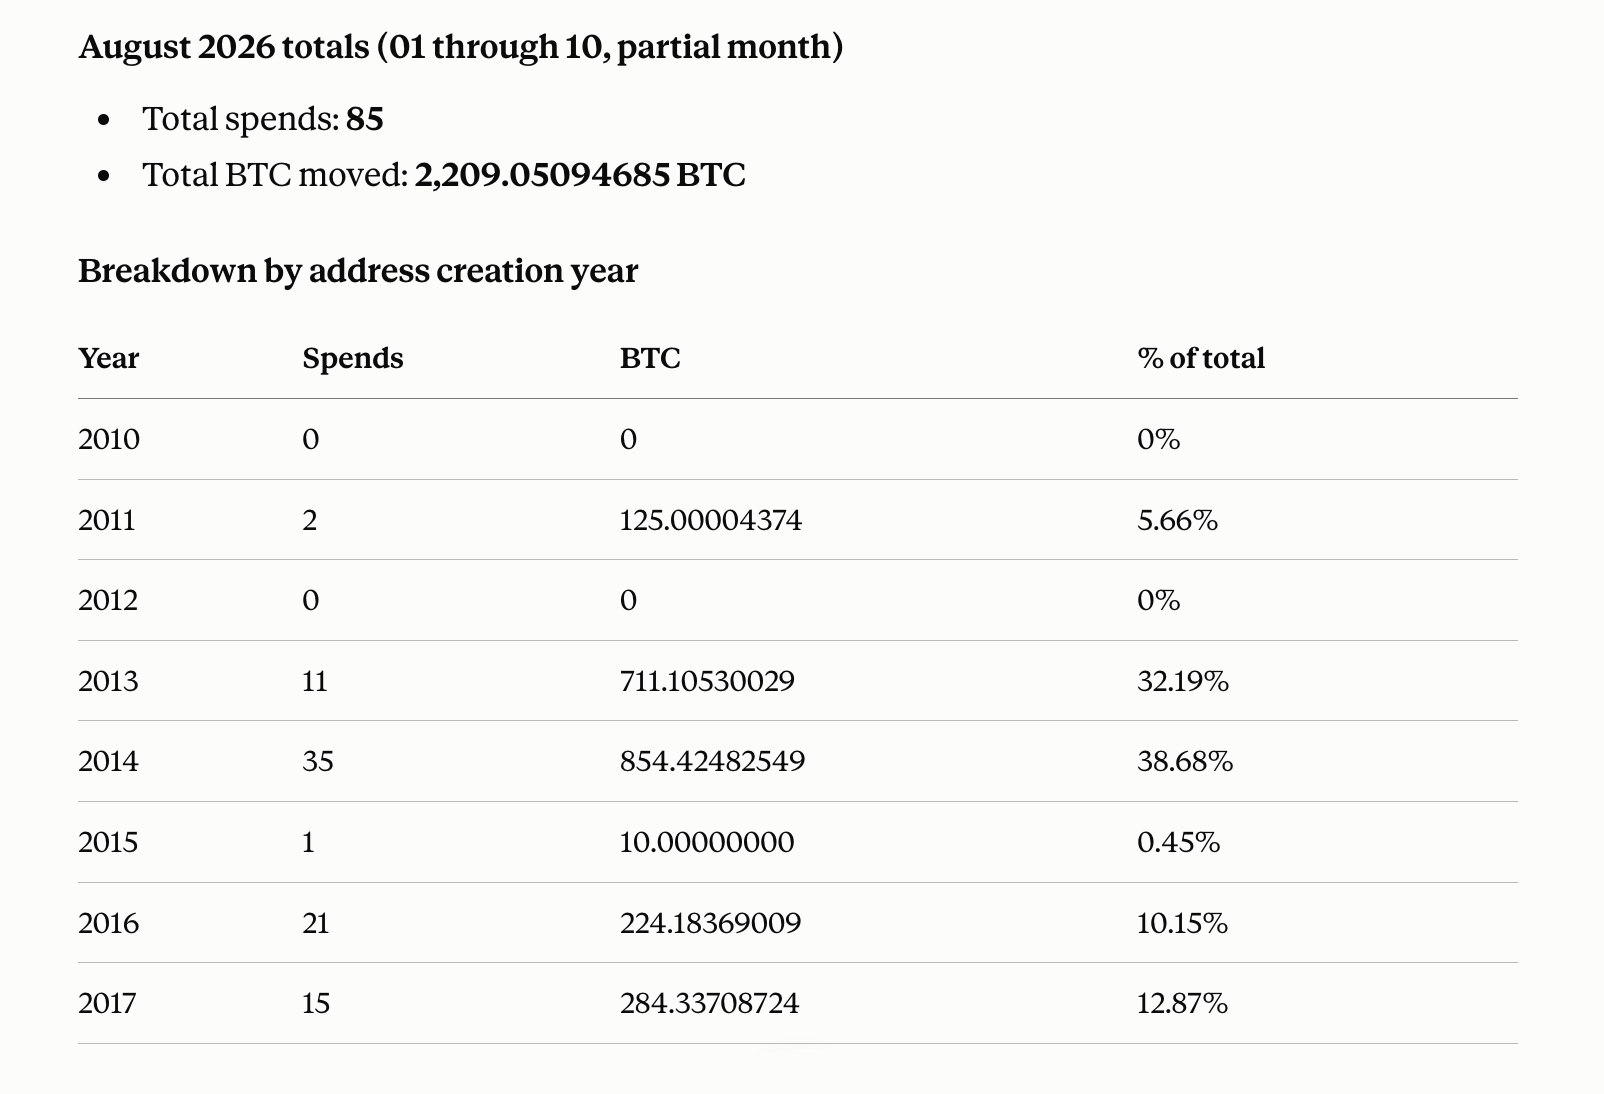
This increase is even more pronounced when looking at the number of transactions. In July, 30 transactions from inactive addresses were recorded, or slightly less than one per day. From August 1st to 10th, the parser recorded 85 transactions, averaging 8.5 per day. August also hasn't had a single completely quiet day yet, whereas July's activity was much more sporadic, including a period of nearly five days during which no tracked movements were recorded.
This does not mean that 85 separate long-term holders suddenly decided to move their coins. Blockchain activity often occurs in batches, and August shows several distinct clusters that may indicate individual owners simultaneously clearing out multiple addresses. Over the last ten days, 35 transactions from addresses created in 2014 moved 854.42 $BTC, while 21 transactions from 2016 addresses moved another 224.18 $BTC. Nineteen of these 2016 transactions were for exactly 10 $BTC each, with the creation dates of their original addresses falling within a four-day period in October 2016.
However, even accounting for this concentration, the acceleration observed in August does not disappear. Excluding the two suspicious clusters—the group of 33 transactions linked to 2014 addresses and the group of 19 transactions linked to October 2016—the remaining 33 August transactions account for 1,215.15 $BTC. This residual activity amounts to about 121.51 $BTC per day, almost three times the July rate of inactive activity of 40.78 $BTC per day.
August's Old Coins Are Very Different from July's
The coin age profile has also changed. July was dominated by $BTC held on older Bitcoin addresses created in 2016 and 2017, which together accounted for roughly 71% of the tracked volume for the month. In August, the situation shifted in favor of older holdings. Addresses created in 2013 and 2014 account for about 71% of the bitcoins moved during the first 10 days.
The most dramatic change occurred in the 2014 cohort. In July, only three transactions totaling 39.32 $BTC were recorded. In August, 35 transactions totaling 854.42 $BTC were registered, though their clustered timing and address creation dates suggest most of this activity came from a single entity, not 35 independent holders. Addresses created in 2013 contributed another 711.11 $BTC, including one transfer of 500 $BTC on August 3rd.
August 3rd stood out as a remarkable day: eight tracked transactions moved 897.14 $BTC. This single day accounted for about 40.6% of the volume in the first 10 days and roughly 71% of the entire volume tracked throughout July. However, the overall picture for August is not solely due to this one day. Inactive coins moved every day during this period, including 14 transactions on August 1st and another 14 on August 7th.
Coldcard Vulnerability Raises an Uncomfortable Timing Question
The acceleration came right after the Coldcard wallet vulnerability shook the self-custody crypto community, raising an obvious question: did this security threat cause long-time holders to reconsider how they store their bitcoin? The timing coincidence is notable, but blockchain data does not establish a causal link between the vulnerability and the movement of inactive funds.
More importantly, the old addresses tracked here were not Coldcard wallets compromised by the vulnerability. Their history spans from 2010 to 2017, predating the launch of Coldcard and the vulnerable 2021 firmware version associated with the security incident. Therefore, these movements on inactive addresses should not be viewed as additional stolen funds. At best, the timing coincidence provides reason to speculate that the widely publicized leak prompted a large number of unrelated long-term holders to revisit old keys, consolidate wallets, or transfer bitcoin to newer storage systems.
There is an interesting lag that fits this theory perfectly but does not prove it. Inactive fund movement remained relatively calm on July 30 and 31, then sharply accelerated on August 1st. Automated theft could begin immediately once attackers obtain usable private key information. Wallet maintenance by humans happens differently. Owners might first read about the security issue, check old backups or hardware, create new wallets, and only then transfer funds.
Blockchain Clues Point to Coordinated Wallet Emptying
The transaction structure also provides hints. Activity in July occurred across 28 separate blocks, with only one block containing multiple tracked spends. August saw nine blocks with multiple spends, and 32 of the 85 spends occurred within these concentrated groups. August's activity was about 8.7 times more intense when measured by transactions per block.
One particularly curious "fingerprint" appears repeatedly in August: eight amounts end in 547 satoshis, including a tiny movement of exactly 0.00000547 $BTC. A satoshi is the smallest unit of bitcoin, equal to one hundred millionth of a coin. A repeating suffix in addresses of different origins could indicate the use of common wallet software, similar transaction structuring, or fundraising infrastructure, though recipient addresses need to be tracked before drawing final conclusions.
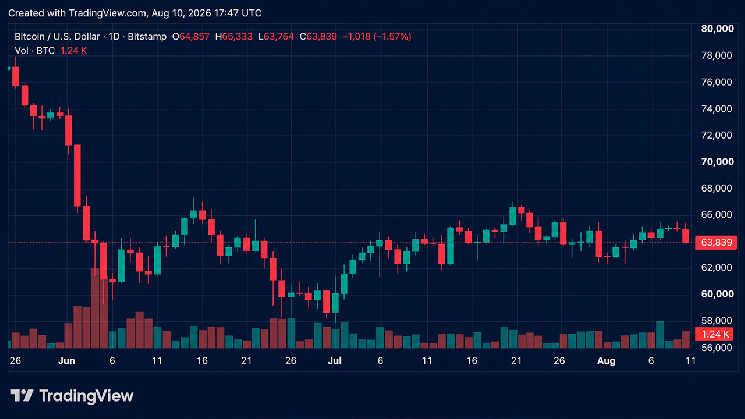
The overall market situation does not suggest panic selling. Bitcoin recovered from an early August dip from around $62,200-$62,300 and was trading near $65,000 by August 10th, showing a gain of about 3–4% over that period. This does not prove that the inactive transfers were related to wallet migration rather than sales, as blockchain transfers alone cannot reveal the owner's motivation or whether the coins ultimately reached an exchange.
The clearest answer may come from the future destination of the received coins. If August's clusters consolidate into new addresses and go dormant again, wallet migration for security purposes becomes a more likely explanation. If significant sums flow to exchanges, versions related to selling or portfolio restructuring become more plausible.
For now, the definitive conclusion is more limited but still impressive: following an episodic and generally sluggish July, inactive bitcoin activity sharply accelerated in August, and even after excluding the most obvious wallet clusters, old coins are moving about three times faster than in July.
end-content