Prediksi Harga Chainlink: Standard Chartered Tetapkan Target $200 untuk LINK, Oracle Capai 33,43 Triliun

cryptonews.ruPublished on 2026-08-11Last updated on 2026-08-11

Abstract

Ringkasan Artikel: Analisis Harga dan Proyeksi Chainlink (LINK) Harga Chainlink (LINK) saat ini berada di level $8.41, mencoba menembus garis tren turun yang bertahan sejak Januari 2026. Untuk konfirmasi breakout teknis, LINK perlu menutup di atas $8.51 (EMA 100 hari). Level kunci selanjutnya adalah EMA 200 hari di $9.55. Analisis fundamental didorong oleh laporan Standard Chartered yang menginisiasi cakupan untuk LINK dengan target harga $200 pada akhir 2030. Target bertahap mereka adalah $13 (akhir 2026), $41 (2027), $82 (2028), $133 (2029). Argumen utamanya adalah pertumbuhan eksponensial aset tokenisasi dan DeFi, di mana Chainlink, sebagai penyedia oracle dan infrastruktur lintas chain (CCIP), akan menagih fee yang meningkat. Jaringan ini telah digunakan oleh institusi besar seperti SWIFT, JPMorgan, dan DTCC. Di sisi penggunaan, oracle Chainlink telah mengamankan nilai transaksi kumulatif sebesar $33.43 triliun, tumbuh dari $30.06 triliun pada April 2026. Data dominasi pasar menunjukkan Chainlink menguasai hampir 50% di Ethereum, 43% di BNB Chain, dan 98.9% di Base. Proyeksi harga: * **Skenario Bullish:** Breakout di atas $8.51 bisa mengarah ke $9.55 (EMA 200 hari) dan mendukung target $13 akhir tahun. * **Skenario Bearish:** Penolakan di garis tren bisa menarik harga kembali ke support di $8.27 (EMA 20 hari) atau bahkan $7.80 (level Supertrend). Kesimpulannya, fundamental Chainlink dengan proyeksi fee berbasis penggunaan dan klien institusional terlihat kuat. Namun,...

Prediksi harga Chainlink kini mengarah ke $200 pada tahun 2030 setelah Standard Chartered memulai cakupan $LINK, menargetkan $13 pada akhir tahun ini. $LINK saat ini diperdagangkan di level $8.41, mendorong garis tren turun yang sama yang menghentikan semua upaya pemulihan sejak Januari, sementara EMA 100-hari berada di $8.51, level yang perlu ditembus untuk mengubah semua ini menjadi terobosan teknis yang sebenarnya.

Analisis Harga Chainlink: Akankah Harga $LINK Naik?
$LINK Price Action (Sumber: TradingView)

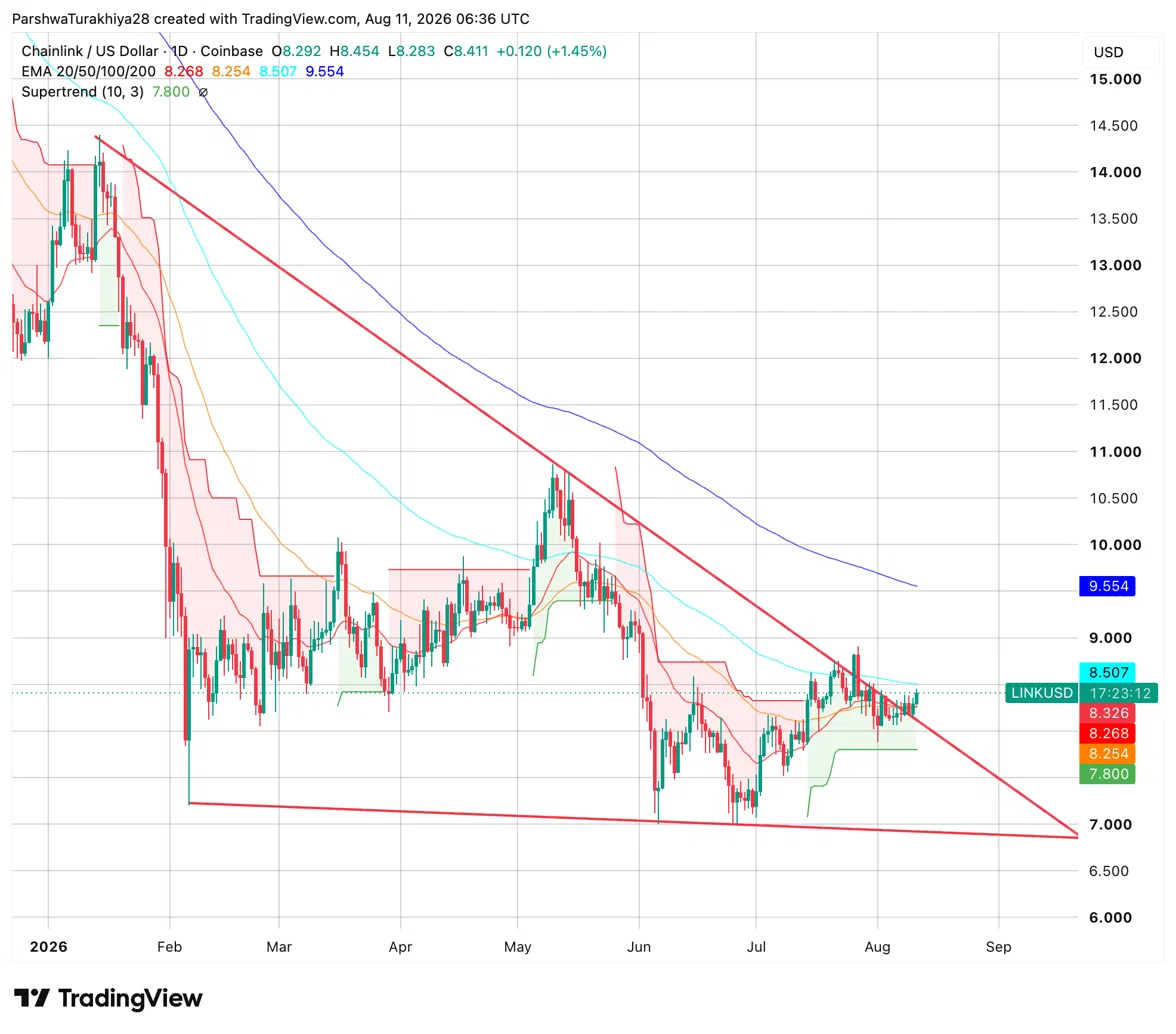
Grafik harian menunjukkan bagaimana $LINK mencapai batas atas garis tren turun yang, sejak Januari 2026, mengakhiri setiap upaya pemulihan yang signifikan. Sesi hari ini dibuka di $8.29, naik ke $8.45, dan bertahan di $8.41, untuk pertama kalinya dalam beberapa minggu secara langsung menguji garis tren. Keempat EMA terkonsentrasi erat tepat di atas harga saat ini dalam kisaran $8.25–$9.55, menciptakan zona resistensi padat yang harus ditembus saat terobosan terjadi.

EMA 20-hari di $8.27 dan EMA 50-hari di $8.25 telah direbut kembali dan kini berfungsi sebagai support pertama untuk setiap penurunan. Level 100-hari di $8.51 adalah plafon langsung di atas tren, diikuti oleh 200-hari di $9.55 sebagai target besar berikutnya. Supertrend di $7.80 tetap bullish di bawah harga, menjaga tren jangka pendek mendukung pembeli. Penutupan harian yang dikonfirmasi di atas garis tren dan EMA 100-hari di $8.51 akan menjadi terobosan teknis pertama yang signifikan untuk $LINK sepanjang tahun ini.

Level Support dan Resistance $LINK, 11 Agustus 2026

Tipe Harga Level
Resistance $8.51 EMA 100-hari, plafon terdekat
Resistance $9.55 EMA 200-hari, target besar berikutnya
Resistance $13 Target Standard Chartered akhir 2026
Support $8.27 EMA 20-hari
Support 8,25 r. EMA 50-hari
Support $7.80 Supertrend, level bullish di bawah harga

Berita Chainlink: Standard Chartered Tetapkan Target $200 pada 2030

Standard Chartered memulai cakupan Chainlink dengan target harga $200 pada akhir 2030, sekitar 25 kali lipat dari level saat ini. Jeff Kendrick, Kepala Riset Aset Digital Global bank tersebut, memetakan jalan secara bertahap: $13 pada akhir 2026, $41 pada 2027, $82 pada 2028, $133 pada 2029, dan $200 pada 2030.

Argumen utamanya sederhana. Aset tokenisasi di blockchain diperkirakan mencapai $4 triliun pada akhir 2028, sedangkan aset DeFi diproyeksikan tumbuh 37 kali lipat menjadi $2.7 triliun pada 2030. Karena Chainlink mendapatkan biaya setiap kali data ditransmisikan atau aset dipindahkan antar rantai, Kendrick memperkirakan biaya ini akan tumbuh sekitar 25 kali lipat dalam periode yang sama, dengan harga token mengikuti pertumbuhan biaya tersebut.

Daftar klien memberikan bobot. Swift, DTCC, Euroclear, JPMorgan, Mastercard, UBS, Fidelity, dan S&P Global—semuanya adalah pengguna Chainlink saat ini. Seiring munculnya lebih banyak dana dan obligasi tokenisasi di rantai, lembaga-lembaga ini akan membutuhkan lebih banyak layanan transmisi data, menjadikannya sumber pendapatan reguler yang berkembang bagi jaringan.

Dari sisi interoperabilitas, lebih dari $7 miliar nilai token telah bermigrasi dari jembatan lama ke CCIP Chainlink setelah eksploitasi $292 juta pada April, dan volume CCIP kuartalan mencapai $4,9 miliar di Q2, meningkat 353% dibandingkan tahun lalu.

Target Harga Standar Chartered untuk $LINK Target ($)
Akhir 2026 $13
Akhir 2027 $41
Akhir 2028 $82
Akhir 2029 $133
Akhir 2030 $200

Berita Chainlink: Mengamankan $33,43 Triliun dan Mendominasi Tiga dari Empat Jaringan Terbesar

Chainlink kini telah mengamankan $33.43 TRILIUN nilai transaksi.@chainlink's renowned oracles have now enabled $33.43 trillion in total transaction value.

Just four months ago, in April 2026, that figure stood at $30.06 trillion, meaning that...

... $LINK's oracles have... pic.twitter.com/OvLxyW2TMu

— BSCN (@BSCNews) August 11, 2026

Oracle Chainlink telah mengamankan total nilai transaksi senilai $33,43 triliun, meningkat dari $30,06 triliun pada April 2026, yang berarti lebih dari $3 triliun transaksi telah melewati infrastruktur Chainlink hanya dalam empat bulan. BSCNews mencatat pencapaian ini sebagai sinyal percepatan penggunaan nyata, bukan pertumbuhan spekulatif.

3 dari 4 rantai teratas didominasi oleh chainlink👇https://t.co/Cr9vFGqNfj

— bielzin (@bielzinn) August 11, 2026

Sementara itu, analis Bielzin membagikan data pangsa pasar oracle di rantai top X. Chainlink mengamankan 49,16% nilai bergantung oracle di Ethereum, 43,02% di $BNB Chain, dan 98,91% di Base. Solana adalah pengecualian, di mana Pyth Network menguasai 46,23%. Tiga dari empat rantai teratas secara efektif didominasi Chainlink, yang merupakan argumen infrastruktur yang mendasari model valuasi berbasis biaya Standard Chartered.

Rantai Oracle Terdepan Pangsa Pasar
Ethereum Chainlink 49.16%
Jaringan $BNB Chainlink 43.02%
Base Chainlink 98.91%
Solana Jaringan Pyth 46.23%

$LINK Prediksi Harga: Target Kenaikan dan Penurunan

Skenario Bullish, Target: $9.55 (EMA 200-hari)

$LINK ditutup di atas garis tren turun dan EMA 100-hari di $8.51 secara harian, mengonfirmasi terobosan teknis pertama yang signifikan pada 2026. Target Standard Chartered $13 pada akhir tahun menarik perhatian institusional baru seiring dengan tonggak TVS $33,43 triliun, dan pertumbuhan volume CCIP yang berkelanjutan dengan kecepatan saat ini menambahkan katalis pendapatan. Dengan menjaga tren bullish, momentum menuju EMA 200-hari di $9,55 sebagai pemberhentian berikutnya, selaras dengan target akhir tahun $13 yang menyiratkan potensi kenaikan lebih lanjut.

Risiko Bearish, Level Risiko: $7.80 (Supertrend)

Garis tren turun menolak harga lagi, dan $LINK kehilangan EMA 20-hari di $8.27 pada penutupan harian. Liputan Standard Chartered membawa kelanjutan harga yang lebih sedikit dibandingkan UNI pada Juni, dan cluster EMA yang padat di atas terbukti terlalu berat untuk ditembus tanpa katalis altcoin yang lebih luas. Harga mundur ke supertrend di $7.80 dan berisiko menguji batas bawah garis tren sekitar $7.00 jika level ini runtuh.

Kesimpulan

Skema $LINK tidak biasa karena rencana fundamental—target $200 dengan klien nyata yang membawa biaya seperti Swift dan JPMorgan—mungkin sekarang lebih kuat daripada aspek teknisnya. Grafik masih harus memainkan perannya: penutupan harian di atas garis tren dan EMA 100-hari di $8.51 akan menjadi konfirmasi nyata pertama dari terobosan tahun ini.

Sampai itu terjadi, target bertahap Standard Chartered dan nilai aman $33,43 triliun adalah latar belakang fundamental, bukan bukti awal pergerakan. Tembus $8.51 dan $9.55, dan target-target itu masuk dalam jangkauan; kehilangan $7.80, dan $LINK kemungkinan menghabiskan lebih banyak waktu menguji batas bawah kisaran sebelum semuanya terwujud.


FAQ: Prediksi Harga Chainlink

end-content

Trending Cryptos

Related Questions

QApa saja target harga Chainlink yang ditetapkan oleh Standard Chartered hingga tahun 2030?

AStandard Chartered menetapkan target harga Chainlink (LINK) bertahap: $13 pada akhir 2026, $41 pada akhir 2027, $82 pada akhir 2028, $133 pada akhir 2029, dan $200 pada akhir 2030.

QPada level harga berapa, menurut analisis teknis, LINK dapat dikonfirmasi mengalami terobosan teknis yang signifikan?

AMenurut analisis teknis dalam artikel, konfirmasi terobosan teknis signifikan pertama untuk LINK pada tahun 2026 adalah jika harga dapat ditutup di atas garis tren turun dan EMA 100-hari pada level $8,51.

QApa alasan utama Standard Chartered sangat optimis dengan prospek Chainlink hingga mencapai target $200?

AAlasan utama Standard Chartered optimis adalah proyeksi pertumbuhan besar dalam aset tokenisasi (mencapai $4 triliun) dan aset DeFi (mencapai $2,7 triliun). Chainlink akan mendapatkan biaya dari setiap transfer data atau perpindahan aset lintas chain, yang diperkirakan akan tumbuh sekitar 25 kali lipat, dengan harga token mengikuti pertumbuhan biaya tersebut. Dukungan dari klien besar seperti SWIFT, JPMorgan, dan DTCC juga menjadi faktor pendorong.

QBerapa total nilai transaksi yang telah diamankan oleh orakel Chainlink dan di rantai mana mereka mendominasi?

AOrakel Chainlink telah mengamankan total nilai transaksi sebesar $33,43 triliun. Mereka mendominasi di tiga dari empat rantai teratas: Ethereum (49,16% share), BNB Chain (43,02% share), dan Base (98,91% share). Satu-satunya pengecualian adalah Solana, di mana Pyth Network mendominasi.

QApa skenario bullish dan bearish untuk pergerakan harga LINK dalam jangka pendek berdasarkan artikel?

ASkenario Bullish: Jika LINK berhasil menutup di atas $8,51 (garis tren turun & EMA 100-hari), target berikutnya adalah EMA 200-hari di $9,55, menuju target akhir tahun $13. Skenario Bearish: Jika harga ditolak oleh garis tren turun dan jatuh di bawah EMA 20-hari ($8,27), risiko penurunan menuju level SuperTrend di $7,80, dan berpotensi menguji batas bawah tren sekitar $7,00.

Related Reads

Elon Musk Building Terafab: The Largest Chip Factory for AI, Robots, and Space Data Centers

Elon Musk's SpaceX and Tesla have launched the Terafab project to build a massive semiconductor facility in Grimes County, Texas. The plant, exceeding 9.3 million square meters, aims to integrate logic chip manufacturing, memory production, advanced packaging, and testing. The initial phase requires $16.8 billion in capital investment, with a long-term goal of producing over 1 terawatt of computing power annually. This capacity will support Tesla's Optimus robots and Cybercab autonomous vehicles, as well as SpaceX's orbital data centers. Texas Governor Greg Abbott confirmed the project's start in August 2026, highlighting 3,000 new jobs and a $30 million state grant. Elon Musk emphasized the strategic advantage of combining logic, memory, and packaging under one roof. Musk called the future complex the "largest and most valuable building on Earth," with an area roughly 50 times that of the Pentagon. Intel is the key technology partner, with plans to use its 14A process node for chip production. This partnership aims to diversify supply chains currently dominated by TSMC. The project aligns with the U.S. Pax Silica initiative to secure semiconductor supply chains. An AI analysis notes the project's scale and potential challenges, comparing it to delays seen in other U.S. megafab projects like Intel's Ohio facility. It questions whether Terafab can avoid similar pitfalls related to timelines, budgets, workforce, and supply chain stability. The facility's success could significantly shift the global semiconductor balance and strengthen the U.S. position in the tech race.

cryptonews.ru6m ago

Elon Musk Building Terafab: The Largest Chip Factory for AI, Robots, and Space Data Centers

cryptonews.ru6m ago

Elon Musk is Building Terafab: The Largest Chip Plant for AI, Robots, and Space Data Centers

Elon Musk's SpaceX and Tesla have launched the massive Terafab project to build a semiconductor plant in Grimes County, Texas. Spanning over 9.3 million square meters, the facility will integrate logic chip and memory production, advanced packaging, and testing. The initial phase requires $16.8 billion in capital investment, with a long-term goal of producing over 1 terawatt of computing power annually. This output is intended to supply Tesla's Optimus robots and Cybercab autonomous vehicles, as well as SpaceX's orbital data centers. Texas Governor Greg Abbott confirmed the project's start on August 6, 2026, highlighting the creation of 3,000 jobs and a $30 million grant from the Texas Enterprise Fund. Musk emphasized the strategic advantage of combining chip design, memory production, and packaging under one roof to accelerate hardware development. He stated the fully built complex would be "the largest and most valuable building on Earth," about 50 times larger than the Pentagon. An estimated 25% of production is earmarked for Tesla's robotics, with 75% for SpaceX's space-based AI systems. Earlier tax documents suggested a total project cost of up to $119 billion, but this has not been officially confirmed. Intel is the key technology partner, with plans to use its 14A process node for chip manufacturing. This partnership aims to diversify supply chains and reduce dependence on dominant foundries like TSMC. The initiative aligns with the broader U.S. Pax Silica program, which seeks to build secure international semiconductor supply chains with allied nations. An AI-driven analysis notes that megafab projects, such as Intel's delayed Ohio facility, often face schedule and budget overruns. While Terafab represents a significant step toward U.S. semiconductor self-sufficiency and could shift the global tech balance, its success will depend on factors like skilled labor availability, energy supply, and supply chain stability. The final outcome may not be clear until the late 2030s.

cryptonews.ru21m ago

Elon Musk is Building Terafab: The Largest Chip Plant for AI, Robots, and Space Data Centers

cryptonews.ru21m ago

"AI God of Stocks" Blowup Dragged Down, Jane Street Suffered Massive 15 Billion Loss in July, First Monthly Loss in a Decade

Jane Street, a major proprietary trading firm, suffered an estimated $15 billion loss in July, marking its first monthly loss in about a decade. The loss was primarily triggered by the blow-up of the AI-focused hedge fund Situational Awareness, which faced massive margin calls amid a sharp sell-off in AI and semiconductor stocks in July. Jane Street, an investor in the fund, was significantly impacted. Compounding the loss were substantial declines in Jane Street's own Asian non-AI equity long positions, which had performed well earlier in the year. The firm described the losses as a concentrated reversal of previously successful trading strategies in AI and tech sectors. Despite the historic monthly loss, Jane Street's net trading income for the year to date remains strong at over $40 billion. In response, the firm stated it has become more selective in risk-taking, closing specific losing exposures and reducing risk in other strategies. Coinciding with the loss, Jane Street is undergoing a major debt refinancing of approximately $14.6 billion, led by JPMorgan. The move aims to shift more debt from public markets to private investors like Pimco and Fidelity, accepting higher costs for greater flexibility and less public disclosure. The Situational Awareness incident highlights systemic risks in the prime brokerage ecosystem, where leveraged bets on crowded AI trades can lead to forced liquidations and market volatility. Jane Street's subsequent risk reduction and debt restructuring are seen as key responses to this costly lesson.

marsbit26m ago

"AI God of Stocks" Blowup Dragged Down, Jane Street Suffered Massive 15 Billion Loss in July, First Monthly Loss in a Decade

marsbit26m ago

QCP Capital Analysts Explained Why Bitcoin Stalled at $63,000

QCP Capital's latest report explains that Bitcoin has stalled around $63,000, testing the lower boundary of its recent trading range ($62,500–$64,000). The retreat wasn't due to a single catalyst but stems from several cross-market pressures: heightened geopolitical risks, rising oil prices, uncertainty around global liquidity, and a muted reaction to positive U.S. macroeconomic data. While U.S. inflation and jobs data softened, reducing expectations of imminent Fed tightening, Bitcoin's price response has been subdued. This highlights the importance of other factors like trader positioning, liquidity conditions, and overall risk appetite. The regulatory landscape is progressing on two tracks: congressional legislation (like the CLARITY Act) is delayed, but SEC rulemaking continues. Corporate treasury activity, exemplified by Strategy's new Bitcoin monetization program, now creates a potential two-way flow, adding complexity to supply dynamics. Geopolitical tensions around the Strait of Hormuz keep oil prices elevated, impacting crypto indirectly through inflation expectations and financial conditions. Historical seasonality shows August and September are typically weak for Bitcoin, but this is descriptive, not predictive, in today's ETF-driven market. In conclusion, Bitcoin has shown resilience by absorbing multiple negative forces without a decisive breakdown. However, it has failed to convert improving macro fundamentals into sustained upward momentum. The market awaits key events like the U.S. PCE data, the Jackson Hole symposium, and the September FOMC meeting for a potential catalyst to break the current range.

cryptonews.ru55m ago

QCP Capital Analysts Explained Why Bitcoin Stalled at $63,000

cryptonews.ru55m ago

Trading

Spot

Hot Articles

How to Buy LINK

Welcome to HTX.com! We've made purchasing ChainLink (LINK) simple and convenient. Follow our step-by-step guide to embark on your crypto journey.Step 1: Create Your HTX AccountUse your email or phone number to sign up for a free account on HTX. Experience a hassle-free registration journey and unlock all features.Get My AccountStep 2: Go to Buy Crypto and Choose Your Payment MethodCredit/Debit Card: Use your Visa or Mastercard to buy ChainLink (LINK) instantly.Balance: Use funds from your HTX account balance to trade seamlessly.Third Parties: We've added popular payment methods such as Google Pay and Apple Pay to enhance convenience.P2P: Trade directly with other users on HTX.Over-the-Counter (OTC): We offer tailor-made services and competitive exchange rates for traders.Step 3: Store Your ChainLink (LINK)After purchasing your ChainLink (LINK), store it in your HTX account. Alternatively, you can send it elsewhere via blockchain transfer or use it to trade other cryptocurrencies.Step 4: Trade ChainLink (LINK)Easily trade ChainLink (LINK) on HTX's spot market. Simply access your account, select your trading pair, execute your trades, and monitor in real-time. We offer a user-friendly experience for both beginners and seasoned traders.

10.3k Total ViewsPublished 2024.03.29Updated 2026.06.02

How to Buy LINK

Discussions

Welcome to the HTX Community. Here, you can stay informed about the latest platform developments and gain access to professional market insights. Users' opinions on the price of LINK (LINK) are presented below.

活动图片