Author: Ma He, Foresight News
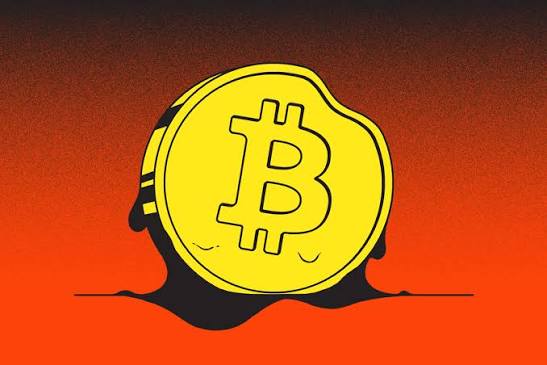
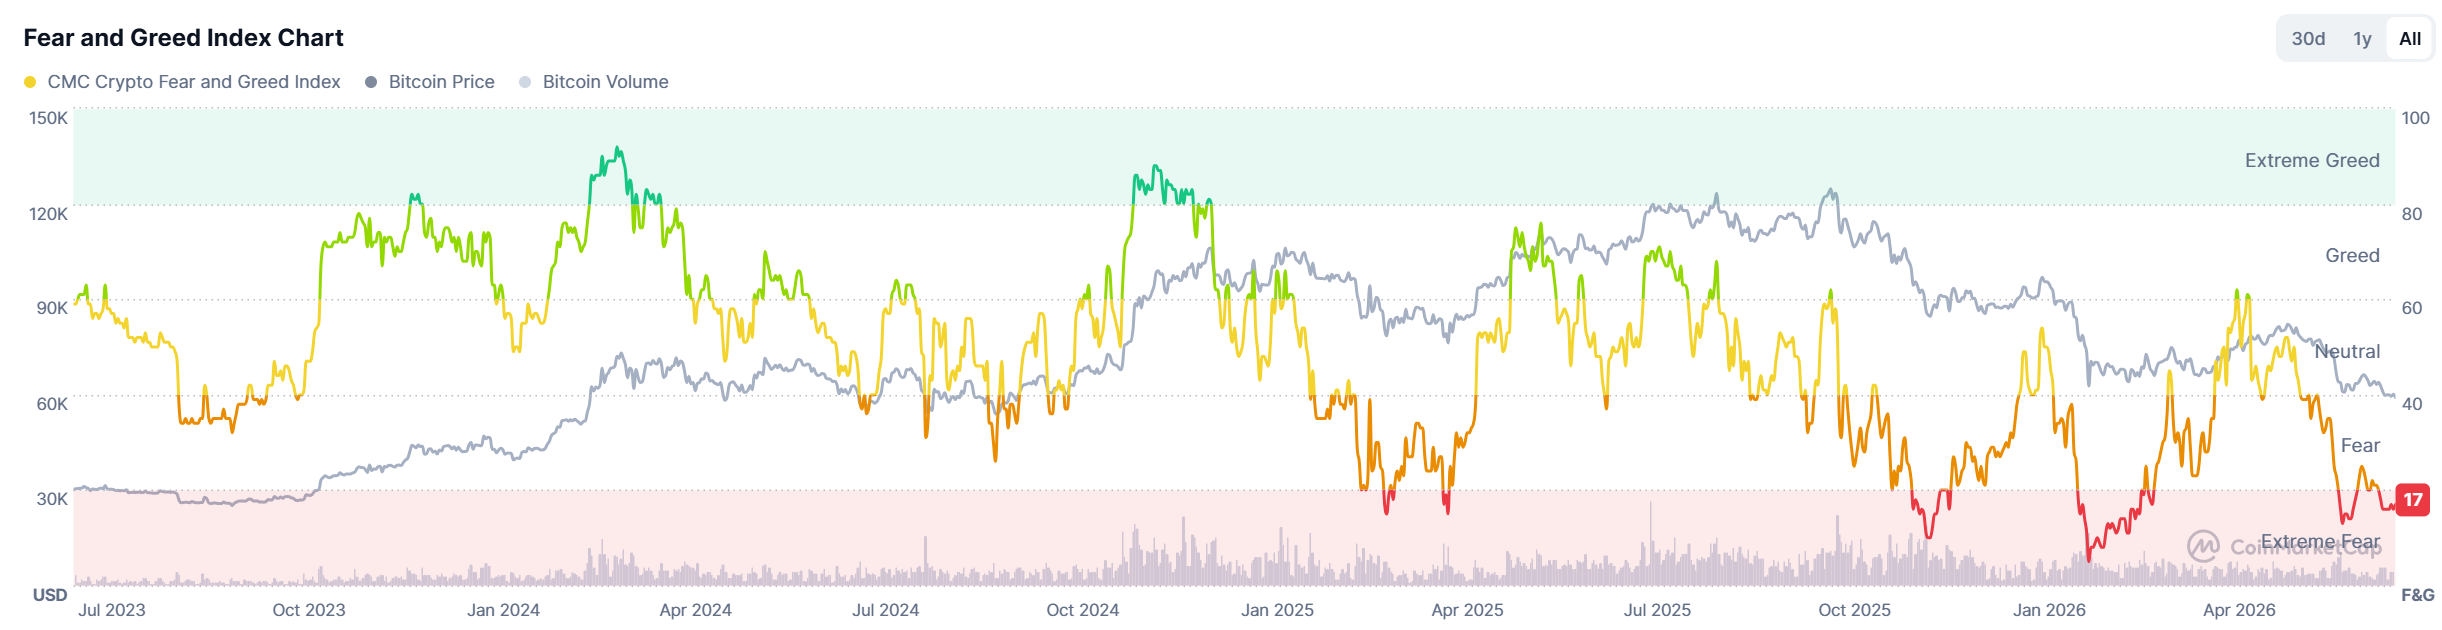
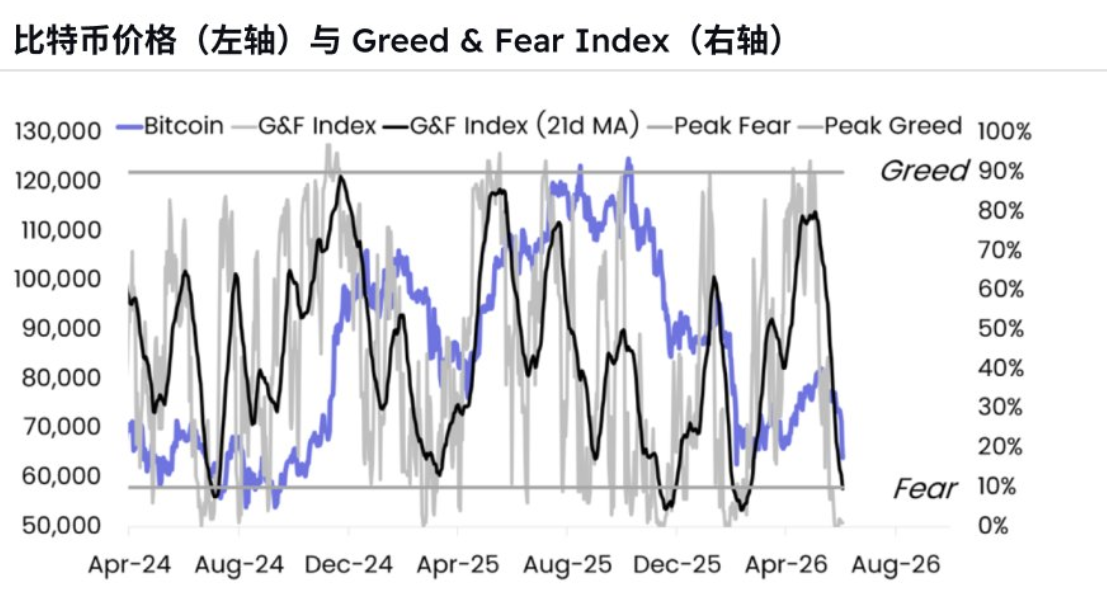
On July 1, the price of BTC once fell to $57,800, marking a cumulative decline of over 50% from its historical high of approximately $126,000, and also hitting its lowest level since October 2024. Meanwhile, ETH continues to hover around the low of $1,600, and SOL has recorded a rare 10 consecutive monthly declines on its monthly chart. The current market fear and greed index stands at 17, indicating extreme fear.
In terms of the broader macro market, the Nasdaq is still fluctuating at a high level of 26,200, and the S&P 500 remains at a high level of 7,500. Since October 2025, Bitcoin has been in a correction for nearly a year. Why has BTC performed so poorly? Perhaps it is facing two major headwinds: significant net outflows from spot ETFs and unmet expectations for interest rate cuts.
From mid-May to June 2026, Bitcoin spot ETFs experienced an unprecedented wave of capital outflows. Since May 1, Bitcoin spot ETFs have unusually recorded only 9 days of net inflows, with the amounts generally being small. No single day's net inflow has exceeded $140 million since early May. In terms of net outflows, however, there were 4 days with net outflows exceeding $600 million in a single day since May, along with consecutive days of significant net outflows.
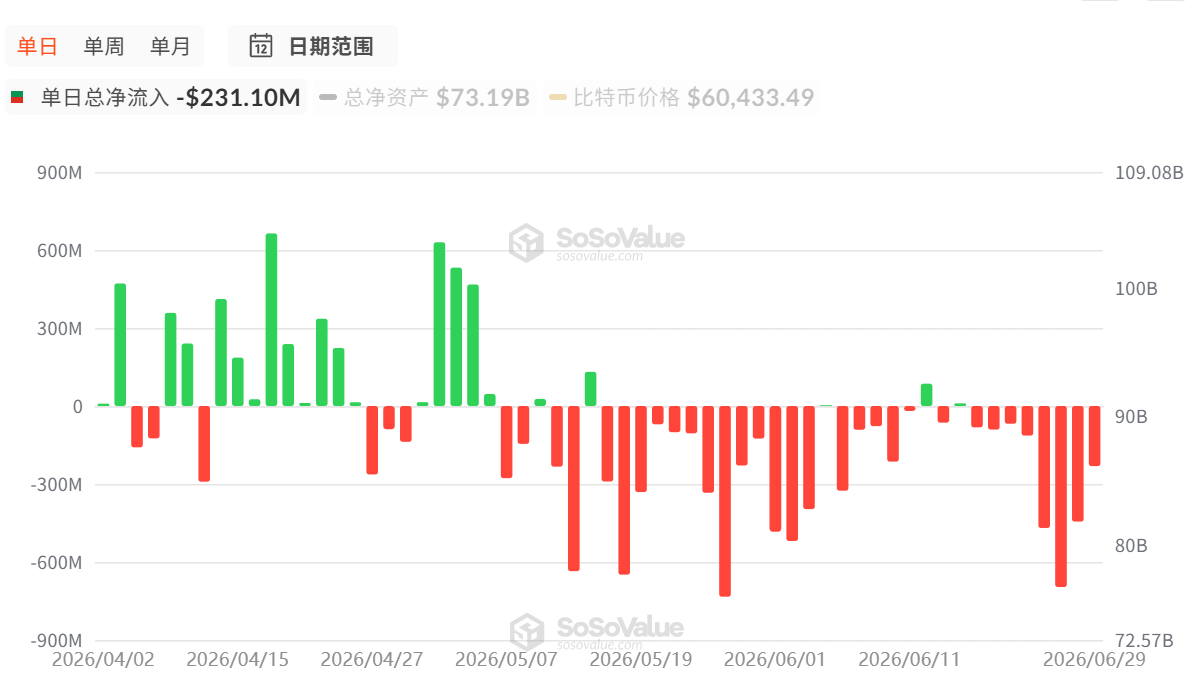
It is evident that a large number of institutions and retail investors are reducing their Bitcoin holdings through the ETF channel, further amplifying selling pressure in the spot market and making it difficult for prices to hold key support levels. Compared to the peak inflow period in 2025, this structural reversal in capital flows has become the most direct reason for the current BTC adjustment.
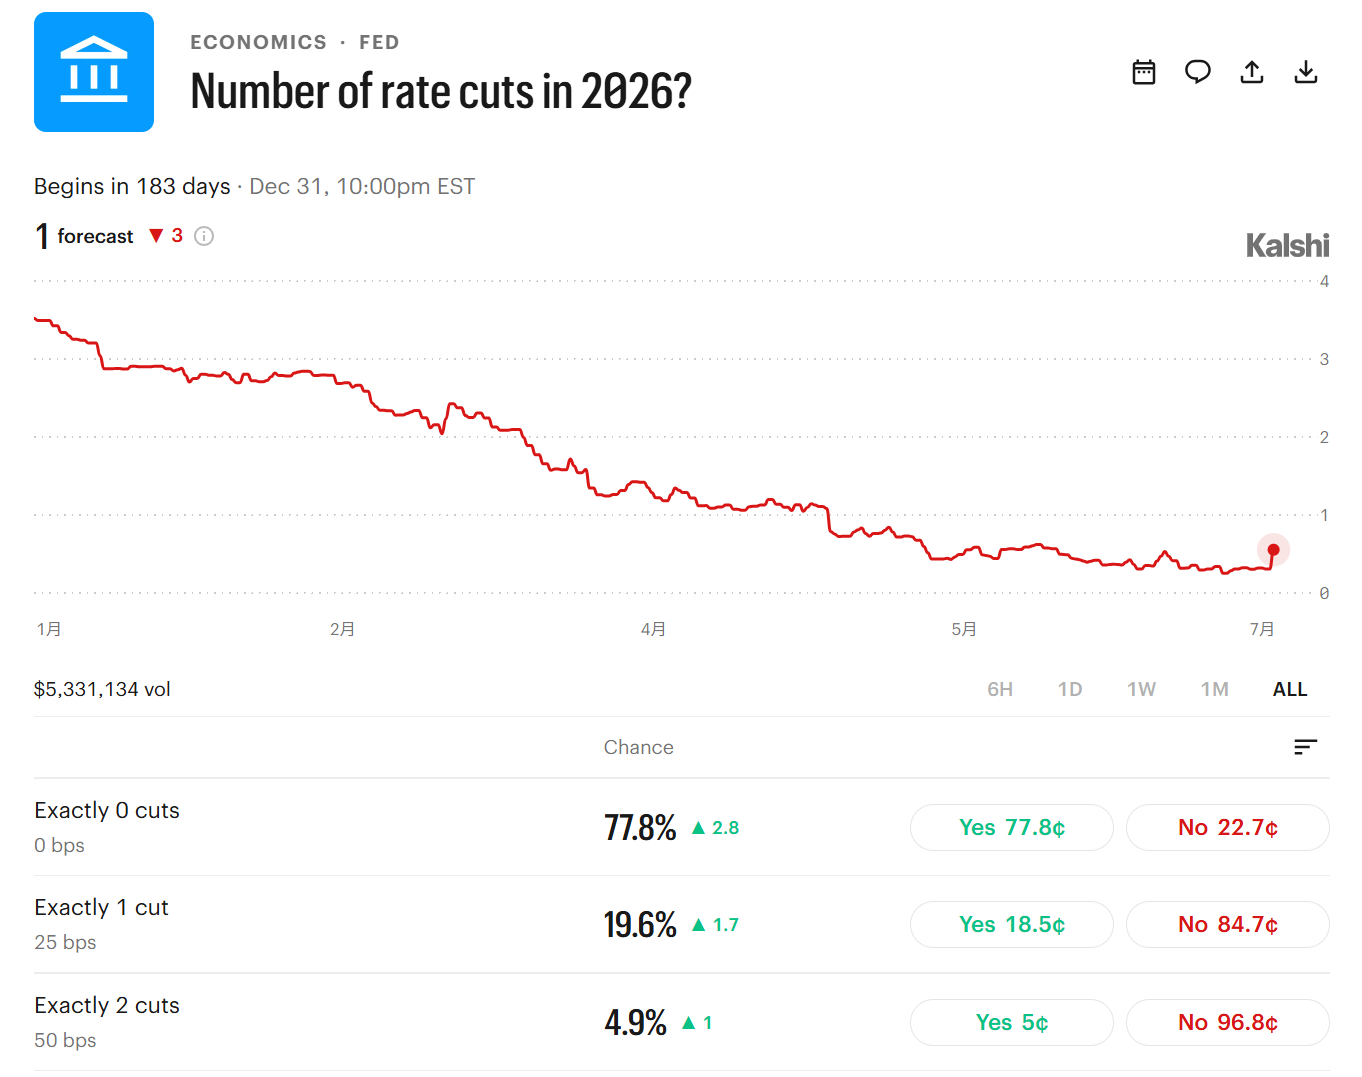
Expectations for Federal Reserve interest rate cuts have also been dashed. According to Kalshi data, the market currently places a 77.8% probability on the Fed keeping rates unchanged this year, with only a 19.6% probability of one rate cut (25 basis points).
Amid persistent inflationary pressures and geopolitical disruptions, market expectations are heating up for the Fed to maintain high interest rates or even raise them further. The high real yield environment has significantly increased the attractiveness of holding cash or bonds, putting high-risk assets like Bitcoin in competition for capital.
The 10-year U.S. Treasury yield is hovering in a high range, coupled with macroeconomic uncertainty, further suppressing leveraged funds and risk appetite. Investors worry that if the Fed delays rate cuts or adopts a hawkish policy shift, it will prolong the adjustment cycle for risk assets.
Where is BTC's Bottom Range Exactly?
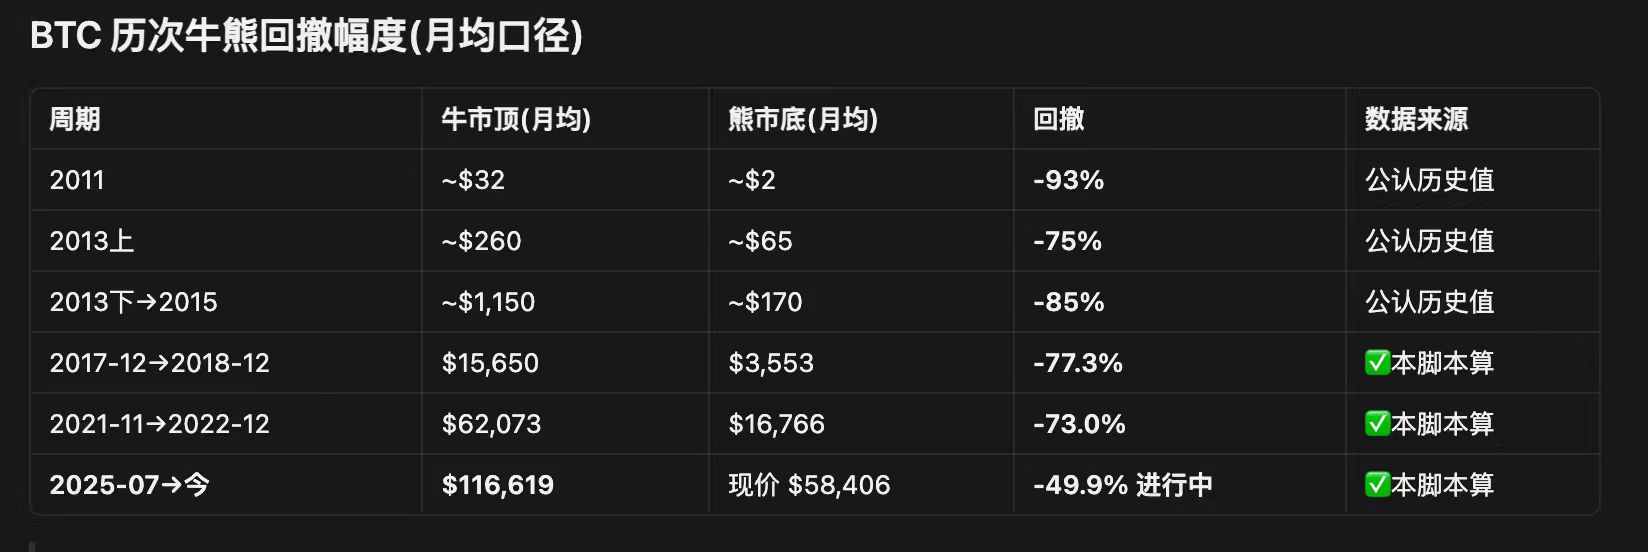
As BTC continues to fall, the market is beginning to predict its bottom price. In the 2018 Bitcoin bear market, the bottom price (monthly average) fell approximately 77% from the top (monthly average). In 2022, the bear market bottom price retraced about 73% from the top. Assuming BTC retraces 60% from $116,600 in this cycle, the bottom could potentially fall to around $46,000.
Glassnode Co-founder: This Cycle's BTC Bottom Likely Around $46,000 to $54,000 Range
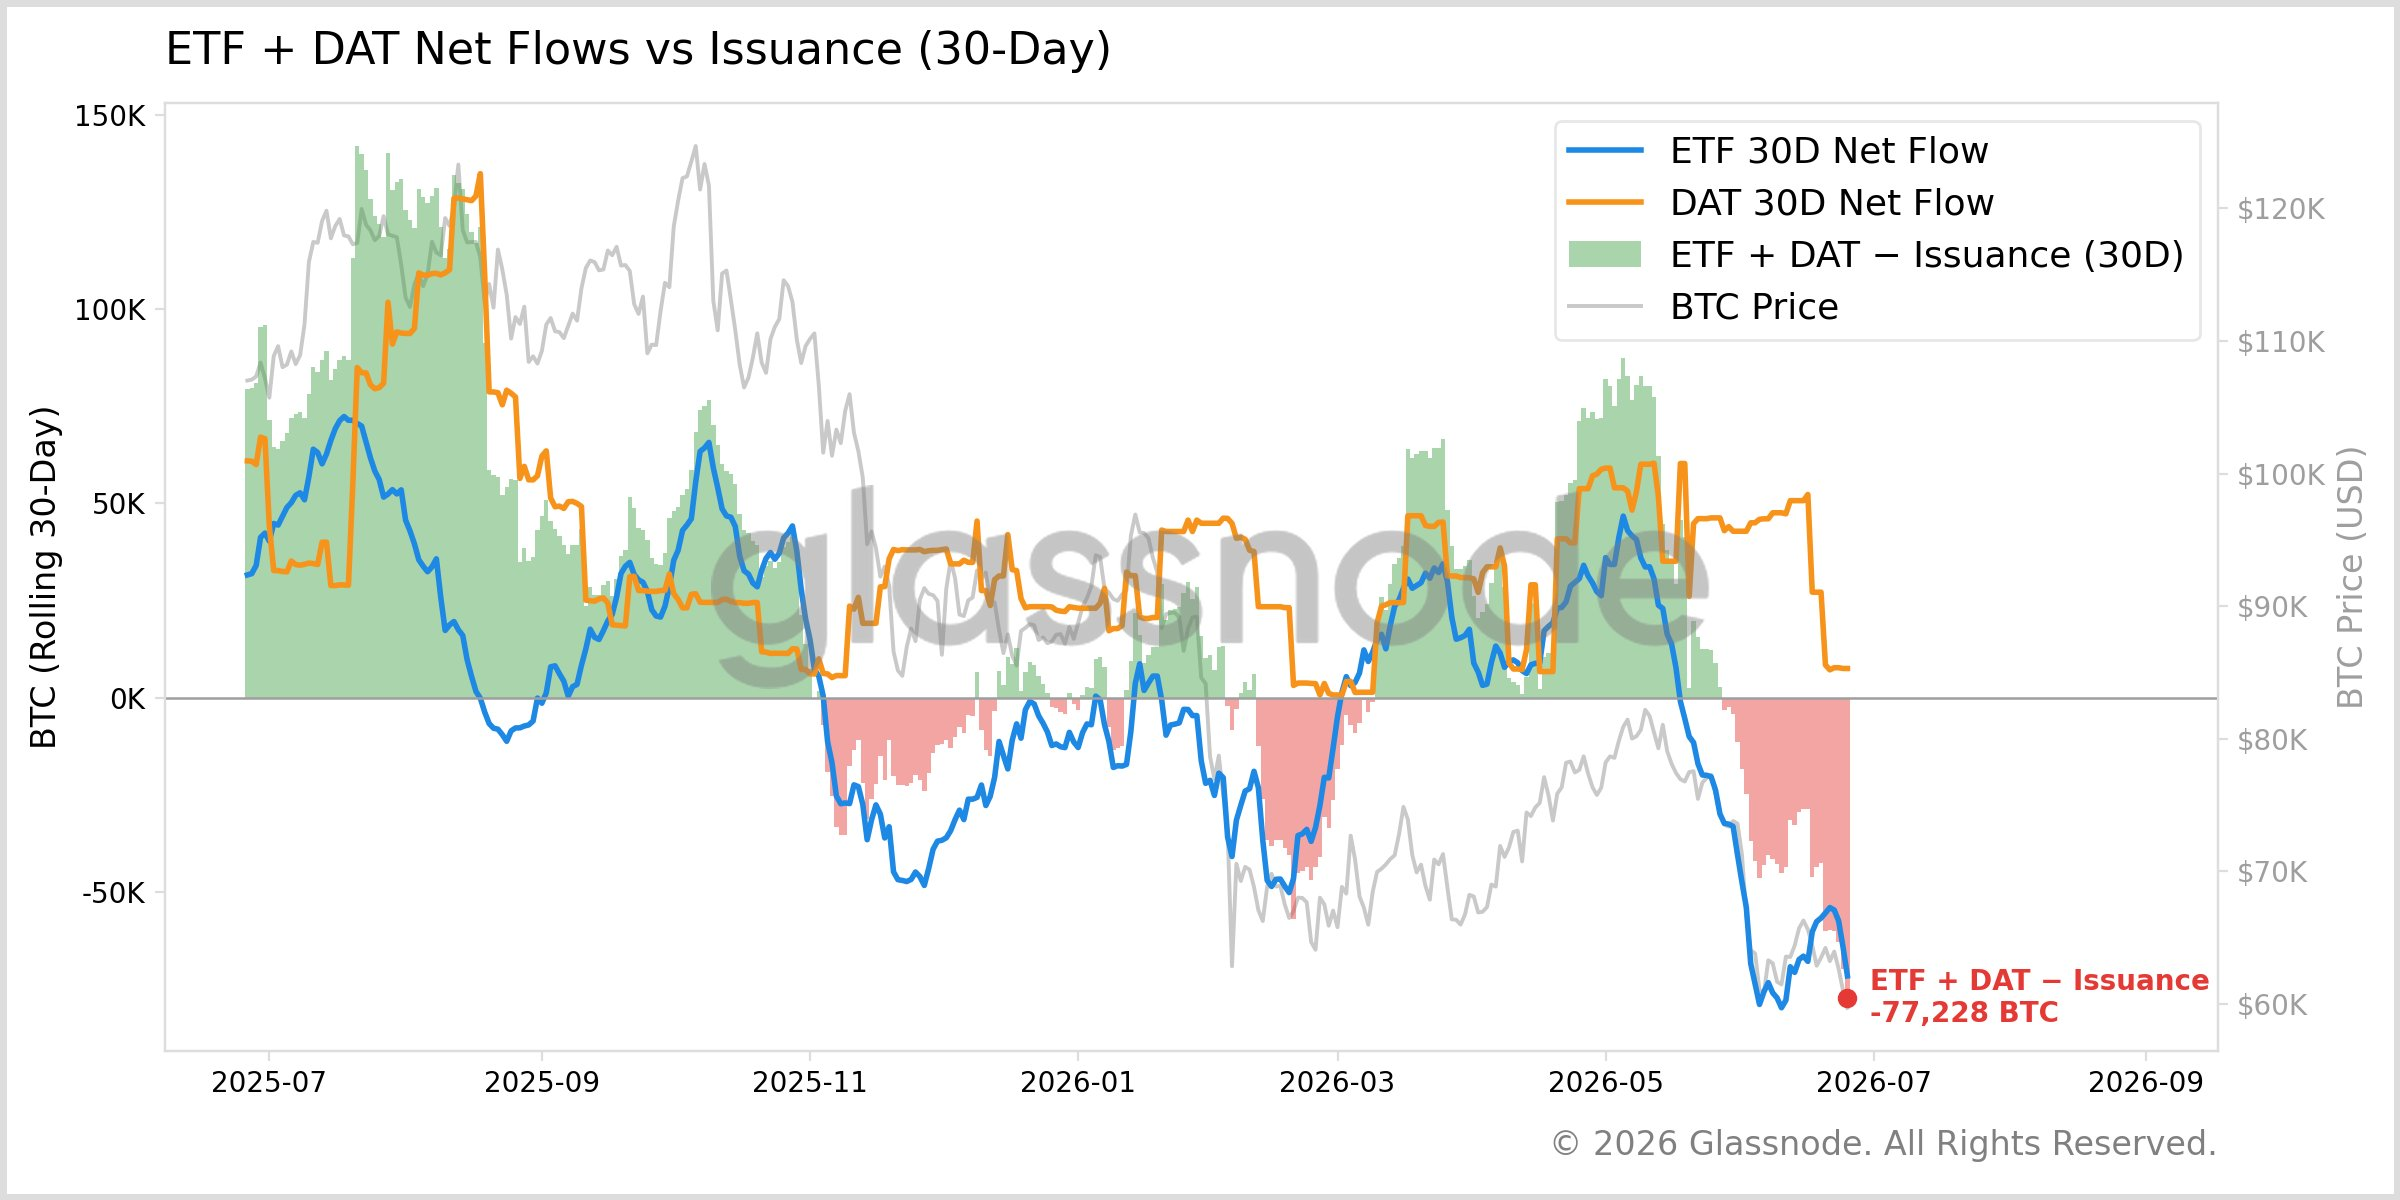
Glassnode co-founder Rafael posted on X, stating that current institutional demand is not effectively absorbing the new supply of Bitcoin but is instead increasing selling pressure. Data shows that ETFs have seen a net outflow of 71,600 BTC over the past month, while Digital Asset Treasury companies only added 7,500 BTC. After deducting issuance, the combined net outflow from ETFs and DATs reached 77,000 BTC. Until this net outflow turns positive, any price rebound will face continuous selling pressure.
Rafael pointed out on June 5th (when BTC price was around $62,000) that the bottom for this cycle's BTC is likely in the range of $46,000 to $54,000.
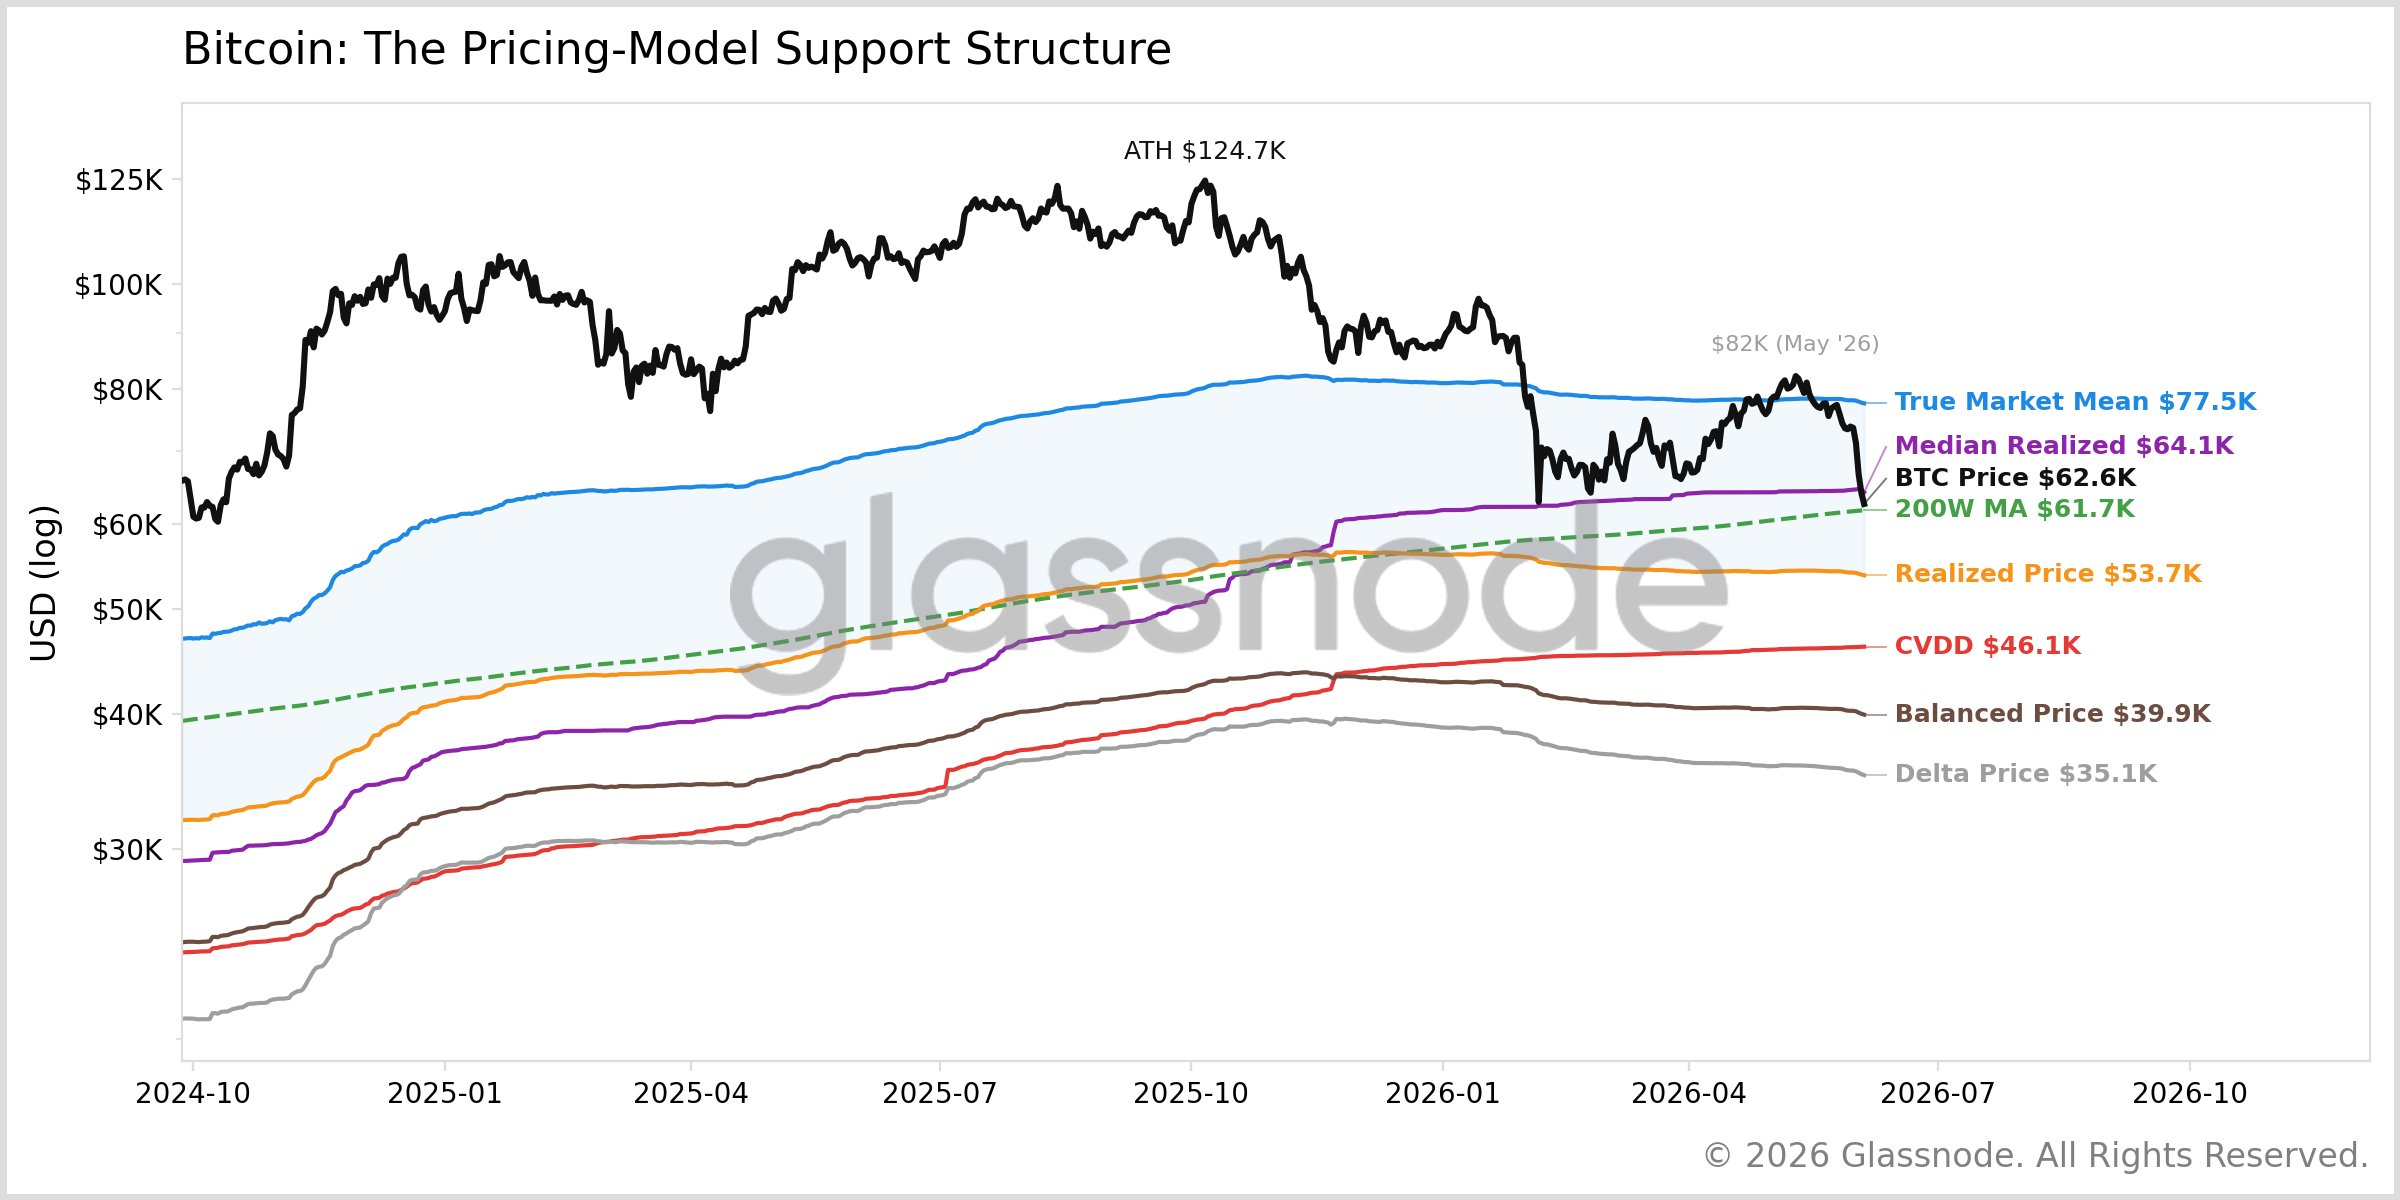
This range is primarily based on two key on-chain indicators:
Realized Price ≈ $54,000, serving as a crucial support level representing the market's overall cost basis.
Cycle Value Day Destroyed (CVDD) ≈ $46,200, where historical lows often form within 5%-18% above this level.
BIT: Bear Market Enters Final Stage, $50k~$55k May Become Key Range
In mid-June, BIT published an article stating that from a technical structure perspective, the top formation in 2025 highly resembles that of 2021. Both cycles experienced rapid surges, breaking below the 21-week moving average, followed by a staged rebound before turning weak again. Historical experience suggests that true bottoms are often accompanied by declining volume and narrowing consolidation ranges, rather than rapid reversals. Currently, the Fear and Greed Index is at historically low levels, and the stochastic indicator is in deeply oversold territory.
Combined with Elliott Wave Theory, Bitcoin has entered a typical A-B-C correction structure since the bear market began in October 2025. As the B-wave rally ended after rising to $83,000 in mid-May, the current C-wave decline is unfolding, potentially targeting the $50,000 area. The low point is expected to appear around the period of the FIFA World Cup (June 11 to July 19, 2026). Overall, this bear market is nearing its end, and the $50,000–$55,000 range may become the core bottom area for this cycle.
Wintermute: Crypto Market Has Entered Late Bear Market Phase, But True Bottom May Not Have Arrived Yet
Wintermute recently released a report suggesting that current market sentiment has entered an extreme fear range, with the Fear and Greed Index remaining between 18 and 24. Approximately half of Bitcoin's circulating supply is in a state of unrealized loss, both characteristics approaching historical bear market bottoms. However, the report points out that what is currently lacking is a renewed inflow of funds. Spot ETFs have seen net outflows of about $1.8 billion recently, and stablecoin and other liquidity indicators have yet to show improvement. The report also notes that Bitcoin reserve companies are beginning to retain the right to sell BTC to pay dividends, implying that the long-standing "permanent buy-side" in the market is gradually turning into a "conditional buy-side."
Wintermute expects that, influenced by historical seasonal patterns, the crypto market is unlikely to complete its bottoming process during the summer. A true bottom is more likely to arrive around September to October. Subsequent trends will still depend on the macro environment, the cooling of the AI sector, and the return of capital flows to the crypto market.
JackYi: July to August May Be Bitcoin's Final Bottoming Time, Also the Best Time to Buy the Dip
Liquid Capital founder JackYi posted on X, stating, "This is the third wave of decline since October 11. According to wave theory and cycle patterns, this should be the last major drop for Bitcoin. What everyone cares most about is the bottom price this time for Bitcoin, with the main factors being U.S. stocks and MicroStrategy. It's unclear whether the Fed's concerns about CPI will trigger changes in rate cut or even rate hike expectations, leading to a sustained correction in U.S. stocks. Secondly, past bear market tails often witness black swan events or explosions; we haven't seen that yet and need to observe closely. Calculating from Bitcoin's peak of $126k, a 60% drop would be $51k, and a 66% drop would be $43k. Regardless, July to August should be the final period and also the best time to buy the dip, potentially the most opportune operation for the next three years."
Jiang Zhuo'er: This Cycle's BTC Bear Market May Bottom Between October and December This Year, Price Around $42k to $44k
BTC.TOP founder and CEO Jiang Zhuo'er (Jiang Zhuo'er) posted on X on June 25th, stating that MSTR's mNAV has now fallen to 0.72, close to the historical low of 0.7 from May 2022, placing it in the trough region of this cycle's mNAV. However, mNAV bottoming typically leads BTC price bottoming by about 6 months. In the last cycle, the mNAV low corresponded to BTC around $31,000, while BTC's true bottom appeared at $15,500 in November 2022. Based on the four-year cycle and mathematical models, he predicts this cycle's BTC bear market will bottom between October and December this year, with a price range of approximately $42,000 to $44,000.
Polymarket Data: 30% Probability BTC Falls Below $40k This Year
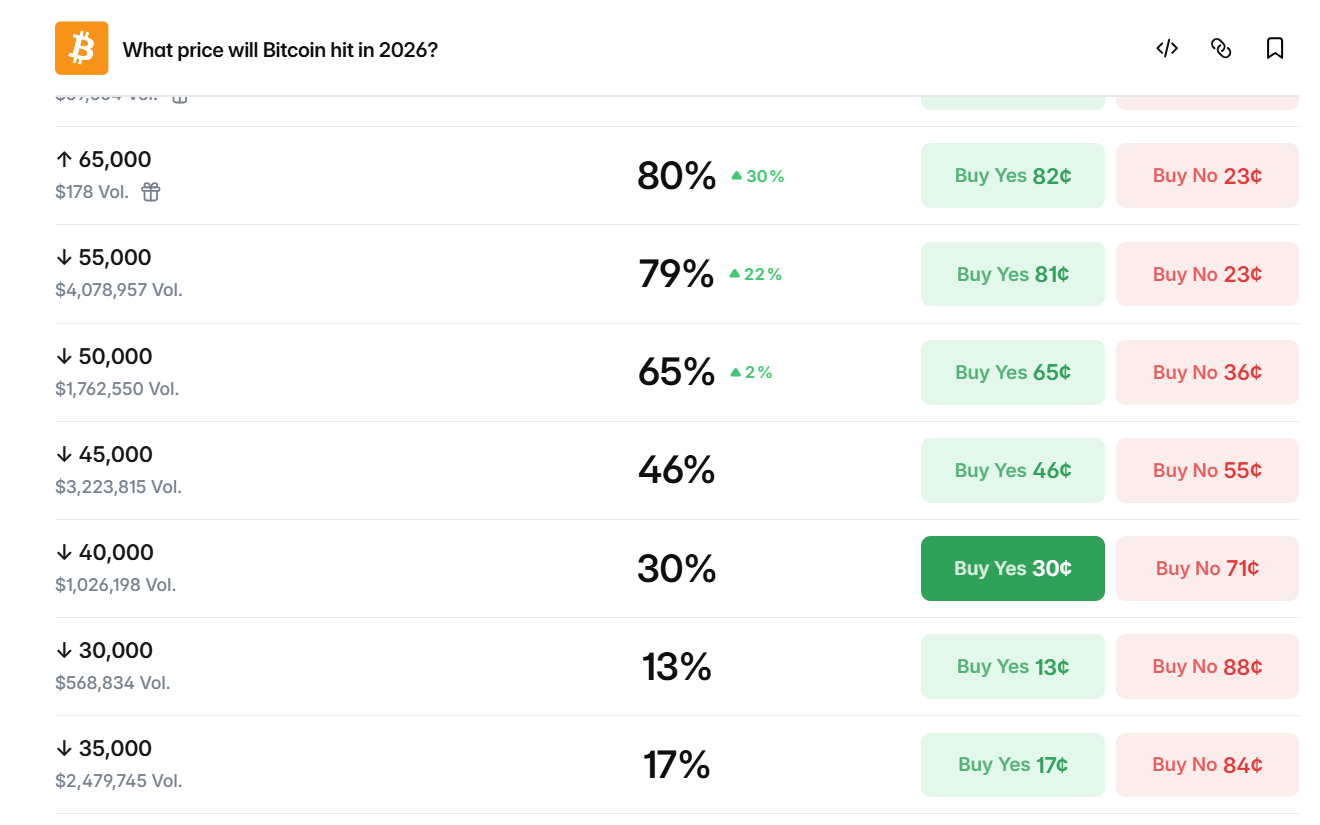
Latest Polymarket data shows the market currently places a 79% probability on BTC falling below $55k this year, a 65% probability on falling below $50k, a 30% probability on falling below $40k, a 17% probability on falling below $35k, and a 13% probability on falling below $30k. The trading volume on this prediction market has now exceeded $45.42 million.