Le Bitcoin est-il au plus bas ? Décryptage de 12 indicateurs de données clés

marsbitPublished on 2026-06-30Last updated on 2026-06-30

Abstract

L’auteur analyse si le Bitcoin a atteint son creux de cycle en examinant 12 indicateurs clés. Le BTC, à environ 59 600 $, a connu une correction de ~53% depuis son pic de 2025. Plusieurs signaux suggèrent une valorisation proche des bas historiques : l’indice Peur et Cupidité est à 16 (panique extrême), le prix est dans la zone « Bitcoin is dead » du Rainbow Chart, et le ratio MVRV (~1,13) est bas. Le prix actuel ne dépasse que d’environ 12% le prix réalisé (~53 400 $), seuil critique des coûts moyens des détenteurs. Les indicateurs on-chain montrent des signes de capitulation : le ratio UTXO en perte atteint un plus bas, les détenteurs de long terme (SOPR à 0,662) vendent à perte, et ~20% des mineurs sont en difficulté avec des revenus en baisse. Les ETF américains ont enregistré des sorties nettes importantes (13 jours consécutifs de sorties), et le marché dérivé (Polymarket) estime à ~80% la probabilité d’une chute sous 55 000 $. Bien que de nombreux indicateurs soient dans des zones historiquement attractives, la fin de la correction n’est pas encore confirmée. Le prix doit encore franchir durablement le prix réalisé, et la demande des ETF doit se retourner. La zone sous 60 000 $ offre un intérêt à long terme, mais la prudence reste de mise. Il convient de surveiller le retour des flux positifs vers les ETF, l’amélioration du SOPR des détenteurs de long terme et la réduction de la pression sur les mineurs.

Auteur : BitalkNews

12 indicateurs de données du Bitcoin, vous indiquent-ils si le Bitcoin a touché le fond ?

Le prix actuel du BTC est d'environ 59 600 $, avec un retracement maximal d'environ 53 % par rapport au sommet de 2025. Le marché est entré dans une phase d'ajustement profonde, de nombreux indicateurs montrant des valorisations proches des niveaux historiquement bas, mais la confirmation du fond nécessitera encore du temps.

Indicateur un : Indice de Peur et Cupidité

Lecture actuelle à 16, entrée dans la zone de "peur extrême". Le dernier niveau similaire est apparu durant l'événement FTX en 2022, le sentiment de marché approchant d'un pessimisme historique extrême.

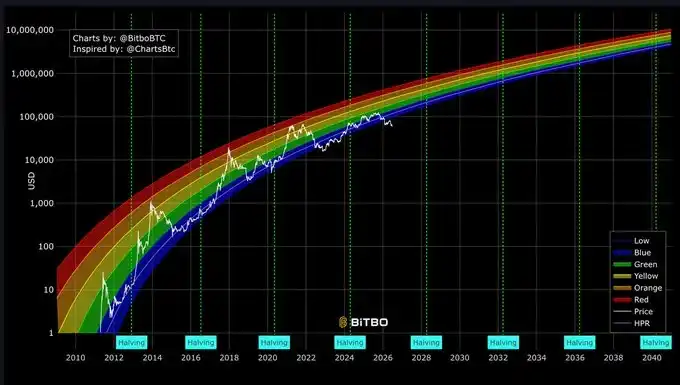
Indicateur deux : Carte Arc-en-Ciel

Le BTC est tombé dans la zone "Bitcoin is dead", c'est la deuxième fois historique que cela se produit, le prix étant nettement inférieur à la zone d'évaluation de la tendance à long terme.

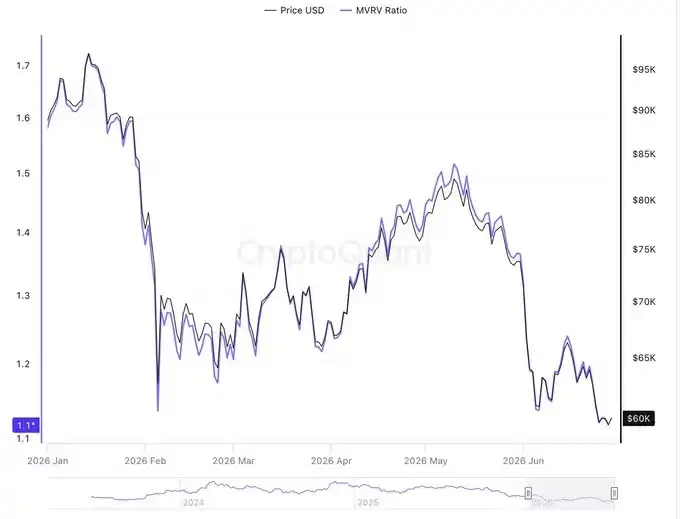
Indicateur trois : Ratio MVRV

Le MVRV actuel est d'environ 1,13, se trouvant près de la limite inférieure du canal historique bas, correspondant à une fourchette de prix d'environ 53 200 - 53 400 $. La valorisation du marché est déjà proche de la zone de fond.

Indicateur quatre : Prix Réalisé

Les données de CryptoQuant indiquent que le prix réalisé du BTC est d'environ 53 400 $. Le prix actuel ne dépasse ce niveau que d'environ 12 %, n'ayant pas encore franchi la ligne de coût de détention à long terme.

Indicateur cinq : Ratio UTXO en Profit/Perte

Cet indicateur est tombé à son niveau le plus bas de ce cycle d'ajustement. CryptoQuant estime que le marché présente pour la première fois un signal clair de "capitulation", un phénomène qui a souvent été proche des fonds de cycle par le passé.

Indicateur six : SOPR des Détenteurs à Long Terme

Le SOPR des détenteurs conservant leurs pièces depuis plus de 155 jours est de 0,662, ayant pénétré en territoire négatif. Les anciens détenteurs commencent à vendre à perte, libérant davantage de pression de vente sur le marché.

Indicateur sept : État de Survie des Mineurs

Le prix du BTC est resté longtemps inférieur au coût de production d'une partie des mineurs, environ 20 % des mineurs étant en situation de perte. Les mineurs font face à une pression importante dans ce cycle.

Indicateur huit : Écart des Revenus des Mineurs

Le revenu réel des mineurs est nettement inférieur au niveau théorique, les revenus des frais de transaction étant bas. Le processus de capitulation des mineurs se poursuit.

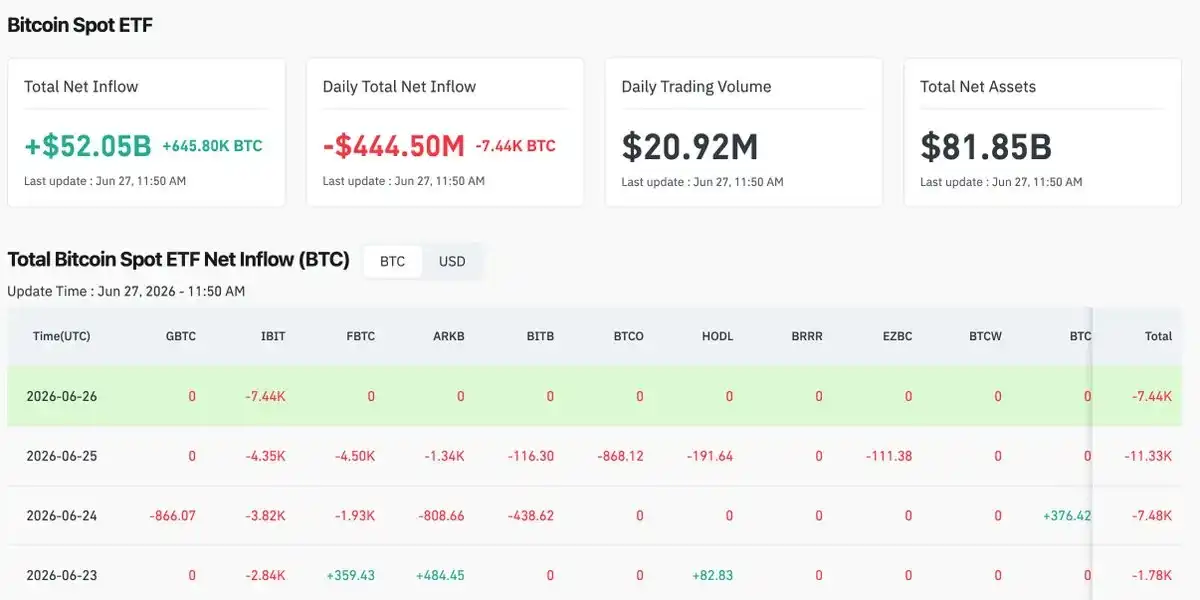
Indicateur neuf : Flux des ETF

Les ETF américains au comptoir sur le BTC ont récemment enregistré des sorties nettes continues, avec 13 jours consécutifs de sorties et une sortie nette hebdomadaire dépassant 1,7 milliard de dollars. La demande institutionnelle est sous pression.

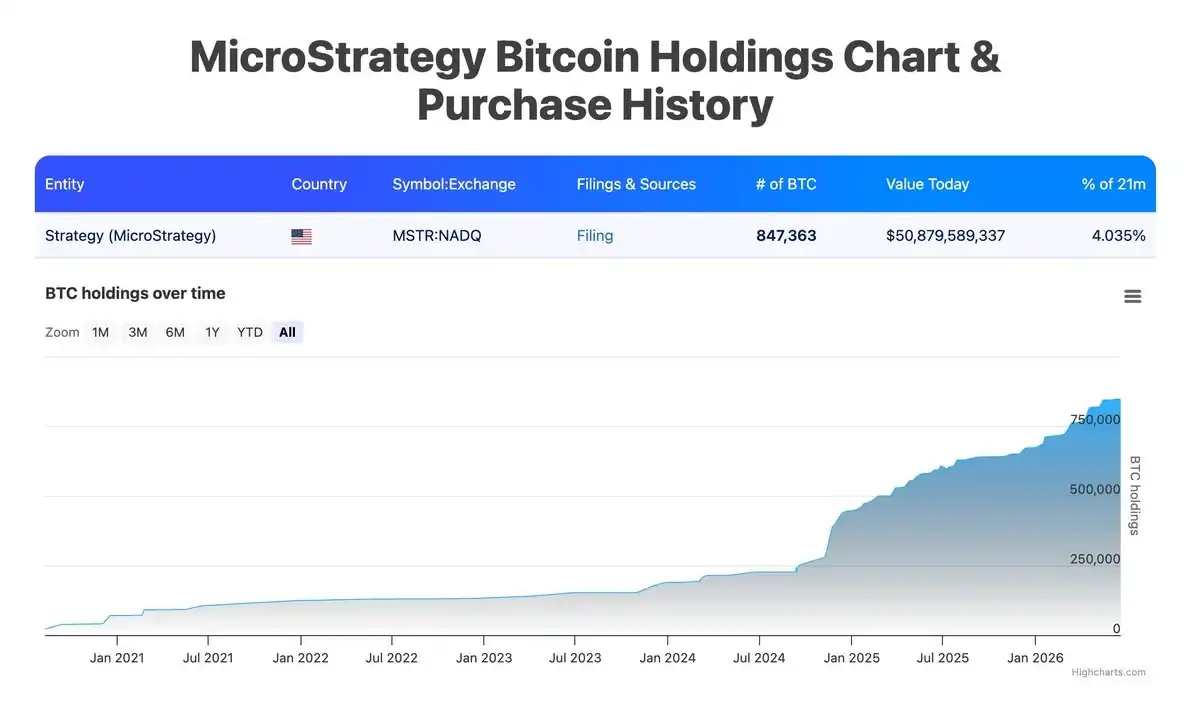
Indicateur dix : Risque Strategy

Strategy détient environ 847 000 BTC, mais la prime de ses actions s'est fortement contractée. Le modèle traditionnel de "financement pour acheter des cryptos" est sous pression.

Indicateur onze : Durée et Retracement du Marché Baissier

Ce cycle d'ajustement dure depuis plus de 265 jours, avec un retracement maximal d'environ 52,5 %. La baisse est inférieure à celle des marchés baissiers historiques, mais la durée s'approche déjà d'un cycle long.

Indicateur douze : Attentes du Marché Polymarket

Les paris du marché indiquent que la probabilité que le BTC chute en dessous de 55 000 $ est encore d'environ 80 %, et une chute en dessous de 50 000 $ présente également une probabilité significative. Les traders restent prudents.

Le Bitcoin se trouve actuellement dans une phase d'ajustement profond et de construction potentielle d'un fond.

Les indicateurs de valorisation sont entrés dans des zones historiquement basses (peur extrême, zone morte de l'arc-en-ciel, MVRV ~1,13, prix seulement ~12 % au-dessus du prix réalisé), et les signaux de capitulation sur la chaîne s'accumulent également progressivement (pression sur les mineurs, début de vente à perte des détenteurs à long terme, UTXO bas).

Mais l'assainissement complet n'est pas encore terminé - le prix réalisé n'a toujours pas été franchi de manière significative, et la demande des ETF ne s'est pas encore inversée.

La zone en dessous de 60 000 $ présente déjà un attrait à moyen-long terme, mais le moment actuel se prête mieux à une observation patiente pour confirmer les signaux, plutôt qu'à une action agressive. Portez une attention particulière à des signaux tels que le retour à des entrées nettes pour les ETF, la remontée du SOPR des détenteurs à long terme, et l'allègement de la pression sur les mineurs.

Trending Cryptos

Related Questions

QQuel est l'objectif principal de cet article sur les 12 indicateurs de données du Bitcoin ?

AL'article a pour objectif principal d'analyser 12 indicateurs clés pour évaluer si le Bitcoin a atteint un point bas sur le marché, en examinant des éléments tels que la valorisation, les signaux on-chain et les pressions des mineurs.

QSelon l'article, à quel niveau se situe l'indice de Peur et Cupidité et qu'indique-t-il ?

AL'indice de Peur et Cupidité affiche un niveau de 16, ce qui le place dans la zone d' "Extrême Peur". Cela indique que le sentiment du marché est extrêmement pessimiste, un niveau similaire ayant été observé lors de l'événement FTX en 2022.

QQue signifie le fait que le Bitcoin soit entré dans la zone "Bitcoin is dead" sur le Rainbow Chart ?

ALe fait que le Bitcoin soit tombé dans la zone "Bitcoin is dead" (Le Bitcoin est mort) sur le Rainbow Chart signifie que son prix se situe nettement en dessous de sa zone de valorisation de tendance à long terme. C'est seulement la deuxième fois dans l'histoire que cela se produit.

QQuel est un signe clé mentionné dans l'article indiquant que la pression de vente du marché s'intensifie ?

AUn signe clé est le SOPR (Spent Output Profit Ratio) des détenteurs à long terme, qui est passé en territoire négatif à 0,662. Cela signifie que les détenteurs de bitcoins depuis plus de 155 jours commencent à vendre à perte, libérant ainsi davantage de pression de vente sur le marché.

QQuels sont, selon la conclusion de l'article, les signaux à surveiller pour confirmer un renversement potentiel du marché ?

ASelon la conclusion de l'article, il faut surveiller plusieurs signaux pour confirmer un renversement potentiel : un retour des flux nets positifs dans les ETF Bitcoin, une amélioration du SOPR des détenteurs à long terme et une réduction de la pression sur les mineurs.

Related Reads

From 'Address Clustering' to 'Evidence Standards': Why is Chainalysis Redefining Blockchain Tracing?

**Summary:** In June 2026, Chainalysis introduced the **Blockchain Tracing Ontology (BTO)**, a proposed data framework aiming to establish standardized, transparent, and verifiable models for blockchain analysis. This initiative addresses a core industry issue: despite public blockchain data, different firms often produce inconsistent results (e.g., differing entity labels for the same address) due to non-uniform methodologies, particularly in **address clustering**. This lack of standardization poses challenges for judicial investigations, AML, and enforcement. The BTO is not a new clustering algorithm but a **common "language" or conceptual framework**. It moves beyond the simplistic "cluster" model by introducing a hierarchical structure: **Entity → Wallet → Wallet Segment → Address**, which better reflects complex organizational wallet management. A key shift is from presenting mere results to ensuring **process trust and explainability**. The framework emphasizes documenting the **Evidence** and **Confidence** behind each analytical claim—specifying the on-chain/off-chain data, rules applied, and certainty levels—enabling third-party verification. This focus is partly informed by legal precedents like the **Bitcoin Fog** case, where Chainalysis's methods underwent rigorous judicial scrutiny (Daubert hearing), highlighting the need for reproducible, scientifically sound analysis. The proposal clarifies that on-chain analysis identifies address relationships and flow patterns, not real-world identities, which still require off-chain evidence (e.g., KYC data). Ultimately, Chainalysis envisions steering the industry from an "experience-driven" to a **"standards-driven"** future, where competition centers on **data quality, analytical transparency, and judicial admissibility** rather than just label coverage. Widespread adoption could facilitate cross-agency collaboration, reduce disputes, and provide a more reliable foundation for global compliance and enforcement.

marsbit11m ago

From 'Address Clustering' to 'Evidence Standards': Why is Chainalysis Redefining Blockchain Tracing?

marsbit11m ago

The 'Conference Circuit' for the Second Half of the Year Begins! A Complete Overview of the 2026 Web3 Global Summit Schedule

"Web3 Global Summit Calendar for the Second Half of 2026" provides a comprehensive list of major Web3 and blockchain conferences worldwide, focusing on events from July to December 2026. The schedule starts in July with IVS in Kyoto, WebX in Tokyo, Canada Crypto Week in Toronto, and Malaysia Blockchain Week in Kuala Lumpur. August features Conviction in Ho Chi Minh City, Coinfest Asia in Bali, and Bitcoin Hong Kong. September is the most intense month, with notable events like NFT NYC in New York, ETHRome in Rome, Money20/20 in Saudi Arabia, European Blockchain Convention in Barcelona, and Korea Blockchain Week in Seoul. The fourth quarter begins with the significant TOKEN2049 Singapore in October, which will be the sole TOKEN2049 event of the year following the cancellation of the Dubai edition. November includes Devcon 8 and Bitcoin Amsterdam in Amsterdam, Digital Asset Summit and Solana Breakpoint in London. The year concludes in December with Blockchain Life in Dubai and Bitcoin MENA in Abu Dhabi. The article also lists key events from the first half of the year (January to June, marked as concluded) for reference, including Consensus Hong Kong, ETHDenver, and Paris Blockchain Week. The guide serves as a resource for planning attendance at these industry gatherings across Asia, Europe, North America, and the Middle East.

Foresight News21m ago

The 'Conference Circuit' for the Second Half of the Year Begins! A Complete Overview of the 2026 Web3 Global Summit Schedule

Foresight News21m ago

Video Edition Nano Banana Arrives: Built-in Gemini World Knowledge, Original Banana Generates Images in Just 4 Seconds

Google has unveiled two new multimodal AI models: Gemini Omni Flash and Nano Banana 2 Lite. Gemini Omni Flash is a video generation and editing model that leverages Gemini's world knowledge. It allows for conversational video editing using natural language prompts, maintains scene consistency, and integrates text/graphics with video actions. Priced at $0.10 per second of output, its current limitations include a 10-second video cap. Nano Banana 2 Lite (gemini-3.1-flash-lite-image) is an optimized image generation model focused on speed and cost. It produces a 1K resolution image in about 4 seconds at a cost of roughly $0.034, making it significantly faster and cheaper than its predecessor. It retains strong text rendering capabilities. A key highlight is the combined workflow: users can rapidly generate images with Nano Banana 2 Lite and then seamlessly feed them into Gemini Omni Flash to create videos. Google demonstrated this with three application demos: "Anywhere" for creating travel videos from photos, "Space Lift" for generating interior design walkthroughs, and "Omni Product Studio" for automating e-commerce ad creation from product photos. The release underscores Google's strategic focus on advancing multimodal AI for practical, commercial applications in areas like marketing, design, and content creation, despite competitive pressures in other AI domains.

marsbit29m ago

Video Edition Nano Banana Arrives: Built-in Gemini World Knowledge, Original Banana Generates Images in Just 4 Seconds

marsbit29m ago

Trading

Spot

Hot Articles

What is $BITCOIN

DIGITAL GOLD ($BITCOIN): A Comprehensive Analysis Introduction to DIGITAL GOLD ($BITCOIN) DIGITAL GOLD ($BITCOIN) is a blockchain-based project operating on the Solana network, which aims to combine the characteristics of traditional precious metals with the innovation of decentralized technologies. While it shares a name with Bitcoin, often referred to as “digital gold” due to its perception as a store of value, DIGITAL GOLD is a separate token designed to create a unique ecosystem within the Web3 landscape. Its goal is to position itself as a viable alternative digital asset, although specifics regarding its applications and functionalities are still developing. What is DIGITAL GOLD ($BITCOIN)? DIGITAL GOLD ($BITCOIN) is a cryptocurrency token explicitly designed for use on the Solana blockchain. In contrast to Bitcoin, which provides a widely recognized value storage role, this token appears to focus on broader applications and characteristics. Notable aspects include: Blockchain Infrastructure: The token is built on the Solana blockchain, known for its capacity to handle high-speed and low-cost transactions. Supply Dynamics: DIGITAL GOLD has a maximum supply capped at 100 quadrillion tokens (100P $BITCOIN), although details regarding its circulating supply are currently undisclosed. Utility: While precise functionalities are not explicitly outlined, there are indications that the token could be utilized for various applications, potentially involving decentralized applications (dApps) or asset tokenization strategies. Who is the Creator of DIGITAL GOLD ($BITCOIN)? At present, the identity of the creators and development team behind DIGITAL GOLD ($BITCOIN) remains unknown. This situation is typical among many innovative projects within the blockchain space, particularly those aligning with decentralized finance and meme coin phenomena. While such anonymity may foster a community-driven culture, it intensifies concerns about governance and accountability. Who are the Investors of DIGITAL GOLD ($BITCOIN)? The available information indicates that DIGITAL GOLD ($BITCOIN) does not have any known institutional backers or prominent venture capital investments. The project seems to operate on a peer-to-peer model focused on community support and adoption rather than traditional funding routes. Its activity and liquidity are primarily situated on decentralized exchanges (DEXs), such as PumpSwap, rather than established centralized trading platforms, further highlighting its grassroots approach. How DIGITAL GOLD ($BITCOIN) Works The operational mechanics of DIGITAL GOLD ($BITCOIN) can be elaborated on based on its blockchain design and network attributes: Consensus Mechanism: By leveraging Solana’s unique proof-of-history (PoH) combined with a proof-of-stake (PoS) model, the project ensures efficient transaction validation contributing to the network's high performance. Tokenomics: While specific deflationary mechanisms have not been extensively detailed, the vast maximum token supply implies that it may cater to microtransactions or niche use cases that are still to be defined. Interoperability: There exists the potential for integration with Solana’s broader ecosystem, including various decentralized finance (DeFi) platforms. However, the details regarding specific integrations remain unspecified. Timeline of Key Events Here is a timeline that highlights significant milestones concerning DIGITAL GOLD ($BITCOIN): 2023: The initial deployment of the token occurs on the Solana blockchain, marked by its contract address. 2024: DIGITAL GOLD gains visibility as it becomes available for trading on decentralized exchanges like PumpSwap, allowing users to trade it against SOL. 2025: The project witnesses sporadic trading activity and potential interest in community-led engagements, although no noteworthy partnerships or technical advancements have been documented as of yet. Critical Analysis Strengths Scalability: The underlying Solana infrastructure supports high transaction volumes, which could enhance the utility of $BITCOIN in various transaction scenarios. Accessibility: The potential low trading price per token could attract retail investors, facilitating wider participation due to fractional ownership opportunities. Risks Lack of Transparency: The absence of publicly known backers, developers, or an audit process may yield skepticism regarding the project's sustainability and trustworthiness. Market Volatility: The trading activity is heavily reliant on speculative behavior, which can result in significant price volatility and uncertainty for investors. Conclusion DIGITAL GOLD ($BITCOIN) emerges as an intriguing yet ambiguous project within the rapidly evolving Solana ecosystem. While it attempts to leverage the “digital gold” narrative, its departure from Bitcoin's established role as a store of value underscores the need for a clearer differentiation of its intended utility and governance structure. Future acceptance and adoption will likely depend on addressing the current opacity and defining its operational and economic strategies more explicitly. Note: This report encompasses synthesised information available as of October 2023, and developments may have transpired beyond the research period.

535 Total ViewsPublished 2025.05.13Updated 2025.05.13

What is $BITCOIN

Discussions

Welcome to the HTX Community. Here, you can stay informed about the latest platform developments and gain access to professional market insights. Users' opinions on the price of BTC (BTC) are presented below.

活动图片