Critical Game Week: BTC Retracement Confirmation vs. HYPE Support Battle | Guest Analysis

marsbitPublished on 2026-06-22Last updated on 2026-06-22

Abstract

This weekly analysis outlines a critical juncture for BTC and HYPE markets, focusing on key price level confirmations. **BTC Analysis:** BTC is at a pivotal point after a five-wave rally from the June 5th low of $59,100. The price has broken below a short-term rising channel's lower boundary, with the current move seen as a pullback to test this breakdown. Failure to reclaim this level could lead to a retest of the $59,000-$60,000 support zone. The core scenario hinges on this channel retest outcome. * **Key Levels:** Resistance at $64,500-$65,000 (channel boundary) and $69,500-$70,500. Support at $59,000-$60,000 and $55,000. * **Strategy:** A core bearish stance is maintained (20% short from last week), with short-term plans for tactical trades. Three detailed contingency plans (A/B/C) are provided for short positions on resistance tests or breakdowns, emphasizing strict stop-loss discipline. **HYPE Analysis:** HYPE shows strong momentum but is currently in a corrective phase after hitting a new high of $76.94. The price is retesting the crucial $64-$66 support area. * **Key Levels:** Resistance near $77 and $80-$82. Support at $64-$66 and $52-$54. * **Strategy:** The short-term approach is "buy on dips, avoid chasing rallies." A long position is considered only if clear stabilization signals appear at the $64-$66 or deeper $52-$54 support zones, with tight risk controls. **General Risk Management:** A standardized trailing stop-loss protocol is emphasized: set in...

This week, the market enters a critical phase of contention.

At the macro level, marginal changes in Federal Reserve policy expectations continue to dictate the pricing rhythm of risk assets. In the crypto market, after the previous period of consolidation, the divergence between bulls and bears is intensifying around key price levels.

This weekly review maintains the consistent framework: based on multi-timeframe structural analysis and combined with quantitative model signals, it assesses the market outlook for BTC and HYPE this week and formulates specific short- to medium-term trading plans.

It is crucial to note that all content herein represents personal technical analysis records, serving solely as a reference framework and review basis for my own trading decisions, and does not constitute any form of investment advice. The market is always more complex than predictions. Strict adherence to risk control and stop-loss discipline remains the top priority.

Summary of Core Trading Views for This Week:

  • BTC Hourly Timeframe Structure Analysis (Detailed in Part 1)
  • BTC Weekly Outlook & Medium/Short-Term Trading Strategies (Detailed in Part 2)
  • HYPE Hourly Timeframe Structure Analysis (Detailed in Part 3)
  • HYPE Weekly Outlook & Short-Term Trading Strategy (Detailed in Part 4)

Market Verification of Last Week's Trading Strategies & Core Views:

  • BTC Market Outlook Verification: Last week, strictly following trading discipline, we promptly established an approximately 20% short position when market entry opportunities emerged. The medium-term trading plan outlined in the weekly review article was executed.

I. In-depth Analysis of Bitcoin's Hourly Timeframe Structure

Bitcoin _4-Hour K-line Chart
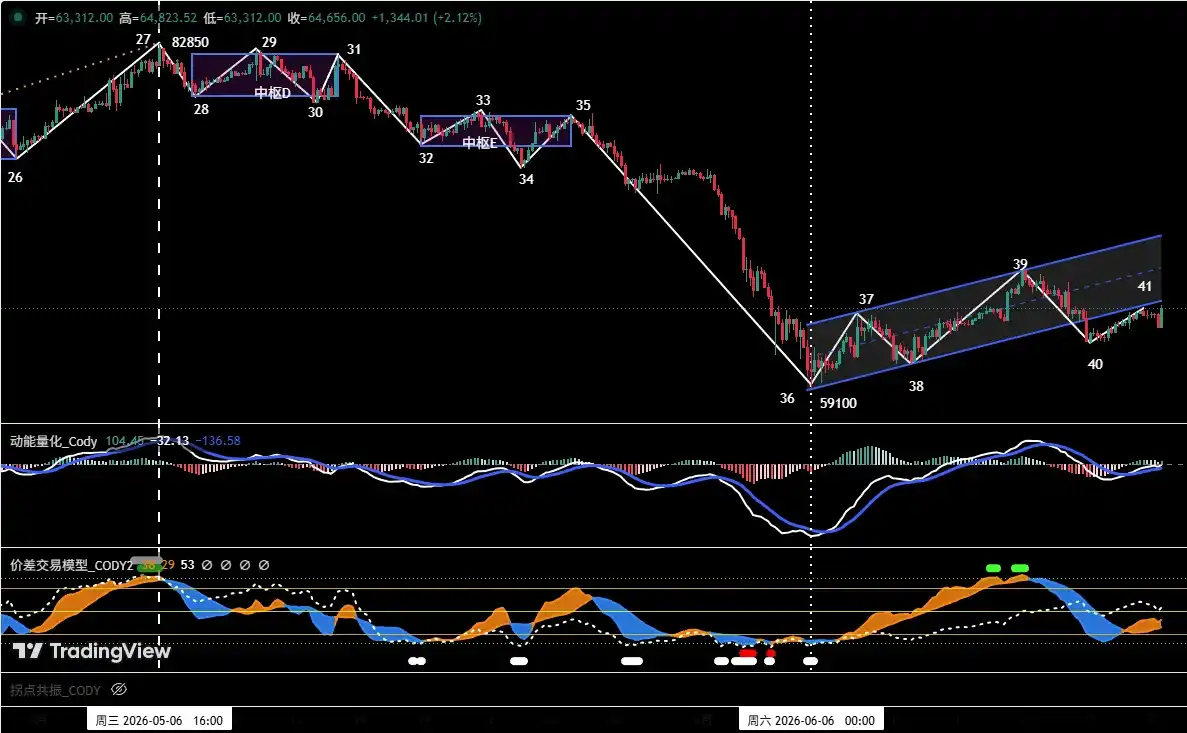
Figure 1

1 As shown in (Figure 1): From a 4-hour structural perspective, the price rebound initiated from the June 5th low of $59,100 can be subdivided into a five-wave structure, corresponding sequentially to segments 36-37, 37-38, 38-39, 39-40, and 40-41.

2 The overall trend presents a short-term rising channel pattern (blue channel in the chart): its upper bound is formed by connecting the two rebound highs at (point 37) and (point 39), while the lower bound is established by connecting the two correction lows at (point 36) and (point 38). The chart shows that the price has already breached the channel's lower bound at (point 40). The current (40-41) rebound segment can be viewed as a retracement confirmation phase for the breakdown below the channel's lower bound. If (point 41) fails to decisively reclaim a position above the channel's lower bound, the probability of the price revisiting the previous low support around $59,100 will significantly increase.

II. Bitcoin Weekly Outlook and Trading Strategies

1. BTC Weekly Market Outlook:

Core View for the Week: Focus on the outcome of the price's retracement confirmation of the short-term channel's lower bound.

  • If it holds firmly above, the price may continue its rebound along the short-term rising channel, potentially challenging the core resistance zone of $69,500~$70,500.
  • If it fails to hold, the market may retest the core support zone of $59,000~$60,000.

2. Core Resistance Levels:

  • First Resistance Zone: $64,500~$65,000 area (near the short-term rising channel's lower bound)
  • Second Resistance Zone: $69,500~$70,500 area (previous high-volume congestion zone)

3. Core Support Levels:

  • First Support Level: $59,000~$60,000 area (previous significant support level)
  • Second Support Level: Around $55,000 (previous significant support level)

4. Trading Strategies for This Week (Excluding Unexpected News Impact)

1 Medium-Term Strategy:

Bitcoin _ Daily K-line Chart (Position Monitoring Model)
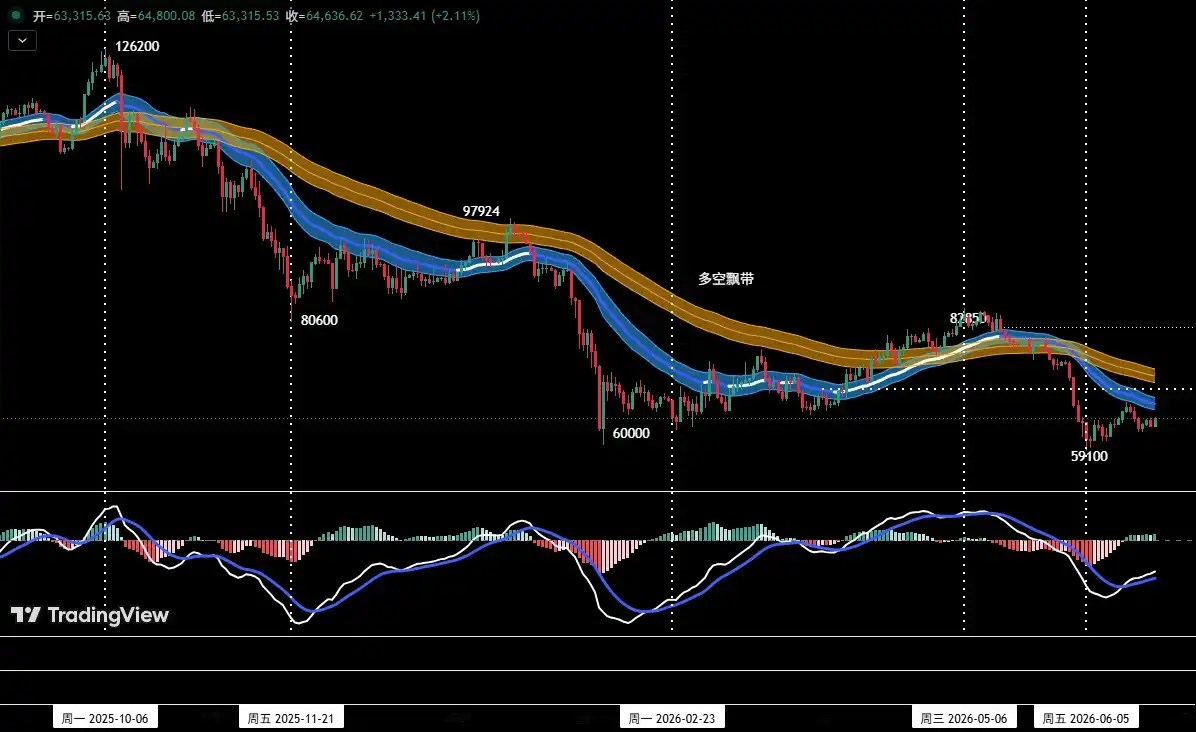
Figure 2

Position Monitoring Model: As shown in (Figure 2), the current price has decisively broken below the "Bull-Bear Channel," confirming a shift in market structure to a bear-dominated regime. Following the pre-set plan last week, we entered a short position around $64,500, with the initial medium-term position controlled at approximately 20% of total capital. Subsequent actions will adhere to stop-loss discipline, awaiting the next opportunity to add to the position.

2 Short-Term Strategy: Utilize 30% of capital, set stop-loss points, and seek "spread" trading opportunities based on support and resistance levels (using 30-minute/60-minute cycles).

3 To dynamically respond to the market's complex evolution in short-term operations, we have pre-formulated three specific contingency plans: A, B, and C.

Plan A: Tentative Positioning in Resistance Zone

  • Entry: If the price rallies to the $64,500~$65,000 zone showing signs of exhaustion, combined with a quantitative model top signal, an initial short position of around 15% can be established.
  • Risk Control: Set an initial stop-loss.
  • Exit: When the correction approaches significant support levels and aligns with model signals, gradually close positions to take profits.

Plan B: Adding to Position in Strong Resistance Zone

  • Addition: If the price breaks above the $65,000 resistance and continues to rally to the $69,500~$70,500 zone showing pressure signs, combined with a quantitative model top signal, increase the short position to within 30%.
  • Risk Control: Set an initial stop-loss.
  • Exit: When the correction approaches significant support levels and aligns with model signals, gradually close positions to take profits.

Plan C: Following the Break Below Support to Add Shorts

  • Addition: If the price decisively breaks below the $65,000 support, continues its decline, and loses the $59,000~$60,000 support zone, consider adding to the short position (within 30%) when price shows weakness during a retracement confirmation.
  • Risk Control: Set an initial stop-loss.
  • Exit: When the decline reaches significant support levels and aligns with model signals, gradually close positions to take profits.

III. HYPE Hourly Timeframe Structure Analysis

HYPE_4-Hour K-line Chart
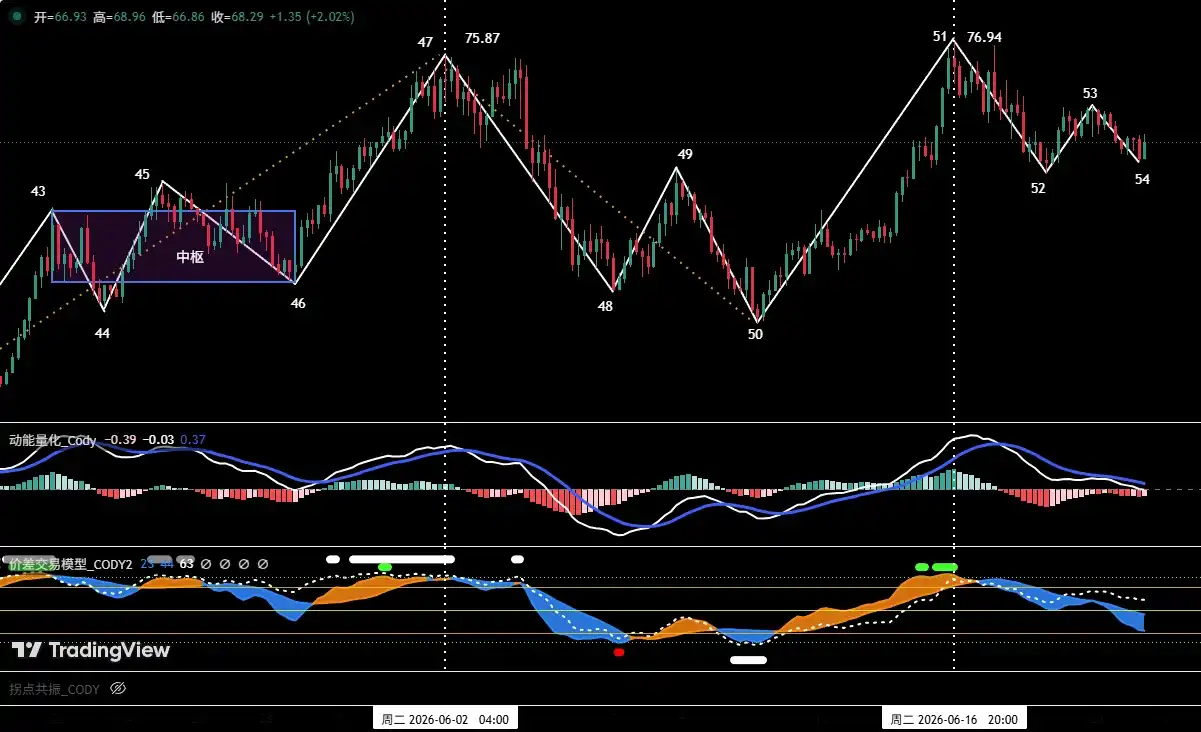
Figure 3

1 As shown in (Figure 3), on the 4-hour timeframe, HYPE initiated a correction from the June 2nd high of $75.87 (point 47), finding support near $52.62 (point 50) on June 10th, a correction lasting about 9 trading days. Subsequently, the market began a strong upward wave (segment 50-51), breaking the previous high within 6 trading days to reach a new high of $76.94 since the January rally, indicating that bullish momentum remains strong.

2 The decline from the new high presents a clear three-wave corrective structure (51-52, 52-53, 53-54). The price has currently retraced back to the critical support zone of $64~$66.

  • Bullish Scenario: If the price finds effective support in this zone, the uptrend from (point 50) is likely to continue, with subsequent prices challenging new highs.
  • Bearish Scenario: If this level is lost, the correction period will extend, and the price may retest the core support band of $52~$54, which marks the starting point of the previous uptrend.

IV. HYPE Weekly Outlook and Short-Term Trading Strategy

1. HYPE Weekly Market Outlook:

1 Core Resistance Levels:

  • First Resistance Level: Around $77
  • Second Resistance Zone: $80~$82 area

2 Core Support Levels:

  • First Support Level: $64~$66 area
  • Second Support Level: $52~$54 area

Core View for HYPE This Week:

  • Observe the outcome of the battle between bulls and bears over the $64~$66 zone.

2. HYPE Short-Term Trading Strategy for This Week (Long on Support)

This week's short-term HYPE trading should adhere to the strategy of "buying the dip, avoiding chasing rallies."

Short-Term Strategy: Testing Longs on Support Zone Stabilization

When the HYPE price retests and finds support, showing signs of stabilization in the $64~$66 key support zone or the deeper $52~$54 zone, and this aligns with bottom signals triggered by the two models, consider a light long position trial. Position size must be controlled below 30%, and strict stop-loss discipline must be maintained.

V. Special Notes:

  1. Upon Entry: Immediately set the initial stop-loss.
  2. Upon Reaching 1% Profit: Move the stop-loss to the entry price (break-even point), ensuring capital safety.
  3. Upon Reaching 2% Profit: Move the stop-loss to the position of 1% profit.
  4. Continuous Tracking: Thereafter, for every additional 1% profit gained, move the stop-loss up by 1%, dynamically protecting and locking in profits.

Financial markets change rapidly. All market analysis and trading strategies require dynamic adjustment. All views, analytical models, and operational strategies mentioned in this article are derived from personal technical analysis, intended solely for personal trading log purposes, and do not constitute any investment advice or operational basis. Markets involve risk, investment requires caution. Please do not make decisions based solely on this content.

Trending Cryptos

Related Questions

QWhat is the key technical situation for Bitcoin according to the analysis?

AThe key technical situation for Bitcoin is its current position in a short-term rising channel on the 4-hour chart. The price has already broken below the channel's lower rail at point 40. The current move (40-41) is seen as a retest to confirm this break. If point 41 fails to hold above the lower rail, the probability of a retest of the previous low at $59,100 increases significantly.

QWhat are the two main scenarios for HYPE this week based on its price action?

AFor HYPE, there are two main scenarios based on its price action around the key support zone of $64-$66. In the bullish scenario, if the price finds effective support in this zone, the uptrend from point 50 is expected to continue, potentially challenging new highs. In the bearish scenario, if this support is decisively broken, the correction will likely extend, and the price may test the more critical support band of $52-$54.

QWhat is the core medium-term trading strategy for Bitcoin, and what action was already taken?

AThe core medium-term strategy for Bitcoin is bearish, as the price has broken below the 'Bull-Bear Channel' on the daily chart, confirming a market structure shift to bearish dominance. Following the plan, a short position of approximately 20% of total capital was established near $64,500 last week. The strategy involves holding this initial position while waiting for potential opportunities to add to it.

QAccording to the analysis, what is the primary short-term trading approach recommended for HYPE?

AThe primary short-term trading approach for HYPE is to 'buy on dips and avoid chasing rallies.' The specific strategy is to attempt long positions on support levels. When the price retests and shows signs of stabilization in the key support zones of $64-$66 or $52-$54, and this is confirmed by bottom signals from the analysis models, a light long position (under 30% of capital) can be considered, with strict adherence to stop-loss discipline.

QWhat are the three contingency plans (A, B, C) outlined for Bitcoin's short-term trading?

AThe three contingency plans for Bitcoin's short-term trading are: Plan A (Resistance Zone Test): Initiate a ~15% short position if the price shows signs of stalling in the $64,500-$65,000 resistance zone with a model top signal. Plan B (Strong Resistance Zone): Increase the short position to under 30% if the price rallies further and faces pressure in the $69,500-$70,500 zone with a model top signal. Plan C (Breakdown Follow-through): Add to the short position (to under 30%) if the price decisively breaks below $65,000 and then $59,000-$60,000 support, showing weakness on any retest.

Related Reads

AI is Sweeping the Globe, So Why is Crypto + AI in a Slump?

AI Booms, But Crypto + AI Remains Sluggish: A Demand-Side Analysis Despite the AI industry's explosive growth and massive investment, the convergence of blockchain and AI (Crypto + AI) has seen limited traction. The core issue is a severe supply-demand mismatch, not a flawed premise. Analyzing four key sub-sectors reveals specific gaps: 1. **Decentralized Compute/Storage:** Offer logical benefits like data sovereignty and cost savings but lack a decisive technical advantage over entrenched cloud giants (AWS, GCP). Enterprises prioritize performance and stability and are unwilling to bear the switching risk and uncertainty of decentralized networks. 2. **Model Verification/Privacy (e.g., ZKML):** Address important long-term issues like auditability and data privacy, but these are not urgent operational pain points for most businesses today. Widespread demand will likely follow regulatory mandates (like the EU AI Act), not precede them. 3. **AI Agent Infrastructure:** Projects are building infrastructure for a future of autonomous, interacting agents. However, the current market focus is on internal process automation within corporate firewalls. The technology is ahead of market readiness. 4. **AI Agent Payments:** This is the only sub-sector where blockchain is on a level playing field with traditional finance. Both are trying to solve the unsolved problem of real-time, micro-transactions for machines, making it the most immediately competitive area. The overarching problem is that the AI industry invests heavily in solutions that solve immediate bottlenecks (e.g., faster memory, more power). Most Crypto + AI solutions target secondary, longer-term concerns (decentralization, transparency) and often come with performance trade-offs. The lack of a flagship, large-scale commercial success case further hinders mainstream capital inflow. The path forward requires either aligning more closely with the current industry's performance demands or patiently building the foundational infrastructure for the next phase of AI.

Foresight News11m ago

AI is Sweeping the Globe, So Why is Crypto + AI in a Slump?

Foresight News11m ago

Continuous Net Outflows from ETFs, Are Institutions Exiting?

US spot Bitcoin ETFs have experienced approximately $6 billion in net outflows over the past six weeks, marking the longest consecutive weekly withdrawal streak since their launch in 2024. The iShares Bitcoin Trust (IBIT) from BlackRock has been particularly affected, accounting for over 70% of recent outflows. On-chain analysis indicates that long-term Bitcoin holders (holding for over 155 days), who control about 83% of the circulating supply, remain steadfast. The selling pressure is primarily coming from allocators who entered through ETF brokerage accounts. This represents the first major collective capitulation since Bitcoin gained mainstream Wall Street recognition, driven more by risk-off portfolio adjustments than a fundamental rejection of the asset. Factors such as rising inflation, a hawkish shift in Federal Reserve policy, massive capital inflows into AI infrastructure, and attractive IPO opportunities have redirected speculative funds. Bitcoin, treated as a high-beta risk asset, was among the first to be sold. While the pace of outflows has slowed significantly—from $1.72 billion in early June to $226.8 million mid-month—the structural issue remains. IBIT's large size means its outflows alone exert substantial market pressure. With spot market volume thin, new capital inflows absent, and ETF buying muted, the market lacks sufficient buying support to absorb this selling. The coming sessions are critical. If IBIT outflows decelerate and Bitcoin reclaims $60,000, this phase could be seen as a healthy reset. However, if heavy IBIT redemptions resume and the price falls below $58,000, it would signal a more sustained institutional exit, requiring non-ETF buyers to shoulder the entire selling pressure alone. The ETF, while lowering entry barriers, has not removed Bitcoin's inherent volatility.

marsbit52m ago

Continuous Net Outflows from ETFs, Are Institutions Exiting?

marsbit52m ago

Introduction to the Concept of World Models: A Story from Psychology to the Main Battlefield of AI

**World Models: From Psychology to AI's Core Concept** "World model" is a trending but often confusing term in AI, describing a system that allows machines to internally simulate, predict, and rehearse potential outcomes before taking real-world action—like a mental "sandbox." While definitions vary—Yann LeCun emphasizes physical understanding, OpenAI's Sora is a video-based "world simulator," Google DeepMind's Genie 3 creates interactive 3D environments, and companies like Alibaba and Tesla focus on practical applications—the core goal is consistent: reduce reliance on vast real-world data by creating an internal, predictive model for safer and more efficient AI. The concept has deep roots, tracing back to psychologist Kenneth Craik (1943). In AI, it was revitalized by researchers like David Ha and Jürgen Schmidhuber (2018). Major technical approaches include: 1) generative video models (e.g., Sora) for visual realism; 2) abstract predictive models (e.g., LeCun's JEPA) for efficiency and physical reasoning; and 3) explicit 3D simulators (e.g., NVIDIA Omniverse) for precision. Fei-Fei Li proposes a classification based on the AI action loop: renderers (output observations), simulators (output world states), and planners (output actions). The emerging "World Action Model" (WAM) paradigm aims to unify future prediction and action generation. An industry framework is forming: upstream (data, compute, sensors), midstream (general and vertical platforms), and downstream applications (autonomous driving, robotics, gaming, etc.). Autonomous driving is currently the most mature use case. The current lack of a unified definition reflects the field's early, dynamic stage, similar to past tech revolutions. Different approaches—focusing on pixels, physics, or behavior—represent parallel explorations of how best to compress and understand the world. This diversity, while seemingly chaotic, signals that world models have moved from an academic idea to a critical industrial battleground, ultimately aiming to give machines the ability to understand, imagine, and reason about the world.

marsbit1h ago

Introduction to the Concept of World Models: A Story from Psychology to the Main Battlefield of AI

marsbit1h ago

Building the Bright Path While Secretly Crossing Chencang: Is Walsh Paving the Way for a September "Rate Cut"?

The title "Building the Plank Road Openly While Secretly Crossing at Chencang: Is Walsh Paving the Way for a September 'Rate Cut'?" suggests Federal Reserve Chair Kevin Walsh's hawkish stance may be a deliberate smokescreen. Academy Securities analyst Peter Tchir argues in a report that markets, currently pricing a 75% chance of a September hike, are missing a potential path to a September rate cut that Walsh himself might be quietly preparing. Tchir posits that Walsh's hawkish rhetoric aims to suppress long-term yield risks (with the 10-year Treasury yield falling recently) while creating room for a narrative shift based on upcoming data. The potential political endgame, according to this view, could be rate cuts in September and October, ahead of the midterm elections. This hinges on a political logic where the Trump administration's preference for lower rates remains unchanged. A core part of Tchir's argument involves redefining inflation metrics. He contends the Fed under Walsh may deprioritize the PCE index, criticizing its lagging components like Owners' Equivalent Rent (OER). Instead, he points to alternative, more real-time indicators like the New Tenant Repeat Rent Index (NTRR) and the Truflation daily index, which shows core inflation around 1.45%. He suggests the Fed could shift its data narrative to justify policy easing. Furthermore, Tchir downplays AI-driven inflation fears. He argues that consumer price sensitivity, evidenced by negative market reactions to price hikes (e.g., Apple), contradicts persistent inflation narratives. He also separates AI/data center spending—which he sees as relatively rate-insensitive—from broader consumer affordability issues, implying rate hikes are misdirected. Based on this analysis, Tchir sees a re-pricing of rate cut expectations as likely, creating opportunities in short-duration Treasuries. He maintains a neutral-to-slightly-bullish view on the long end of the yield curve. For equities, he recommends a significant overweight in energy (especially global nuclear assets) and, within defense/security themes, an overweight in biotech/pharma versus an underweight in semiconductors, expressing caution on AI/data center valuations.

marsbit1h ago

Building the Bright Path While Secretly Crossing Chencang: Is Walsh Paving the Way for a September "Rate Cut"?

marsbit1h ago

Trading

Spot

Hot Articles

How to Buy HYPE

Welcome to HTX.com! We've made purchasing Hyperliquid (HYPE) simple and convenient. Follow our step-by-step guide to embark on your crypto journey.Step 1: Create Your HTX AccountUse your email or phone number to sign up for a free account on HTX. Experience a hassle-free registration journey and unlock all features.Get My AccountStep 2: Go to Buy Crypto and Choose Your Payment MethodCredit/Debit Card: Use your Visa or Mastercard to buy Hyperliquid (HYPE) instantly.Balance: Use funds from your HTX account balance to trade seamlessly.Third Parties: We've added popular payment methods such as Google Pay and Apple Pay to enhance convenience.P2P: Trade directly with other users on HTX.Over-the-Counter (OTC): We offer tailor-made services and competitive exchange rates for traders.Step 3: Store Your Hyperliquid (HYPE)After purchasing your Hyperliquid (HYPE), store it in your HTX account. Alternatively, you can send it elsewhere via blockchain transfer or use it to trade other cryptocurrencies.Step 4: Trade Hyperliquid (HYPE)Easily trade Hyperliquid (HYPE) on HTX's spot market. Simply access your account, select your trading pair, execute your trades, and monitor in real-time. We offer a user-friendly experience for both beginners and seasoned traders.

3.5k Total ViewsPublished 2024.03.29Updated 2026.06.02

How to Buy HYPE

Discussions

Welcome to the HTX Community. Here, you can stay informed about the latest platform developments and gain access to professional market insights. Users' opinions on the price of HYPE (HYPE) are presented below.

活动图片