The crypto market is currently going through a period of heightened volatility as global economic conditions continue to worsen amid a backdrop of rising inflation and interest rates.
As the headwinds impacting global financial markets beat down all traces of bullish sentiment, many crypto investors are predicting that Bitcoin (BTC) price could drop to as low as $10,000 before a market bottom is found.

BTC/USDT 1-day chart. Source: TradingView
While many traders scoffed at the idea of BTC falling below its 2017 all-time high, the recent dip to $17,600 suggests that this bear market could be different from the last one.
Here’s what several analysts are saying about the possibility of Bitcoin falling to $10,000 in the next few weeks.
Historic pullbacks point to a low at $10,350
Insight into how BTC may perform in the short-term can be gleaned by looking at its performance during the bear market cycles of 2013 and 2017. In 2013, the maximum drawdown for Bitcoin was 85%, which took place over a period of 407 days. The maximum drawdown in 2017 was 84% and this period lasted for 364 days.

Historical drawdowns for Bitcoin. Source: Arcane Research
According to a recent report by Arcane Research, the current drawdown has been going on for 229 days and has thus far seen a maximum drawdown of 73%.
Arcane Research said: “If Bitcoin follows the blueprint of these cycles, a bottom should occur sometime in late Q4 2022, at a price as low as $10,350.”
While there is always a chance that an 85% pullback is a possibility, Arcane Research also noted that “Bitcoin is now far more intertwined in the broad financial markets, with the Fed, US elections, crypto regulations, and stock market impacting its performance.”
Further evidence that supports the possibility of a drop to the $10,000 range was touched upon by cryptocurrency research firm Delphi Digital, who posted the following chart noting that “From a high timeframe market structure perspective, the next place we have to be looking at is $10K-$12K.”

Brave new coin index for Bitcoin (BLX) 1-month chart. Source: Delphi Digital
Based on the chart above, the high timeframe market structure support is likely to exist between $9,500 and $13,500.
Delphi Digital said: “Coincidentally, this area lines up with the implied low if BTC experiences an 85% drawdown from peak to trough.”
Would $10,000 be a good spot to go long?
Not every analyst expects a drop to $10,000. Take for example, Will Clemente of Blockware Solutions. According to Clemente, Bitcoin's current range reflects a good spot for accumulation.
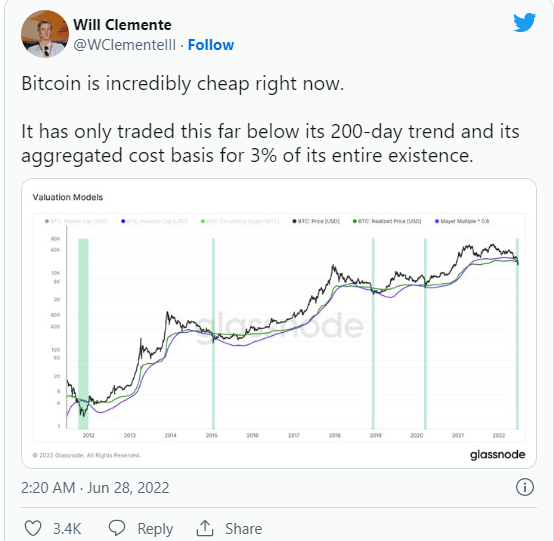
Additional data from Glassnode shows that Bitcoin’s 200-week moving average, balance price and delta price in its bear market floor model align with the 0.6 Mayer Multiple metric analyzed by Clemente.

Bitcoin bear market floor models. Source: Glassnode
Glassnode said: “Only 13 out of 4,360 trading days (0.2%) have ever seen similar circumstances, occurring in just two prior events, Jan 2015 and March 2020. These points are marked in green on the chart.”
Based on the Delta price metric which still remains untouched, the potential low for BTC is $15,750.

BTC/USD 1-month chart. Source: Twitter
John Bollinger, the creator of the popular Bollinger Bands trading indicator also suggested that Bitcoin price may have bottomed.
According to Bollinger: “Picture perfect double (M-type) top in BTCUSD on the monthly chart complete with confirmation by BandWidth and %b leads to a tag of the lower Bollinger Band. No sign of one yet, but this would be a logical place to put in a bottom.”