First 6-week losing streak since 2014 — 5 things to know in Bitcoin this week

CointelegraphPublished on 2022-05-09Last updated on 2022-05-09

Abstract

Bitcoin (BTC) starts the second week of May 2022 by bringing up bearish ghosts from its past — how much worse could the picture get for hodlers?

Bitcoin (BTC) starts the second week of May 2022 by bringing up bearish ghosts from its past — how much worse could the picture get for hodlers?
After falling to nearly $33,000, the largest cryptocurrency is giving market participants new and old a run for their money, and the fear is palpable.
A brutal combination of macro cues, which are set to continue this week and beyond, forms the backdrop for some historical chart retests that no one wanted to see again.
As calls for capitulation continue, there is still a lack of agreement about just how far BTC/USD could or should fall to put in a convincing long-term bottom.
Cointelegraph takes a look at factors poised to contribute to market movements in the coming days, as Bitcoin closes in on its 2022 lows.
Six weekly closes in the red
Whichever way you dice it, there is little to be bullish about when it comes to Bitcoin price charts this week.
The weekly close on May 8 at $34,000 meant that BTC/USD delivered its sixth weekly red candle in a row.
That chart feature has not been seen in nearly eight years — the last occurrence began in August 2014, data from Cointelegraph Markets Pro and TradingView shows.
Then, as now, Bitcoin was in the second year of its four-year halving cycle, having seen its first blow-off top at just over $1,000 in November 2013. This cycle, however, has been different, as that blow-off top either did not arrive or was a lot more muted than previous cycles.

BTC/USD 1-week candle chart (Bitstamp). Source: TradingViewMeanwhile, macro conditions have taken care of any hope of a late surge among the majority of analysts, who now expect financial tightening by central banks worldwide to keep risk assets such as crypto firmly in check.
Back to the chart and BTC/USD has lost over $4,000 or 11.1% in May already.
Historically, the worst month of May on record was in fact last year, in which the pair lost 35.3%, data from on-chain monitoring resource Coinglass shows.
After April’s performance, however, the odds of a comeback feel slim. For four years in a row prior to 2022, Bitcoin conversely saw gains of at least 32% in April, but this year printed a 17.3% loss — its worst on record.

BTC/USD monthly returns chart (screenshot). Source: CoinglassBTC 100-week moving average falls
As such, the advice from analysts when it comes to short-term Bitcoin price action is practically unanimous as the week begins: be careful.
After the weekly close, BTC/USD continued dropping down towards $30,000, at the time of writing looking to test $33,000 and January’s lows of $31,800 next.
“Don't try to catch this knife,” on-chain analytics resource Material Indicators told Twitter followers alongside a chart showing bid support disappearing from the Binance order book.
Monday’s order book data shows a major bid wall in place at $33,000. It was put there as another wall of buy interest at around $33,800 was dealt with swiftly by the market, showing the veracity of sell-side pressure in the current environment.

BTC/USD order book data (Binance). Source: Material Indicators“Historically $69.5M in BTC bid liquidity would serve as support, but historically it also had a significant amount of liquidity below it. That does not seem to be the case here,” Material Indicators added about that first line of defence.
Last week’s weekly candle also saw Bitcoin dive below its 100-week moving average (WMA) for the first time since March 2020.
Then, as with some previous piercings of the 100 WMA, BTC/USD then went on to test the 200 WMA as support. For popular Twitter account Bitcoin Back, the implications this time around are thus obvious.
“Both previous times led to capitulation to 200-week moving average in 2014 and 2018,” he wrote in part of his latest update.
“Today's chart has many differences from those two times, and those two times were very similar to each other.”

BTC/USD 1-week candle chart (Bitstamp) with 100, 200 WMA. Source: TradingViewBlockchain Backer nonetheless added that he expected a “big dive in” on Monday following the latest display of weakness.
As Cointelegraph reported, meanwhile, expectations even long before the weekly close were for Bitcoin to fall to or below $30,000 in the coming weeks.
US CPI primed to continue inflation narrative
Bitcoin’s rundown in the first week of May was overwhelmingly thanks to the broader macro weakness now firmly in place across global markets.
Stocks are particularly problematic in this respect, as crypto’s ongoing correlation to those indices makes for a grim ride for investors.
Things came to a head last week after tightening confirmations from the United States Federal Reserve — the S&P 500 capped its first five straight weekly drop since 2011.
Now, amid the ongoing Russia-Ukraine conflict and associated financial pressures, another force is due to return.
Inflation, already at its highest in the U.S. since the early 1980s, is tipped only to get worse thanks to the fallout from trade disruption and sanctions on Russia.
This week will see consumer price index (CPI) data for April released, and the odds are that the numbers will reflect the extent of the geopolitical turmoil like no others before it.
U.S. President Joe Biden will speak on the inflation issue on May 10 prior to the CPI print on May 11.
March CPI was 8.5%, while noises are already coming from analytics circles that inflation may be peaking now or in the near future.
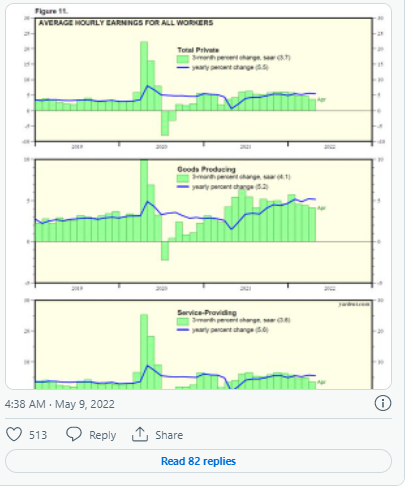
“The best scenario for a bottom for me would be capitulation somewhere in the next few days followed by a lower than expected CPI print on wednesday,” popular trading account Daan Crypto Trades argued.
“That would be my cue to bet big.”
Big or small, CPI events have tended to spark short-term BTC price volatility in recent months.
Calculating capitulation 
On the topic of “capitulation” — a mass sell-off as investors panic sell their bitcoins — data shows that the temptation to initiate may be strong.
Currently, over 40% of the Bitcoin supply is being held at a loss, and this is the highest proportion since April 2020, just after the COVID-19 crash.

At that time, a genuine capitulation event did take place, as evidenced first and foremost by price.
Analyzing unrealized profits and losses across hodlers at the time, as defined by on-chain analytics firm Glassnode, likewise confirmed capitulation on March 16, 2020.
Just nine days later, the firm’s net unrealized profit/loss metric exited the “capitulation” zone and reached “hope - fear” — one shade towards a recovery.
Currently, the metric measures “optimism - anxiety,” and is travelling downwards towards “hope - fear” territory.

Bitcoin net unrealized profit/loss chart. Source: GlassnodeSentiment collapses to macro bottom zone
It’s no surprise that overall crypto market sentiment has not benefited from the events of May so far.
According to the Crypto Fear & Greed Index, however, it is only this week that the reality of the situation has hit home for the majority.
As of May 9, the classic sentiment gauge measures 11/100, firmly in its “extreme fear” bracket and also at levels which have historically formed bottoms.
Crypto Fear & Greed has halved in value in just two days.

Crypto Fear & Greed Index (screenshot). Source: Alternative.meThe traditional financial market equivalent, the Fear & Greed Index, has meanwhile begun to diverge from crypto, steady at 30/100 or “fear” on May 9 even after last week’s mayhem.
“With Bitcoin now having retraced all the way down to $33.9k, trader sentiment has fallen to six week lows,” research firm Santiment commented on the situation.
“We typically prefer to see capitulation signs like this, as weak hands leaving the space is generally what is needed for a truly notable bounce.”

Fear & Greed Index (screenshot). Source: CNNThe views and opinions expressed here are solely those of the author and do not necessarily reflect the views of Cointelegraph.com. Every investment and trading move involves risk, you should conduct your own research when making a decision.


Trending Cryptos

Related Reads

The Verdict in Choi Tae-won's Divorce Case: Revealing the Inheritance Undercurrent Behind SK Hynix's Trillion-Won Empire

SK Group Chairman Chey Tae-won's high-profile divorce case, involving a record 1.38 trillion won settlement, has drawn attention to the succession plans for Korea's second-largest conglomerate, especially its crown jewel, SK hynix. Unlike traditional chaebol scripts centered on the eldest son, Chey's three children from his marriage to former President Roh Tae-woo's daughter, Roh Soh-yeong, are carving distinct, non-traditional paths. Eldest daughter Chey Yun-jung (b. 1989) is seen as the most evident successor. With a scientific and consulting background, she holds executive roles at SK bioscience and SK Inc.'s growth support department, focusing on future strategy and biopharma. Her marriage is to an AI infrastructure entrepreneur, not a traditional business alliance. Second daughter Chey Min-jung (b. 1991) took a unique route, voluntarily serving as a South Korean naval officer, including an anti-piracy deployment. She later worked on policy and strategy for SK hynix in Washington D.C. before co-founding an AI-driven healthcare startup. She married a former U.S. Marine Corps officer, connecting her to U.S. defense and policy circles—networks crucial for a global semiconductor giant. The only son, Chey In-geun (b. 1995), who studied physics like his father, worked briefly at SK E&S before joining McKinsey. Despite fitting the traditional "heir" profile as the eldest son, he remains silent and holds no public position or shares in SK, suggesting the old succession playbook is obsolete. As SK hynix's valuation soars, becoming a geopolitical asset in the AI era, the heirs' legitimacy is no longer automatic. They must prove themselves in fields like AI biotech, global policy, and strategic consulting. Their marriages also reflect new elite networks in tech and defense, not old political alliances. Their inheritance is the complex challenge of navigating a globalized, tech-driven world, not just a corporate throne.

marsbitYesterday 09:06

The Verdict in Choi Tae-won's Divorce Case: Revealing the Inheritance Undercurrent Behind SK Hynix's Trillion-Won Empire

marsbitYesterday 09:06

From OpenSea to OpenRouter: Is Alex Atallah Repeating His 'Exit at the Peak' Playbook?

From OpenSea to OpenRouter: Is Alex Atallah Repeating His "Exit at the Peak" Playbook? According to the Wall Street Journal, payments giant Stripe is in talks to acquire the AI model aggregation platform OpenRouter in a potential deal valuing the company near $100 billion. This would mark founder Alex Atallah's second creation of a company reaching a $100 billion valuation, following his co-founding of NFT marketplace OpenSea. OpenRouter, founded just over three years ago, has grown rapidly by acting as a unified gateway for developers to access over 400 AI models. It currently has about 10 million users and processes over 200 trillion tokens monthly. While the platform's annualized revenue is around $50 million, its valuation has skyrocketed from $1.3 billion in March 2026. The potential acquisition by Stripe, a company OpenRouter's founder once likened it to, represents a major expansion into AI infrastructure for the payments leader. This move echoes Atallah's previous timing with OpenSea, where he departed before the NFT market's significant downturn. For OpenRouter, selling now may be strategic. Despite its scale, its business model—charging a 5-5.5% fee on AI inference calls—faces pressure from competition, open-source models, and potential price wars among model providers, limiting its profitability narrative for an IPO. A key asset for potential acquirers like Stripe is OpenRouter's vast repository of real-world AI usage data, which offers unique insights into model performance and developer preferences that are difficult to replicate. Whether this potential deal signifies a new valuation benchmark for AI infrastructure or another market peak signal remains to be seen.

链捕手Yesterday 08:42

From OpenSea to OpenRouter: Is Alex Atallah Repeating His 'Exit at the Peak' Playbook?

链捕手Yesterday 08:42

Trading

Spot

Hot Articles

What is $BITCOIN

DIGITAL GOLD ($BITCOIN): A Comprehensive Analysis Introduction to DIGITAL GOLD ($BITCOIN) DIGITAL GOLD ($BITCOIN) is a blockchain-based project operating on the Solana network, which aims to combine the characteristics of traditional precious metals with the innovation of decentralized technologies. While it shares a name with Bitcoin, often referred to as “digital gold” due to its perception as a store of value, DIGITAL GOLD is a separate token designed to create a unique ecosystem within the Web3 landscape. Its goal is to position itself as a viable alternative digital asset, although specifics regarding its applications and functionalities are still developing. What is DIGITAL GOLD ($BITCOIN)? DIGITAL GOLD ($BITCOIN) is a cryptocurrency token explicitly designed for use on the Solana blockchain. In contrast to Bitcoin, which provides a widely recognized value storage role, this token appears to focus on broader applications and characteristics. Notable aspects include: Blockchain Infrastructure: The token is built on the Solana blockchain, known for its capacity to handle high-speed and low-cost transactions. Supply Dynamics: DIGITAL GOLD has a maximum supply capped at 100 quadrillion tokens (100P $BITCOIN), although details regarding its circulating supply are currently undisclosed. Utility: While precise functionalities are not explicitly outlined, there are indications that the token could be utilized for various applications, potentially involving decentralized applications (dApps) or asset tokenization strategies. Who is the Creator of DIGITAL GOLD ($BITCOIN)? At present, the identity of the creators and development team behind DIGITAL GOLD ($BITCOIN) remains unknown. This situation is typical among many innovative projects within the blockchain space, particularly those aligning with decentralized finance and meme coin phenomena. While such anonymity may foster a community-driven culture, it intensifies concerns about governance and accountability. Who are the Investors of DIGITAL GOLD ($BITCOIN)? The available information indicates that DIGITAL GOLD ($BITCOIN) does not have any known institutional backers or prominent venture capital investments. The project seems to operate on a peer-to-peer model focused on community support and adoption rather than traditional funding routes. Its activity and liquidity are primarily situated on decentralized exchanges (DEXs), such as PumpSwap, rather than established centralized trading platforms, further highlighting its grassroots approach. How DIGITAL GOLD ($BITCOIN) Works The operational mechanics of DIGITAL GOLD ($BITCOIN) can be elaborated on based on its blockchain design and network attributes: Consensus Mechanism: By leveraging Solana’s unique proof-of-history (PoH) combined with a proof-of-stake (PoS) model, the project ensures efficient transaction validation contributing to the network's high performance. Tokenomics: While specific deflationary mechanisms have not been extensively detailed, the vast maximum token supply implies that it may cater to microtransactions or niche use cases that are still to be defined. Interoperability: There exists the potential for integration with Solana’s broader ecosystem, including various decentralized finance (DeFi) platforms. However, the details regarding specific integrations remain unspecified. Timeline of Key Events Here is a timeline that highlights significant milestones concerning DIGITAL GOLD ($BITCOIN): 2023: The initial deployment of the token occurs on the Solana blockchain, marked by its contract address. 2024: DIGITAL GOLD gains visibility as it becomes available for trading on decentralized exchanges like PumpSwap, allowing users to trade it against SOL. 2025: The project witnesses sporadic trading activity and potential interest in community-led engagements, although no noteworthy partnerships or technical advancements have been documented as of yet. Critical Analysis Strengths Scalability: The underlying Solana infrastructure supports high transaction volumes, which could enhance the utility of $BITCOIN in various transaction scenarios. Accessibility: The potential low trading price per token could attract retail investors, facilitating wider participation due to fractional ownership opportunities. Risks Lack of Transparency: The absence of publicly known backers, developers, or an audit process may yield skepticism regarding the project's sustainability and trustworthiness. Market Volatility: The trading activity is heavily reliant on speculative behavior, which can result in significant price volatility and uncertainty for investors. Conclusion DIGITAL GOLD ($BITCOIN) emerges as an intriguing yet ambiguous project within the rapidly evolving Solana ecosystem. While it attempts to leverage the “digital gold” narrative, its departure from Bitcoin's established role as a store of value underscores the need for a clearer differentiation of its intended utility and governance structure. Future acceptance and adoption will likely depend on addressing the current opacity and defining its operational and economic strategies more explicitly. Note: This report encompasses synthesised information available as of October 2023, and developments may have transpired beyond the research period.

1.0k Total ViewsPublished 2025.05.13Updated 2025.05.13

What is $BITCOIN

Discussions

Welcome to the HTX Community. Here, you can stay informed about the latest platform developments and gain access to professional market insights. Users' opinions on the price of BTC (BTC) are presented below.

活动图片