Introducing: Global Metrics Suite

insights.glassnodePublished on 2026-05-28Last updated on 2026-05-28

Abstract

Glassnode introduces the Global Metrics Suite, a new framework for analyzing the fragmented cryptocurrency market through aggregated on-chain and market data. It solves the challenge of structural discontinuities in traditional aggregate series by using formally rebalanced baskets (e.g., by market cap) and provides two output types: Raw Aggregates (preserving original units) and Indices (scaled, continuous series for trend comparison). The article demonstrates the value of continuity-adjusted indices through three examples. First, they reveal a significant 2024 surge in small-cap market cap, a rally invisible in raw data where "winners" leave the basket upon crossing a threshold. Second, a global Spent Output Profit Ratio (SOPR) index shows that small-cap sentiment is more stable than raw data suggests, while larger caps exhibit a trend of decreasing profit realization per cycle. Third, an Open Interest index highlights the higher volatility and leverage spikes in mid- and small-cap derivatives, useful for monitoring cascade risks. Four metrics are currently available via API: Total Market Cap, Realized Cap, Median SOPR, and Total Open Interest, each for "All Coins," Large, Mid, and Small Cap baskets. The framework, using weekly rebalancing and equal weighting, brings the continuity discipline of traditional finance indices to multi-asset crypto analytics.

Aggregate market analysis has become a challenge since the digital asset space has fragmented into thousands of assets, sectors, and rapidly changing market-cap cohorts. As assets appreciate, decline, launch, or disappear, aggregate metric series develop structural discontinuities that make long-term analysis difficult.

Previously, we showcased the power of global views that aggregate metrics across the market using our Multi-Asset Explorer. We have now extended this framework with Glassnode Global Metrics — a suite of formally rebalanced aggregate metrics with continuous index normalization, available via API.

In this article, we introduce the framework, examine several examples across market capitalization, profitability, and derivatives positioning, and show what continuity-adjusted indices reveal relative to raw aggregates.

What are Glassnode Global Metrics?

Global Metrics are aggregated on-chain and market metrics computed across multiple cryptocurrencies, organized into configurable baskets. Baskets can be defined by market capitalization thresholds, top-N rankings (by any metric), or asset tags (sectors, categories). They solve a fundamental challenge in crypto analytics: how to track on-chain and market metrics across a highly dynamic group of assets over time without artificial discontinuities caused by basket composition changes, in contrast to indices that focus on price alone.

We provide two output types for each metric:

  • Raw Aggregates: True values in original units preserving economic meaning (e.g., USD for market cap, counts for active addresses)
  • Indices: Scaling-factor-adjusted, base-normalized time series for trend analysis and cross-basket comparison

What the indices reveal

Market structure: the 2024 small-cap surge

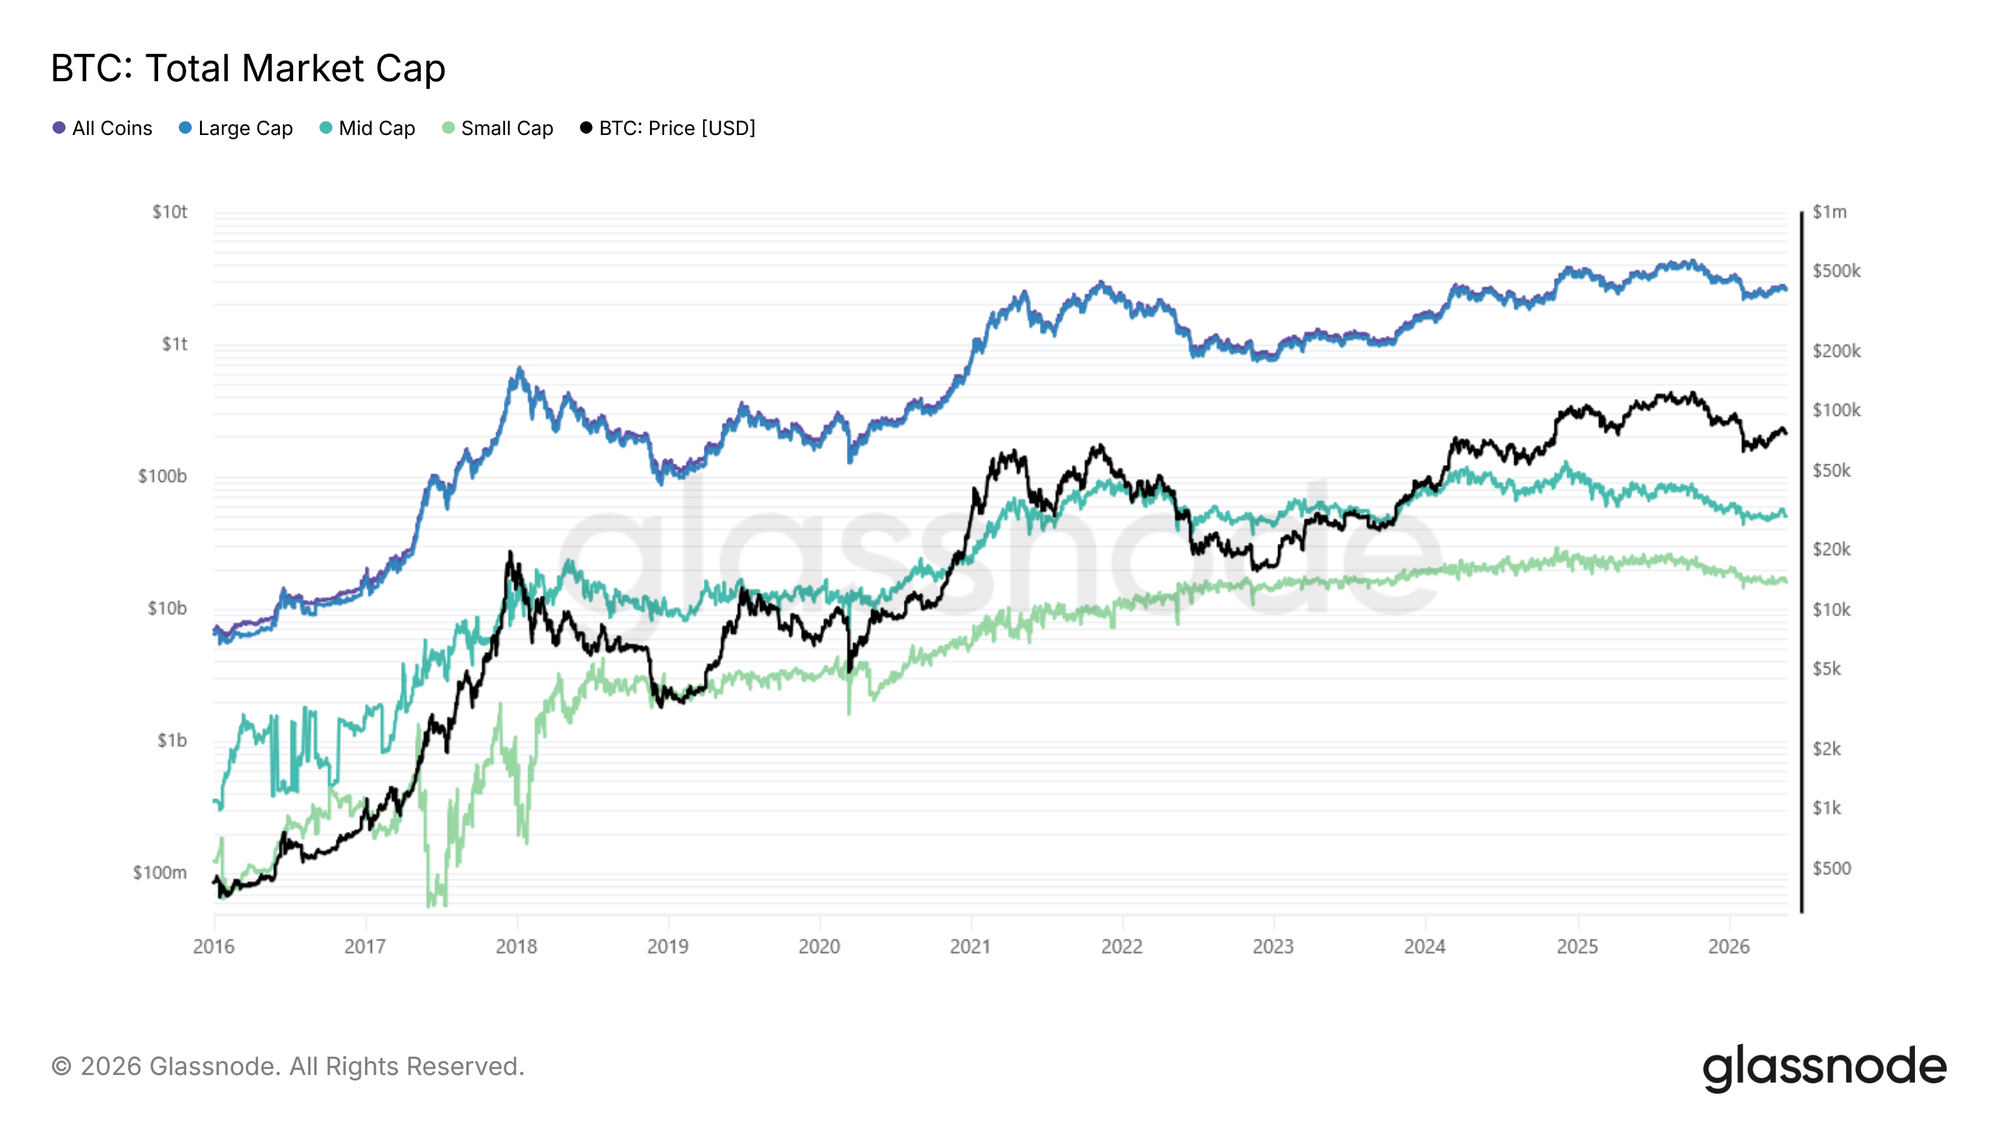
The clearest demonstration of why continuity-adjusted indices matter is the small-cap tier in 2024. The below figure presents Total market cap: Raw aggregate (USD, log scale) across all four baskets: All Coins, Large, Mid and Small Cap, with BTC price overlaid.
View Live Metric

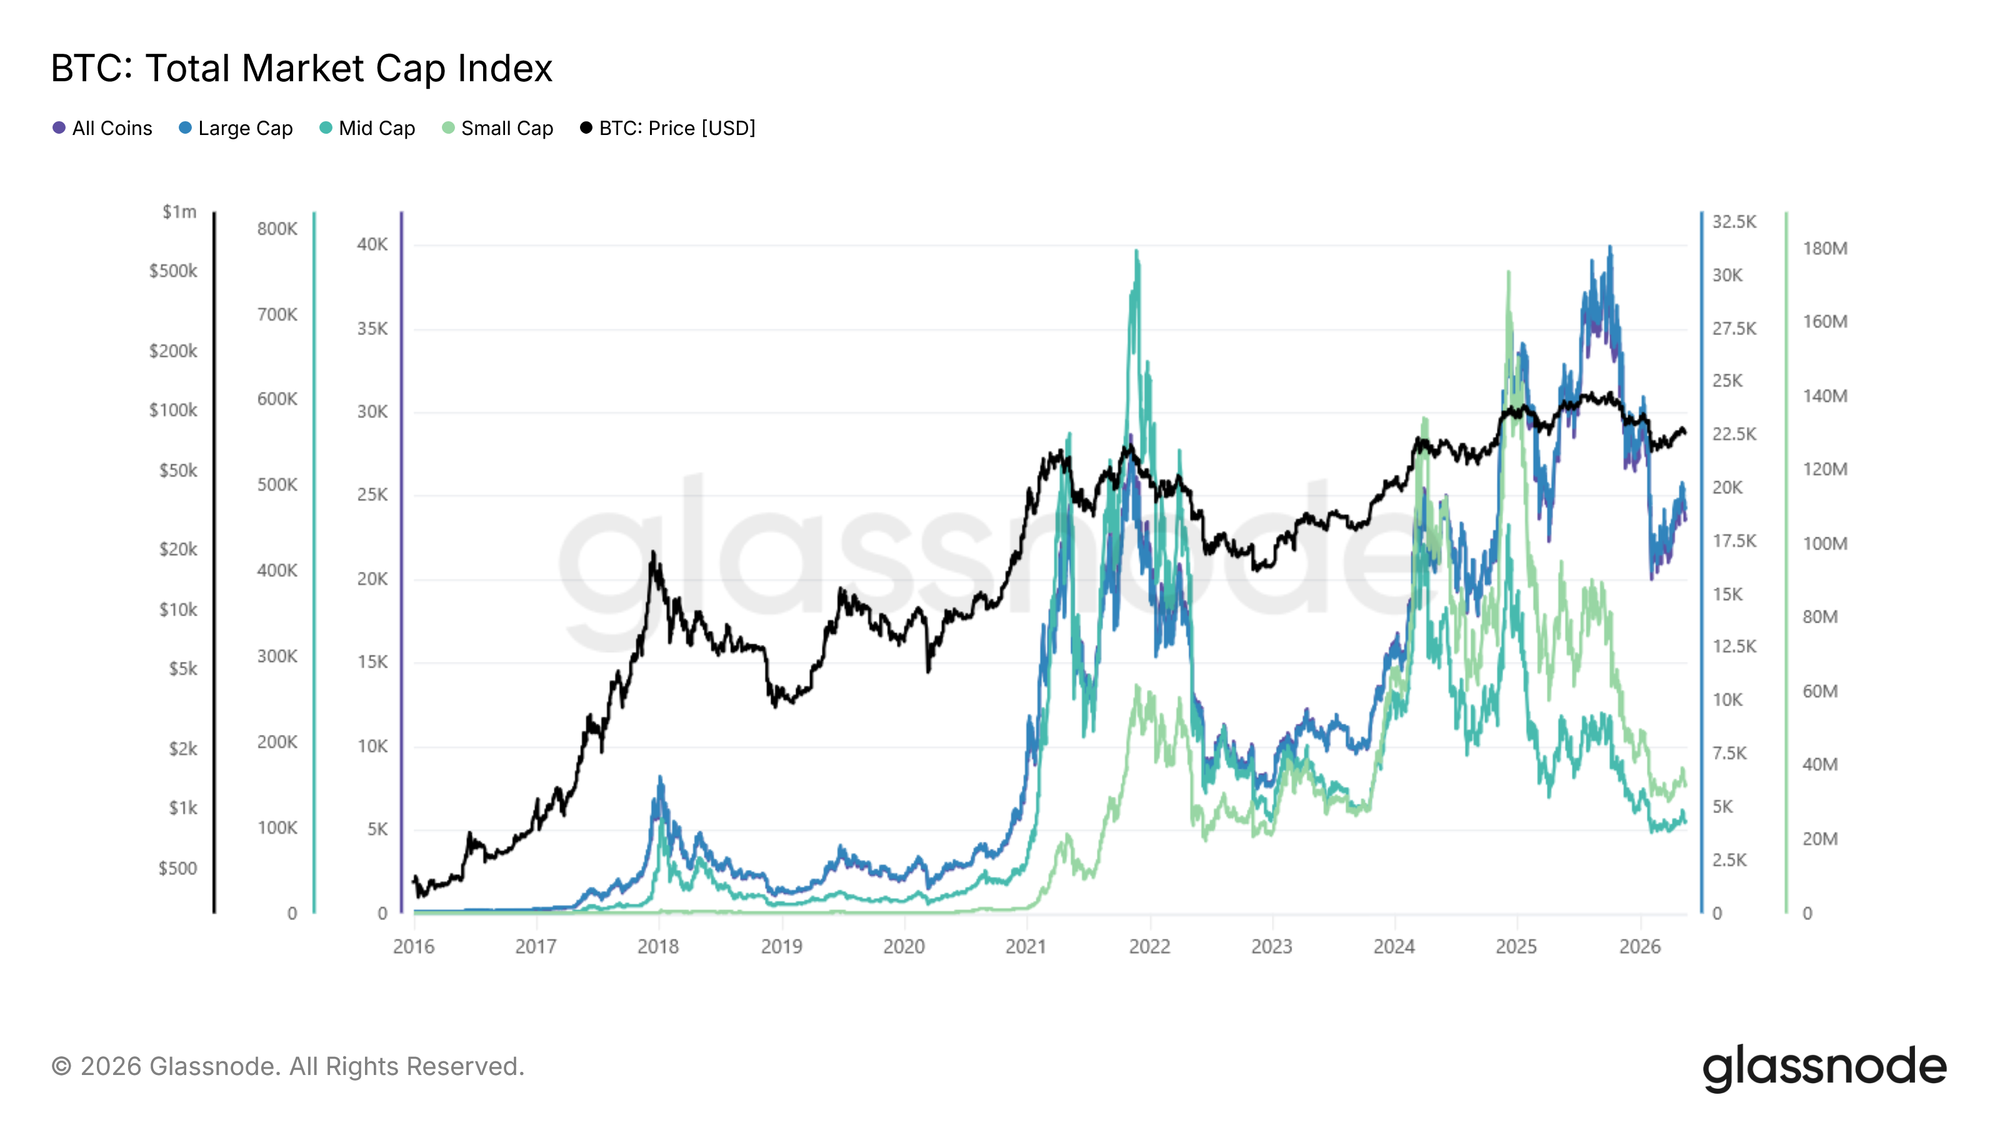
Compare to the Total market cap index across all four baskets: Scaled index (base 100), same baskets. Each tier starts at 100, hence the lines are directly comparable as growth multiples.
View Live Metric

The raw small-cap series contains a structural bias: whenever a small-cap asset performs well, it eventually crosses the $100M threshold and leaves the basket, taking its gains with it. In other words, "winners leave". The raw aggregate is, by design, incapable of capturing a small-cap rally.

The index neutralizes this effect. Small-cap shot up dramatically in 2024, a move largely invisible in the raw series, driven by near-instant token creation platforms and the memecoin mania that followed.

The same chart also highlights the divergence across tiers: while large caps held up relatively well, altcoin tiers entered a prolonged drawdown. Both halves only become legible in the index.

Profit-taking Sentiment: Altcoin SOPR vs BTC SOPR

Spent Output Profit Ratio (SOPR), which measures whether coins moving on-chain are being spent at a profit (above 1) or a loss (below 1), is one of the clearest cases where a global metric adds value beyond the single-asset version. BTC SOPR and the median SOPR across altcoin baskets frequently diverge, and the spread between them becomes a signal in itself.

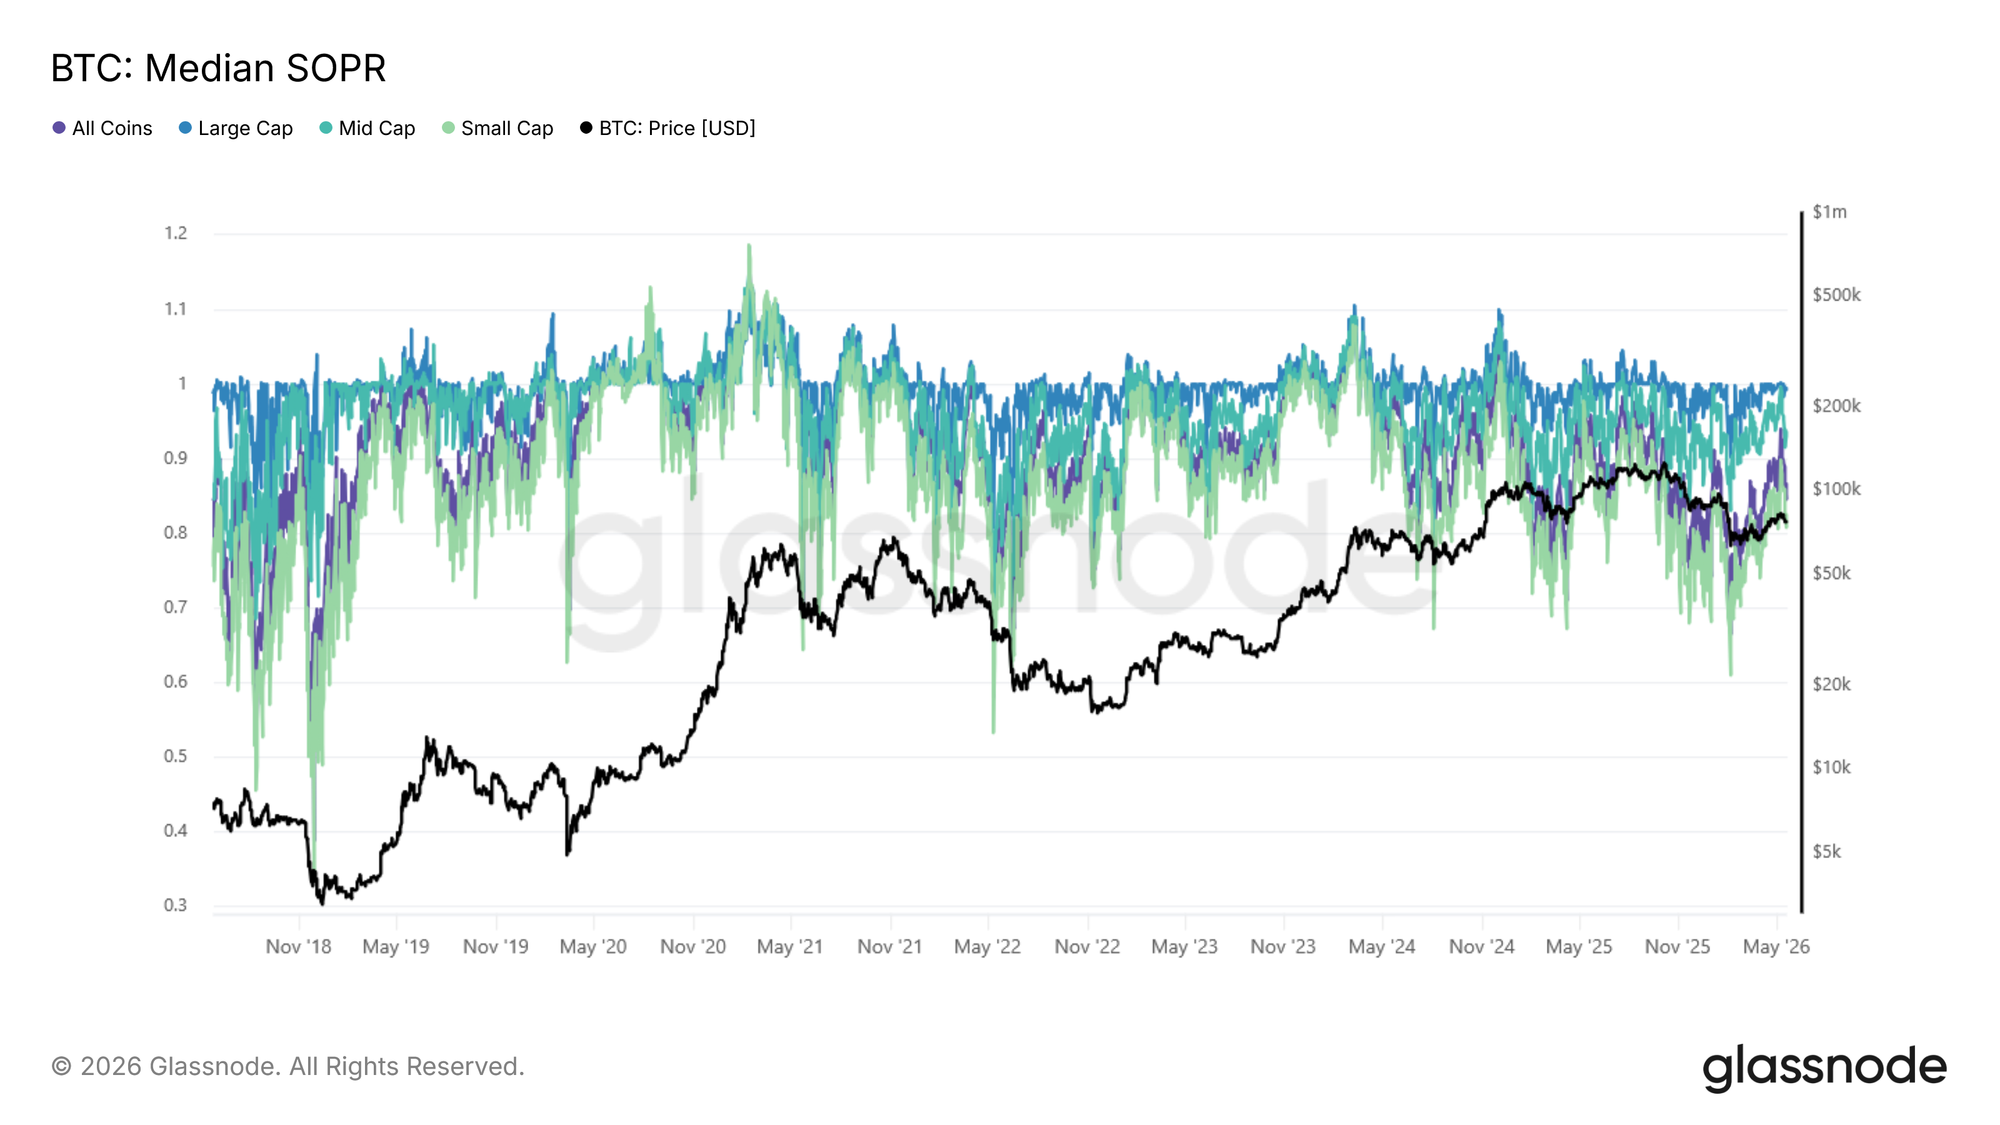
The following figure shows Median SOPR: Raw aggregate across all four baskets, BTC price overlaid. SOPR oscillates around 1.
View Live Metric

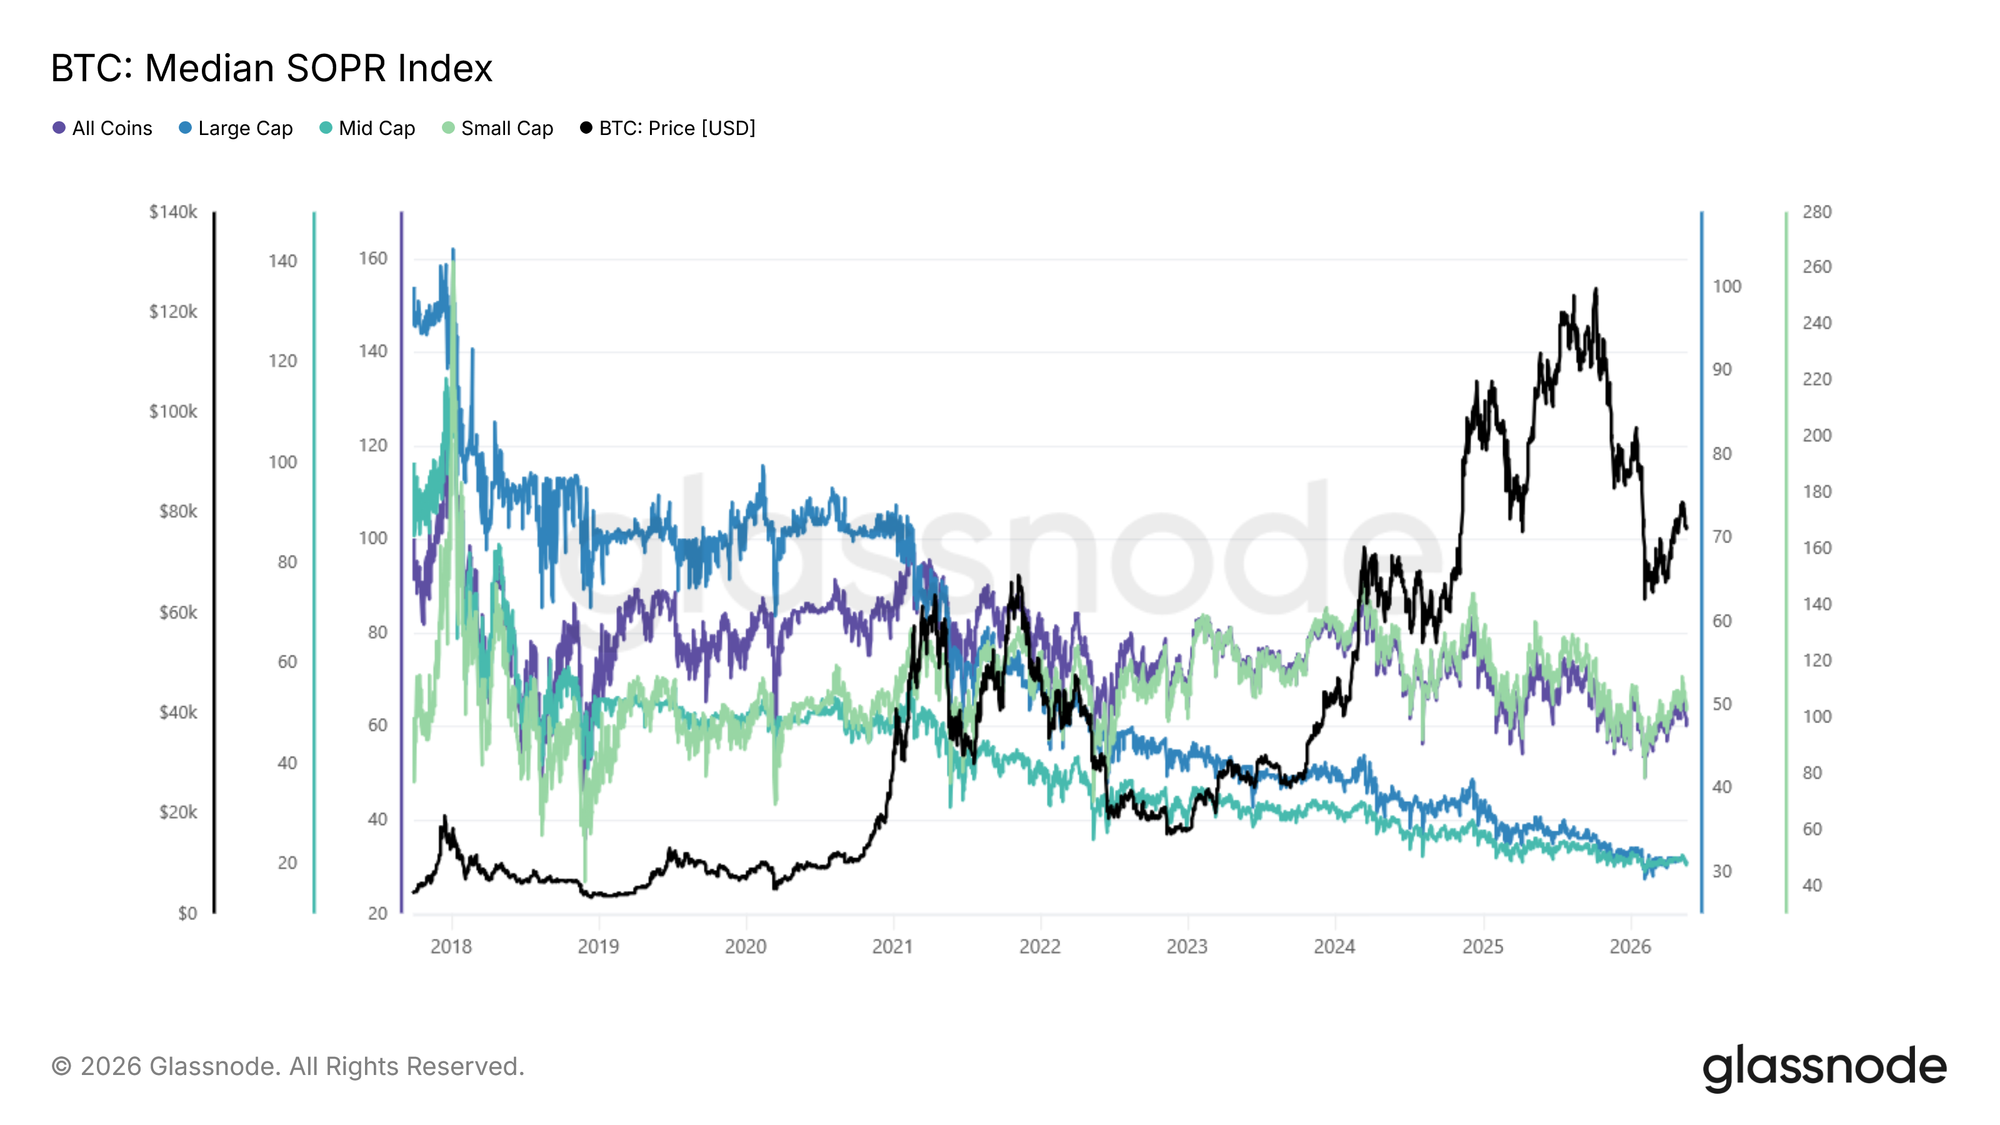
Compare to the Median SOPR: Scaled index (base 100), across the same four baskets.
View Live Metric

The raw series tells the following story: small-cap SOPR crashes to levels comparable to the 2018 and 2022 bear markets, while large and mid caps have held up better in recent cycles. The index adds an additional nuance: because appreciated small-cap coins keep leaving the basket as they grow into higher tiers, the raw series overstates how bad sentiment is for the assets that actually remain.

The raw series tells the following story: small-cap SOPR crashes to levels comparable to the 2018 and 2022 bear markets, while large and mid caps have held up better in recent cycles. The index adds an additional nuance: Because appreciated small-cap coins keep leaving the basket as they grow into higher tiers, the raw series overstates how bad sentiment is for the assets that actually remain.

Adjusted for this, small-cap sentiment is more stable than it appears. For large and mid caps no such correction applies, and what the index reveals is a genuine long-term trend: each cycle, the average holder in established assets extracts slightly less profit than the one before. As more supply locks into long-term holding, less of it cycles through at a profit.

Rather than relying on selected tokens as proxies for altcoin sentiment, the global SOPR index provides a cohort-level read directly. No need to cherry-pick individual tokens.

Derivatives Positioning: Open Interest

Open Interest (OI) measures the total value of outstanding perpetual futures contracts and provides a useful proxy for leverage concentration across the market.

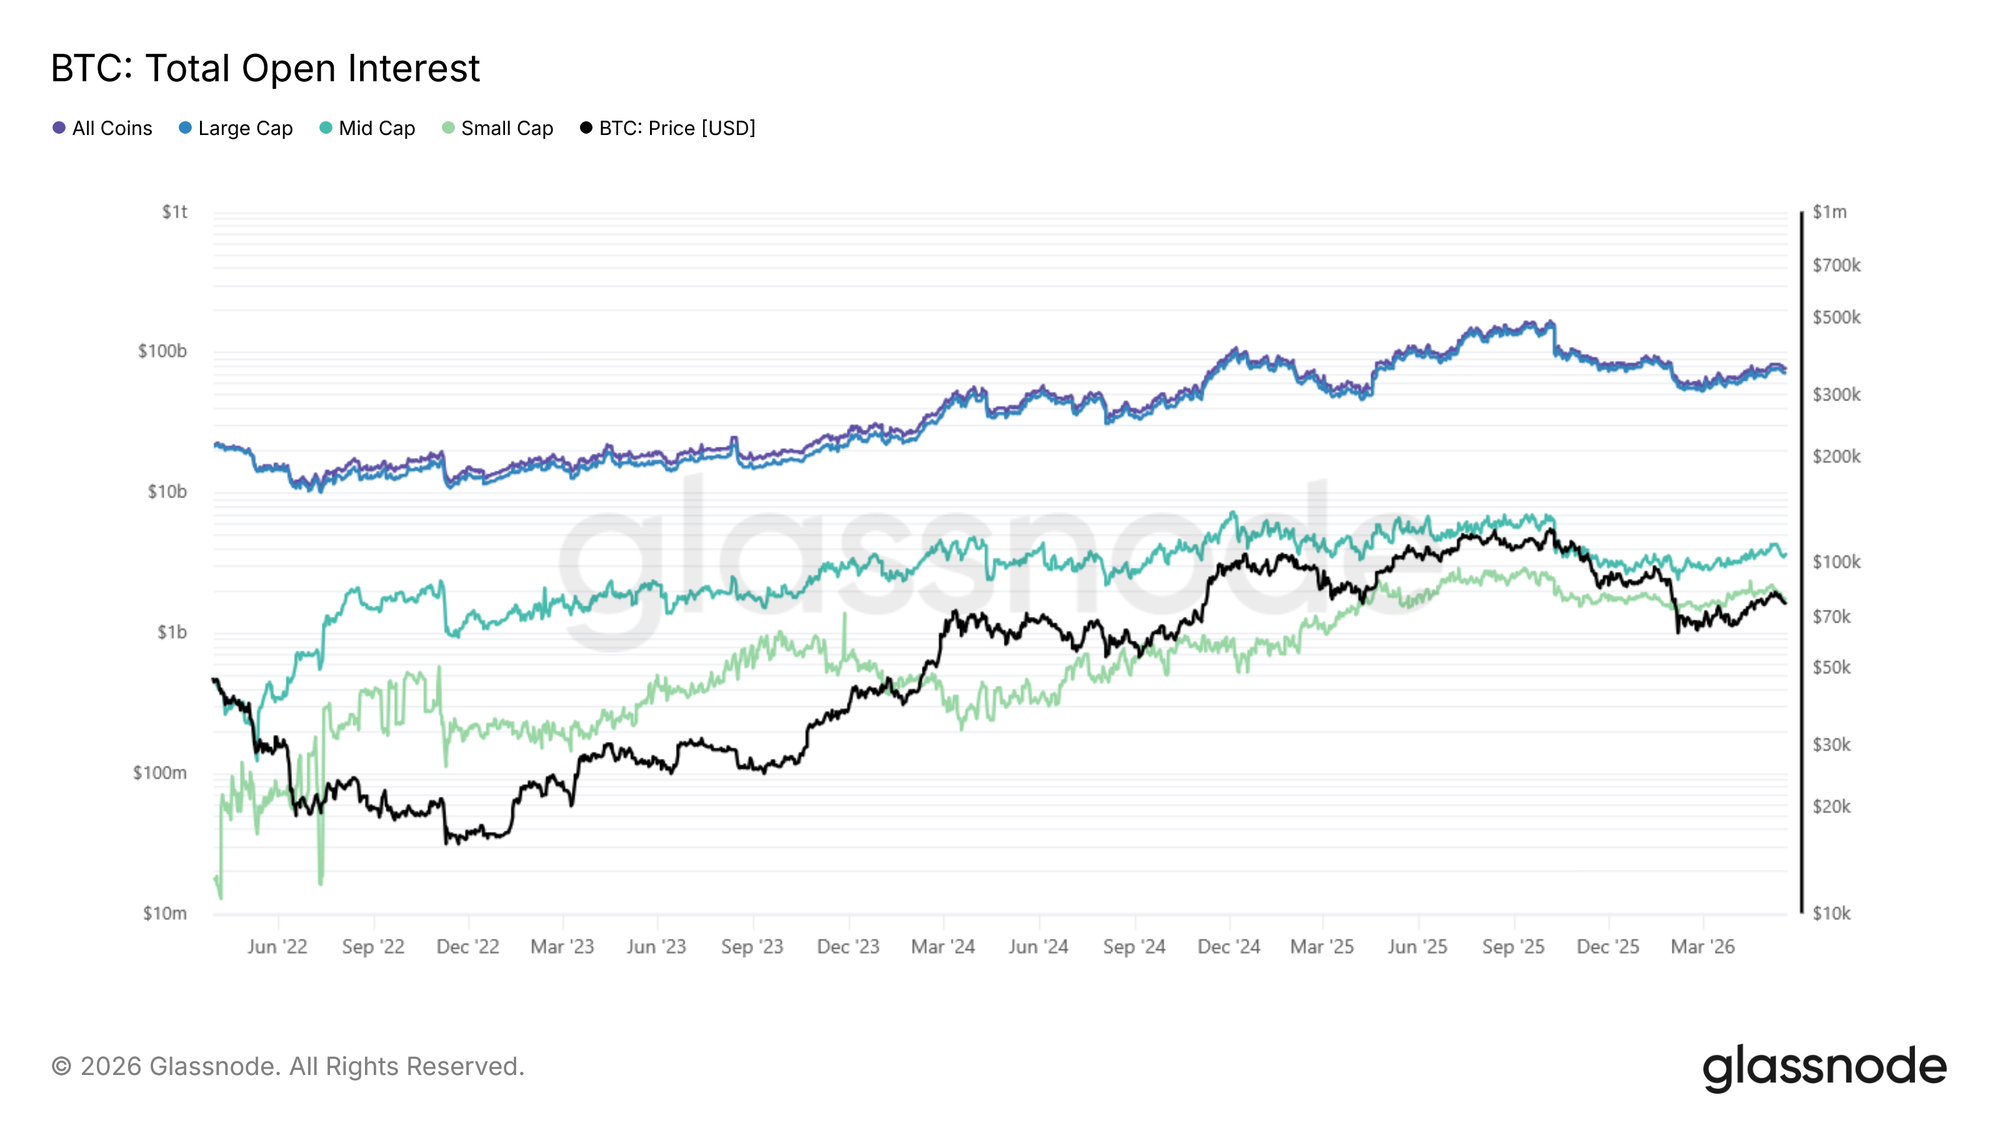
The below figure presents Total Open Interest: Raw aggregate (USD, log scale) across all four baskets, data from 2022.
View Live Metric

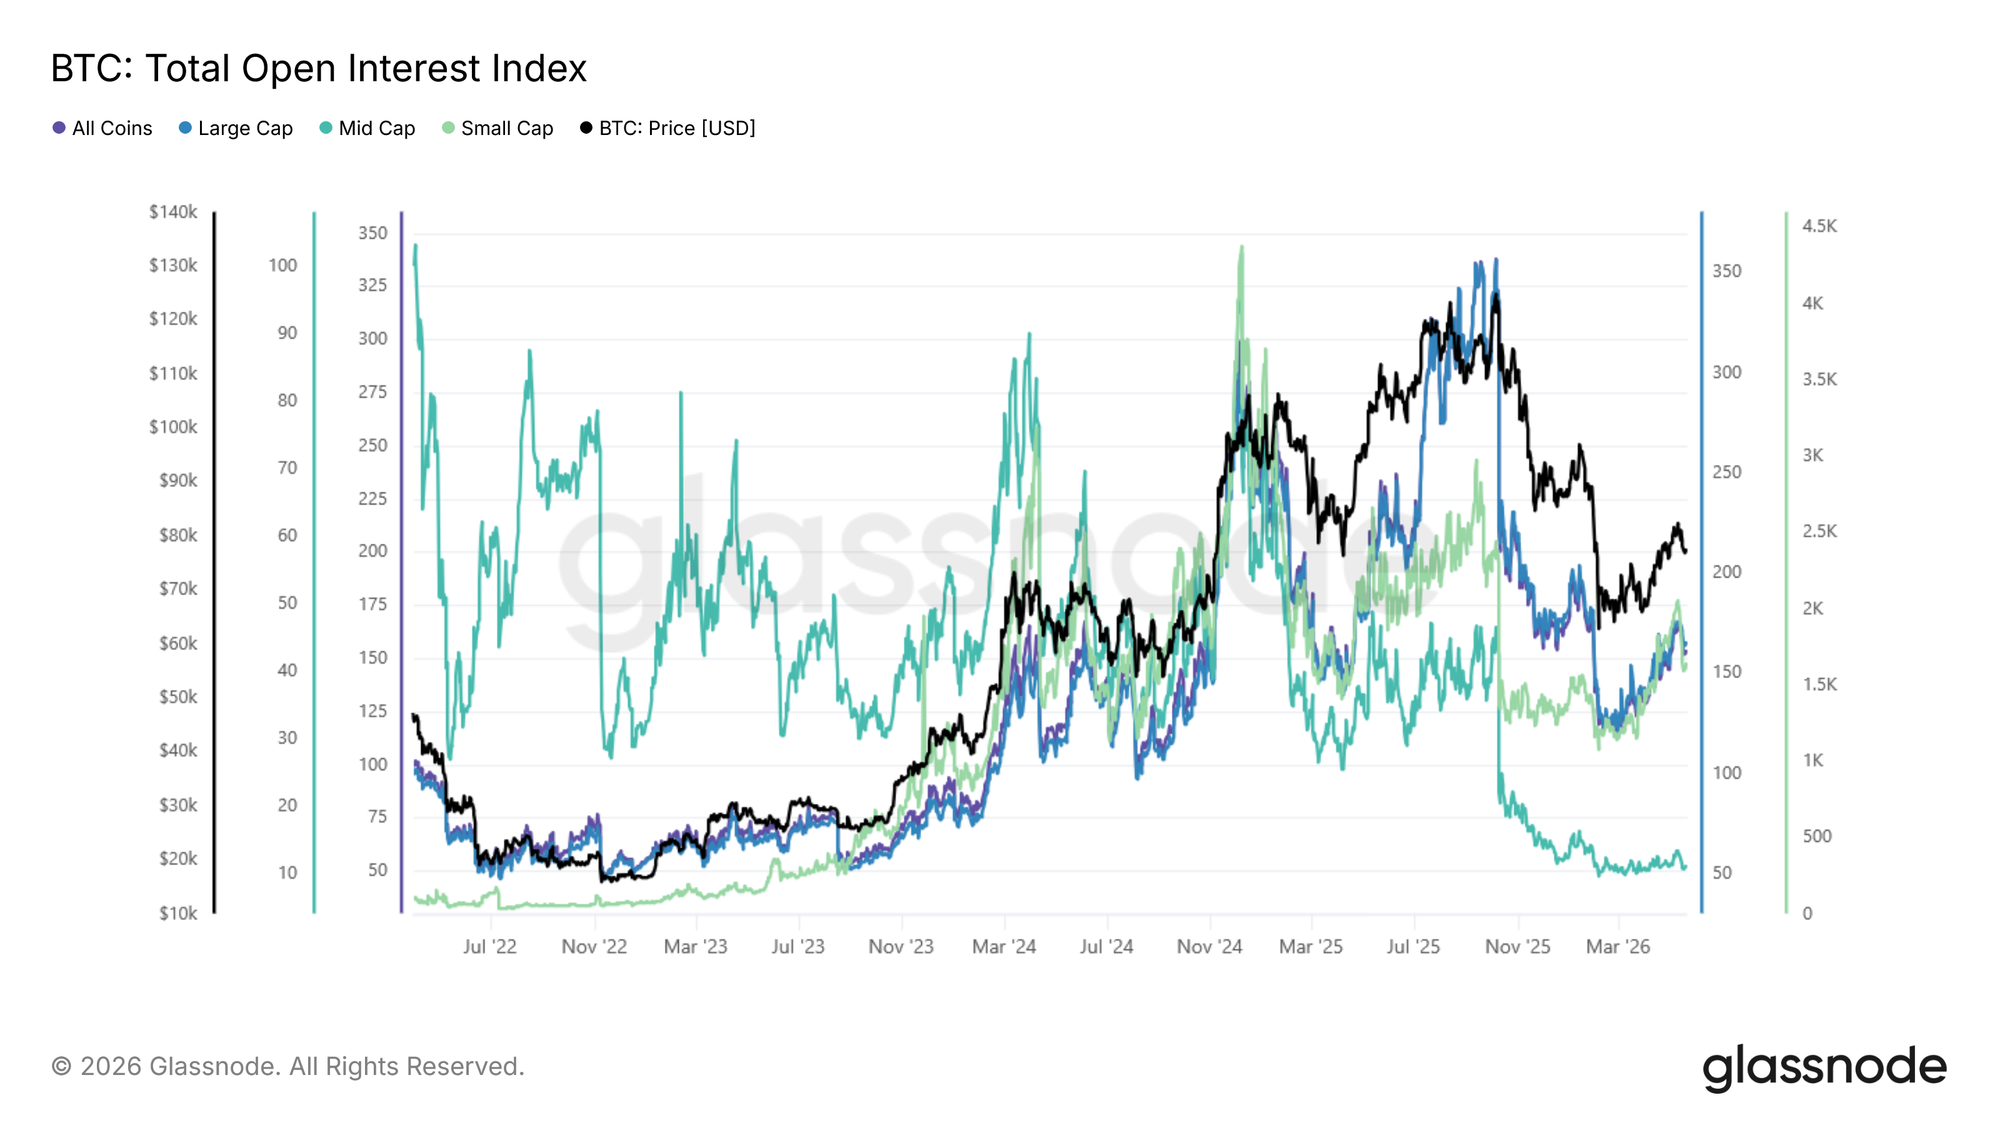
Compare that to the Total Open Interest Index: scaled (base 100) across the same four baskets.
View Live Metric

Large cap dominates open interest in absolute terms; most leverage sits on the biggest, most liquid assets. The index, however, makes the behavior of the smaller tiers comparable: mid- and small-cap open interest is far more volatile, spiking sharply during speculative episodes and unwinding just as fast. These spikes are a useful early-warning signal for cascade risk in the more fragile parts of the market.

The continuity-adjusted framework makes these shifts easier to isolate by separating changes in leverage behavior from changes in cohort composition.

The Glassnode Global Metric Suite

Four metrics are live with this release, each computed for all four baskets, sixteen time series in total. All use weekly rebalancing and equal weighting.
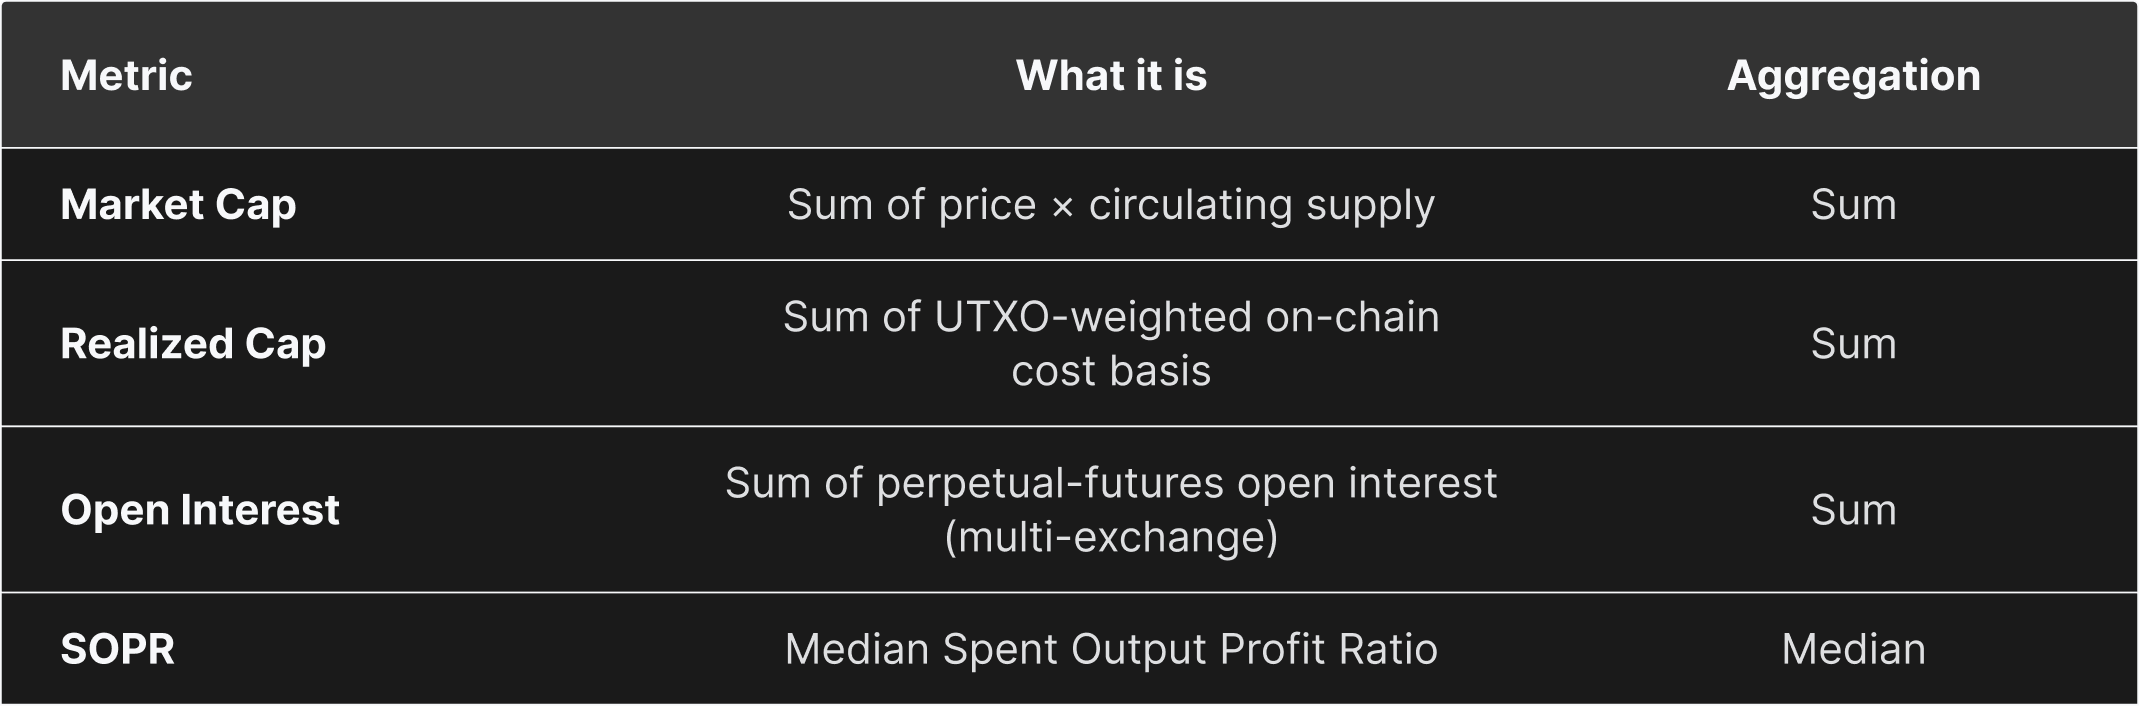
The baskets are the market-cap tiers used throughout this paper:

  • All Coins (no filter)
  • Large Cap (≥$1B)
  • Mid Cap ($100M–$1B)
  • Small Cap (<$100M).

Eligibility filtering, start dates, and the choice of sum versus median aggregation are covered in the appendix.

Accessing the Data via API

Each metric is published in two forms. 1) The raw aggregate preserves the original units (discontinuous at rebalances) and is intended to use for absolute sizing and point-in-time snapshots. 2) The index is scaled, base-100, and continuous, making it more suitable for trend analysis and cross-basket comparison.

Raw and index versions are served from separate endpoints, and each endpoint returns all baskets for that metric:

https://api.glassnode.com/v1/metrics/global/{metric}_{aggregation}_{rebalancing}_{weighting}_raw
https://api.glassnode.com/v1/metrics/global/{metric}_{aggregation}_{rebalancing}_{weighting}_index
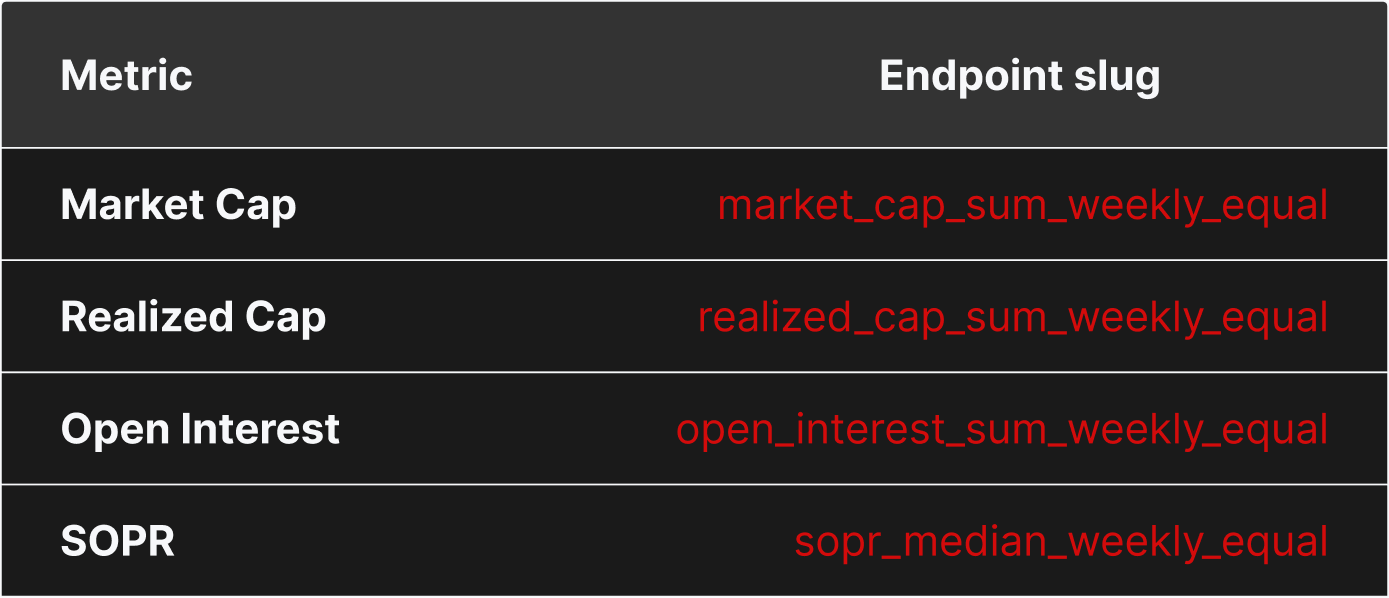
For full request details, please see the Glassnode API documentation. The framework is extensible (additional metrics, alternative weightings, and tag-based sector baskets are planned), but the four metrics above are live today, and they already bring the continuity discipline of traditional price indices to on-chain and market data for a market that is increasingly multi-asset.

Methodology

Full details on basket selection, eligibility filtering, scaling-factor formulas, and index normalization, please reach out to your account manager for access.


  • Follow us on X for timely market updates and analysis
  • Join our Telegram channel for regular market insights
  • For on-chain metrics, dashboards, and alerts, visit Glassnode Studio

Disclaimer: This report is for informational and educational purposes only. The analysis represents a limited case study with significant constraints and should not be interpreted as investment advice or definitive trading signals. Past performance patterns do not guarantee future results. Always conduct thorough due diligence and consider multiple factors before making investment decisions.


Related Questions

QWhat is the core problem in aggregate market analysis of digital assets that the Glassnode Global Metrics Suite aims to solve?

AThe core problem is the structural discontinuities in aggregate metric series caused by the dynamic nature of the crypto market, where assets frequently appreciate, decline, launch, or disappear. This makes long-term trend analysis difficult when using simple raw aggregates.

QWhat are the two types of outputs provided for each Glassnode Global Metric?

AGlassnode provides two output types: 1) Raw Aggregates, which are true values in original units (e.g., USD, counts) that preserve economic meaning but can be discontinuous. 2) Indices, which are scaling-factor-adjusted, base-normalized time series designed for continuous trend analysis and cross-basket comparison.

QUsing the 2024 small-cap surge as an example, why does the 'raw aggregate' of total market cap fail to capture the rally, and how does the 'index' correct for this?

AThe raw aggregate fails because it has a 'winners leave' structural bias. When a small-cap asset performs well and crosses the $100M market cap threshold, it leaves the small-cap basket, taking its gains with it. The index neutralizes this effect by applying continuity adjustments, allowing it to reveal the dramatic 2024 small-cap surge driven by token creation platforms and memecoin mania, which was largely invisible in the raw series.

QHow does the Global SOPR (Spent Output Profit Ratio) index provide a more nuanced view of profit-taking sentiment, particularly for the small-cap cohort, compared to the raw series?

AThe raw SOPR series overstates negative sentiment for small-cap assets because appreciated coins leave the basket as they grow, making the remaining basket appear worse. The index corrects for this composition change, revealing that small-cap sentiment is more stable than it appears. For large/mid caps, the index shows a genuine long-term trend of decreasing average profit realization per cycle as more supply is held long-term.

QAccording to the article, what key insight does the Open Interest Index reveal about leverage behavior in different market-cap tiers that the raw aggregate obscures?

AWhile the raw aggregate shows large caps dominate Open Interest in absolute value, the index makes the behavior of smaller tiers comparable. It reveals that mid- and small-cap open interest is far more volatile, with sharp spikes during speculative episodes and rapid unwinds. These volatility spikes act as an early-warning signal for cascade risk in more fragile market segments, a insight obscured by composition changes in the raw data.

Related Reads

The Truth About Global Payments, Exposed by Airwallex

Airwallex's founder, Jack Zhang, outlines the three primary paths in the global payments industry and explains why the company chooses the most demanding one: building its own global financial infrastructure. The article begins by highlighting a common industry problem: payment platforms appear homogenized on the surface, offering similar features like global acquiring and multi-currency accounts. However, their underlying capabilities differ vastly. Customers truly care about payment stability, compliance robustness, and reliable market entry support. Zhang identifies three strategic paths: 1. **Bypassing Traditional Systems (Web3/Crypto):** This path promises efficiency via stablecoins and blockchain settlement but struggles with mainstream adoption, significant regulatory friction, and a lack of competitive edge against established players, often leaving it with niche or non-compliant markets. 2. **Packaging Existing Infrastructure:** The most common route, where companies layer a modern interface over legacy banking and partner networks. While enabling fast expansion, it fails to solve core issues like dependency on correspondent banks and intermediary risk, merely postponing the need for solid foundations. 3. **Building Own Global Infrastructure:** The path chosen by Airwallex, Ant International, and others. It involves obtaining local licenses, establishing direct regulatory relationships, building local teams, and controlling the full technology stack. This "heavy" approach is slow and capital-intensive but aims to internalize complexity, providing customers with a "lighter" experience. The core argument is that for business clients, the highest cost isn't transaction fees but hidden risks like frozen accounts, payment delays, and regulatory shocks. By investing heavily in its own infrastructure, Airwallex seeks to absorb these complexities, offering customers greater stability, cost savings (beyond fees), and long-term certainty. This foundational investment, though initially slow, enables compound growth, as evidenced by Airwallex's accelerated revenue scaling. In conclusion, while shortcuts enable faster growth, mastering the most difficult aspects—owning the underlying infrastructure—creates durable value for customers and sustainable advantage for the payment provider.

marsbit2h ago

The Truth About Global Payments, Exposed by Airwallex

marsbit2h ago

The Truth About Global Payments, Revealed by Airwallex

The article discusses Airwallex's approach to global payments, highlighting the key challenges and different strategic paths in the industry. It begins by addressing common user questions about platform reliability, cryptocurrency payments, and the necessity of Airwallex's "heavy" infrastructure model. The core argument is that while many payment platforms appear similar on the surface—offering features like global acquiring and multi-currency accounts—their underlying capabilities differ drastically. The piece identifies three primary paths for global payment providers: 1. **Bypassing Traditional Infrastructure (Web3/Crypto):** This path promises efficiency through stablecoins and on-chain settlements but faces significant regulatory hurdles and offers little advantage over established players for mainstream use, often serving only niche or non-compliant markets. 2. **Aggregating/Packaging Existing Infrastructure:** The most common route, where companies layer a better user experience over legacy banking and partner networks. While fast to market, this approach does not solve fundamental issues like dependency on intermediaries, correspondent banking risks, and compliance fragility. 3. **Building Proprietary Global Infrastructure:** The path chosen by Airwallex and similar firms. This involves obtaining local licenses, building direct regulatory relationships, establishing local teams, and controlling the compliance and technology stack. This is the most difficult and capital-intensive route but aims to internalize complexity. Airwallex's strategy of "heavy" investment in its own infrastructure is framed not as inefficiency, but as a long-term bet to provide clients with greater stability, cost savings beyond fees, and certainty. The platform's "heaviness" absorbs risk and operational complexity, aiming to deliver a "lighter" experience for business customers. The article concludes that in global payments, while shortcuts enable faster growth, mastering the most difficult aspects—the underlying infrastructure—is what creates durable value for clients and sustainable competitive advantage.

链捕手2h ago

The Truth About Global Payments, Revealed by Airwallex

链捕手2h ago

Trading

Spot
Futures
活动图片