US Crypto ETFs Record Best Month Yet With $13 Billion July Influx

bitcoinistDipublikasikan tanggal 2025-08-02Terakhir diperbarui pada 2025-08-03

Abstrak

There is no question that 2025 has been a good year—so far—for crypto exchange-traded funds (ETFs), garnering significant amounts of...

Trusted Editorial content, reviewed by leading industry experts and seasoned editors. Ad Disclosure

There is no question that 2025 has been a good year—so far—for crypto exchange-traded funds (ETFs), garnering significant amounts of capital every week. While the investment products struggled at the start of the year, as did most of the global financial markets, the United States ETF market had a remarkable performance in the past quarter.

Interestingly, July marked the start of another productive quarter for the crypto ETFs in the United States, with the investment products posting capital inflows in the month. According to the latest market data, July 2025 might be the best month yet for the digital asset-linked funds after registering tens of billions of dollars in capital influx in the 30-day period.

Crypto ETFs Outperform Vanguard’s S&P 500 Fund In July

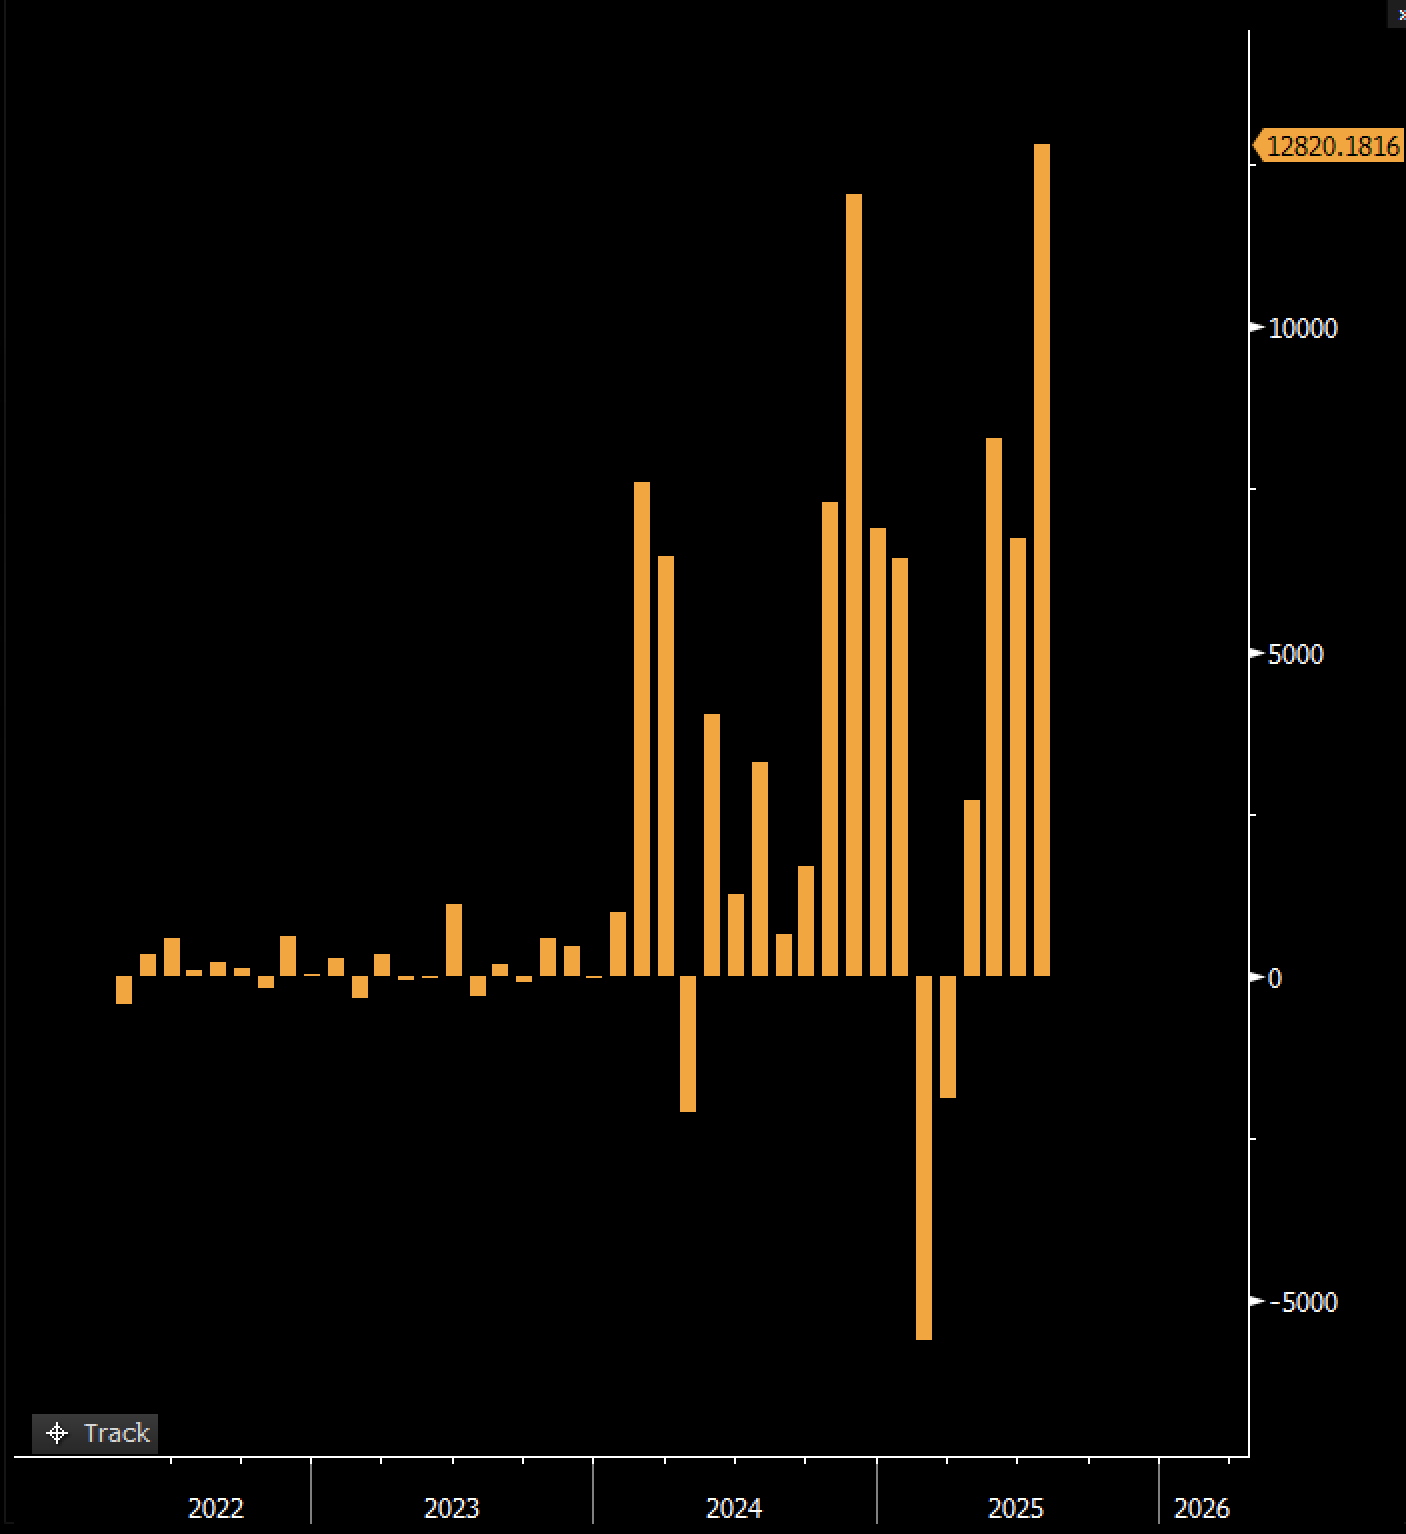
On Friday, August 1, Bloomberg ETF analyst Eric Balchunas took to the social media platform X to reveal that the US crypto ETF market just had its best monthly performance yet in July 2025. According to the latest market data, the investment products took in more than $12.8 billion in capital—at a pace of $600 million per day—in the past month.

To put into perspective, the pace of daily additions in July is about twice the average of the crypto exchange-traded funds. According to Balchunas, the digital asset-linked investment products outperformed every single ETF, including “the mighty VOO”—referring to Vanguard’s S&P 500 fund—over the past month.

Balchunas added:

Further, every ETF in category took in cash (ex the converted Trusts) w/ Bitcoin and Ether making equal contributions. Most all-around dominant performance since the Eagles ended the Chiefs in the Super Bowl. Will be hard to top.

crypto

Source: @EricBalchunas on X

The US crypto ETF market is led by the Bitcoin spot ETFs, with a total asset of over $146.48 billion currently under management. The Bitcoin ETF is completely dominated by BlackRock’s IBIT, which has its total assets under management (AUM) at over $84 billion, and is followed by Fidelity’s FBTC at almost $23 billion.

Meanwhile, the Ethereum spot exchange-traded funds, which launched more than 6 months after their BTC counterparts, have a total AUM of $20.1 billion. Unsurprisingly, BlackRock also leads this market, with its ETH ETF (ETHA) having a total of $10.71 billion in assets under management.

Crypto Market Cap Drops 5%

According to data from CoinGecko, the total crypto market capitalization stands at around $3.78 billion, having declined by 5% in the past 24 hours. On Friday, the crypto market succumbed to massive bearish pressure, with the top coins like Bitcoin, Ethereum, and Solana suffering major losses.

Crypto

The crypto total market cap on the daily timeframe | Source: TOTAL chart on TradingView
Featured image from iStock, chart from TradingView
Editorial Process for bitcoinist is centered on delivering thoroughly researched, accurate, and unbiased content. We uphold strict sourcing standards, and each page undergoes diligent review by our team of top technology experts and seasoned editors. This process ensures the integrity, relevance, and value of our content for our readers.

Opeyemi Sule is a passionate crypto enthusiast, a proficient content writer, and a journalist at Bitcoinist. Opeyemi creates unique pieces unraveling the complexities of blockchain technology and sharing insights on the latest trends in the world of cryptocurrencies. Opeyemi enjoys reading poetry, chatting about politics, and listening to music, in addition to his strong interest in cryptocurrency.

Bacaan Terkait

Pandangan: Penurunan Bitcoin 10% Bukan Karena Saylor Jual 32 BTC

Pada awal Juni, harga Bitcoin sempat turun 10% menjadi sekitar $66.000. Banyak yang menyalahkan penjualan 32 BTC (senilai $2,5 juta) oleh perusahaan Michael Saylor, MicroStrategy, namun volume ini terlalu kecil untuk memicu penurunan pasar senilai $200 miliar. Penyebab utama kemerosotan ini justru berasal dari tiga faktor: 1. **Penarikan Dana ETF Bitcoin AS**: Terjadi arus keluar bersih beruntun selama sekitar 13 hari, dengan total sekitar $4,4 miliar, mengurangi likuiditas di pasar spot. 2. **Kekhawatiran Likuidasi dari Mt.Gox**: Transfer 10.422 BTC (senilai $739 juta) dari wali amanat Mt.Gox memicu ketakutan akan tekanan jual potensial dari aset yang masih tertahan. 3. **Divestasi Aset Berisiko dan Persaingan Modal**: Modal risiko banyak mengalir ke aset AI dan teknologi besar (seperti Alphabet dan SpaceX), mengurangi minat pada aset kripto. Faktor-faktor ini melemahkan daya dukungan harga spot. Penurunan kemudian diperparah oleh **likuidasi posisi long bertingkat** di pasar derivatif, memicu terjadinya rush selling dan memperbesar penurunan harga dalam waktu singkat. Meski secara teknis Bitcoin mendekati level support penting dan berada dalam jangka waktu siklus historis yang rentan pembalikan tren, tekanan jual belum tentu berakhir. Pasar kripto masih memerlukan waktu untuk mencerna tekanan penjualan, terutama selama modal masih berprioritas pada sektor teknologi dan AI.

marsbit54m yang lalu

Pandangan: Penurunan Bitcoin 10% Bukan Karena Saylor Jual 32 BTC

marsbit54m yang lalu

XRP menampilkan sinyal beli teknis langka setelah berminggu-minggu mengalami penurunan – Apa yang berbeda kali ini?

XRP menunjukkan sinyal beli teknis langka dari indikator SuperTrend untuk pertama kalinya sejak pertengahan Juni, membangkitkan optimisme setelah pekan-pekan tekanan penurunan. Sinyal ini mengikuti fase korektif yang berkepanjangan dan mencerminkan pola yang sebelumnya mendahului reli harga 14%. Data on-chain Santiment mengungkapkan rasio MVRV 30-hari dan 365-hari XRP terjun ke level terendah sejarah, masing-masing -45% dan -47%, menunjukkan baik pemegang jangka pendek maupun panjang mengalami kerugian signifikan. Kondisi ekstrem ini, yang sering muncul setelah periode kapitulasi, justru dapat meningkatkan profil risk-reward jangka panjang dengan mengurangi tekanan jual. Namun, kekhawatiran muncul dari rasio NVT (Network Value to Transactions) yang melonjak 470,92% menjadi 194,71 dalam 24 jam, mengindikasikan valuasi pasar meningkat lebih cepat daripada aktivitas transaksi dasar. Ini menandakan pemulihan harga mungkin belum didukung oleh peningkatan penggunaan jaringan yang kuat. Secara teknis, XRP berhasil mempertahankan level support kunci di $1,0385 dan mencatatkan perdagangan di sekitar $1,1014. Indikator MACD pada grafik harian menunjukkan perbaikan dengan garis MACD melintas di atas garis sinyal, menandakan melemahnya tekanan bearish. Untuk mengonfirmasi tren bullish yang lebih luas, XRP perlu menembus resistan utama di level $1,2352.

ambcrypto1j yang lalu

XRP menampilkan sinyal beli teknis langka setelah berminggu-minggu mengalami penurunan – Apa yang berbeda kali ini?

ambcrypto1j yang lalu

Trading

Spot
活动图片