Capitulation Metrics: Using Cost Basis Distribution to Derive the On-Chain Bottom Signal

insights.glassnodeDipublikasikan tanggal 2025-03-02Terakhir diperbarui pada 2025-03-03

In our previous article on the practical applications of the Cost Basis Distribution metric (CBD), we explained the concept of cost basis lines to show how investors increase or decrease their cost-basis.

This week, we’ll look at how sharp shifts in supply at certain price levels reflect investors throwing in the towel - often a key indicator of a local market bottom.

Cost Basis Distribution - A Quick Recap

CBD reflects the total supply held by addresses with an average cost basis within specific price buckets. This, in effect, gives a clearer view of how investors’ cost bases shift over time due to buying or selling activity and allows mapping out the behaviour of market participants over time.

Tracking these upward and downward shifts helps us understand not only the sentiment behind buying and selling decisions, but also potential inflection points, where the market might pivot.

💡
Our Heatmap Dashboard now provides in-depth insights across hundreds of tokens. Access it here.

How to read CBD Heatmaps:

  • Color Intensity (Supply Distribution): A color scale - from cooler shades (lower supply) to warmer shades (higher supply) - shows where the token supply is concentrated. Example: A red band means a high supply at that particular price range. A green or blue band indicates a smaller supply.
  • Vertical Axis (Cost Basis): Each horizontal “slice” corresponds to a price range at which some portion of the token supply last moved.

The Psychology of Market Bottoms: A Hypothesis

Market behavior is often shaped by the intense psychological pressure experienced by investors who are deeply underwater on their positions. Across various assets - such as Uniswap (UNI), Maker (MKR), and AIOZ analyzed below - we frequently observe that holders with significant unrealized losses tend to capitulate near local or global bottoms.

This pattern suggests that forced selling, driven by emotional and financial distress, plays a key role in shaping market reversals.

Visualizing Capitulation in Action

Uniswap: Supply Redistribution at Local Bottoms

The Uniswap chart below illustrates a common CBD trend:

  • Supply originally accumulated near the $15 peak gradually shifts from warmer to cooler colors over time.
  • This color transition visually represents distressed investors selling their holdings at lower prices - a classic sign of capitulation.
  • As this supply changes hands at depressed levels, it often finds buyers willing to step in, potentially forming a local bottom.
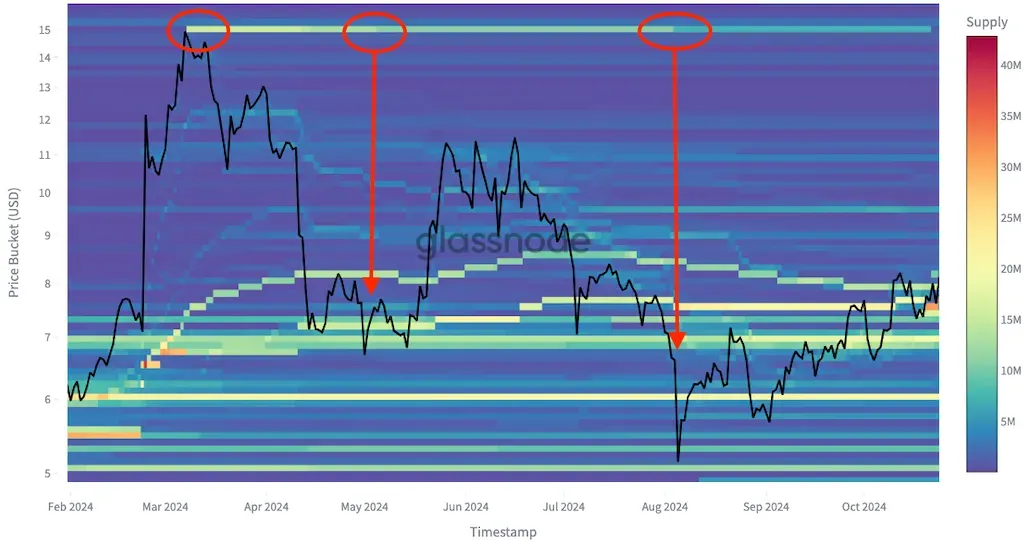
Supply originally created at $15 gets gradually distributed as prices trend lower.

Maker: Repeating the Pattern

A similar pattern emerges with Maker (MKR):

  • Supply that was previously accumulated at a local top is eventually capitulated at lower price levels.
  • As market participants under extreme pressure liquidate their positions, we again see a turning point forming - suggesting that capitulation often coincides with local bottom formation.
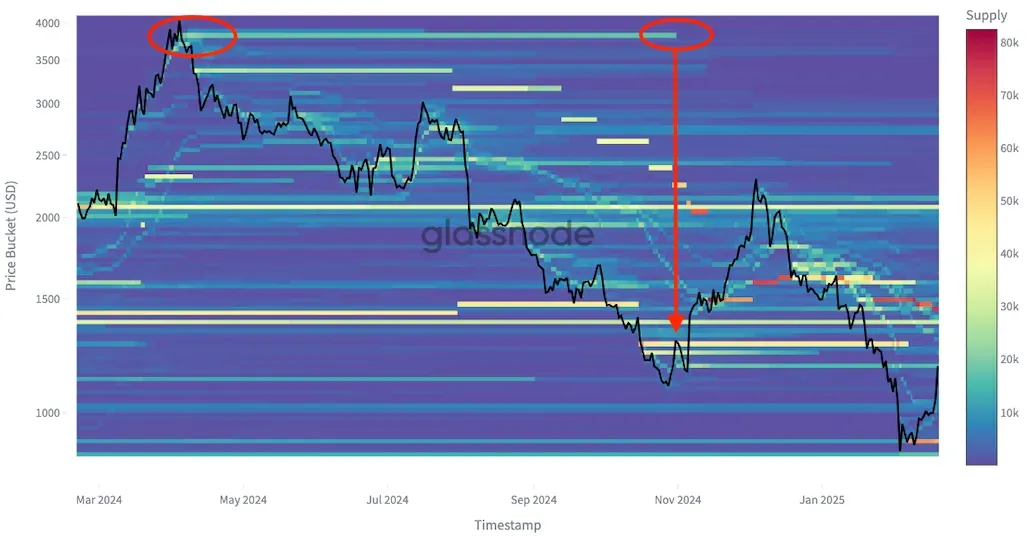
MKR supply accumulated during April 2024 local top is capitulated during Nov bottom

AIOZ: From Confidence to Capitulation

Initially, AIOZ holders appeared confident near the $1 mark, steadily accumulating as prices hovered around a local peak. However, as the market began to decline, sentiment shifted dramatically:

  • A wave of selling emerged, with investors gradually offloading their positions at each successive price drop.
  • This progressive unwinding reflects a classic capitulation phase, where financial and emotional strain lead investors to "throw in the towel."
  • As forced selling exhausts itself, market conditions may stabilize, potentially setting the stage for a turning point.
Progressive unwinding of a large supply cluster during a bottom

This pattern highlights the psychological cycles at play in the market - confidence at the top, distress-driven selling at the bottom, and eventual opportunities for contrarian buyers.

Why This Matters

Understanding these cycles of forced selling helps us identify potential inflection points in the market. When capitulation reaches its peak, supply transitions from weak hands to stronger hands, creating opportunities for contrarian buyers who recognize the psychological dynamics at play.

By tracking these behavioral shifts, we can gain a deeper understanding of how and when local bottoms might form across different assets.

Identifying Local Bottoms: A Data-Driven Approach

Market bottoms are often formed during periods of extreme distress - when forced selling reaches its peak and exhausted sellers finally capitulate. By identifying these zones of maximum pain, we can better understand where local bottoms might emerge.

To quantify this dynamic, we introduce a capitulation metric based on Cost Basis Dynamics (CBD) data. This metric aims to measure investor pain more accurately than traditional realized loss indicators.

Constructing the Capitulation Metric

Our approach to defining capitulation incorporates three key elements:

1. Weighted Sell Volumes

Not all losses are felt equally. A trader selling at a 50% loss experiences significantly more financial and emotional pressure than one selling at a 10% loss. To account for this, we apply a quadratic function to the difference between the average cost basis and the current market price. This weighting system amplifies severe losses, making them more prominent in our metric.

2. Smoothing for Clarity

Market data is noisy, and short-term fluctuations can obscure meaningful trends. To filter out this noise, we apply a 7-day exponential moving average (EMA) to the weighted sell volumes, allowing us to focus on sustained periods of distress rather than isolated events.

3. Non-Linear Economic ‘Pain’

Traditional realized loss metrics treat all losses proportionally in nominal terms. However, in reality, investors experience losses non-linearly—a deep drawdown feels exponentially worse than a minor dip. Our capitulation metric adjusts for this by emphasizing larger losses through quadratic weighting, better capturing the psychological burden of extreme sell-offs.

Visualizing Capitulation: What the Data Reveals

When plotted in red, the capitulation metric frequently spikes near major price lows, shown in blue. We observe this pattern consistently across a selection of cryptocurrencies, including Uniswap (UNI), Maker (MKR), MATIC, and LINK.

These spikes indicate moments when heavily underwater investors finally capitulate - selling at deep losses, often in response to panic or liquidations. Historically, such points have often marked local bottoms, presenting potential buying opportunities for risk-tolerant investors.
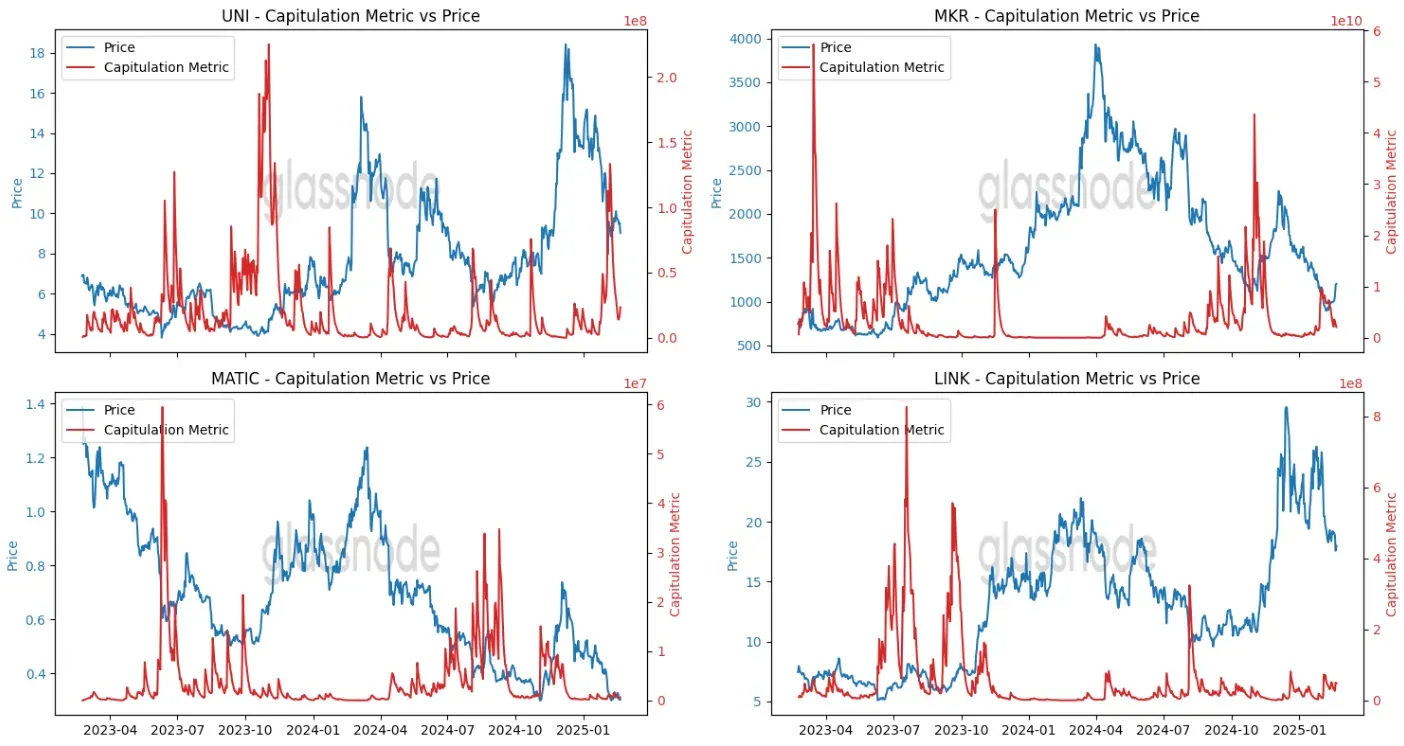
Capitulation metric spikes are inversely correlated with price

Why This Matters

Identifying Turning Points

By pinpointing zones of maximum pain, this metric offers a systematic way to identify local bottoms, where forced selling is likely reaching its final stages. This can be particularly useful for traders seeking high-risk, high-reward entry points.

Understanding Investor Psychology

Market cycles are driven by sentiment as much as fundamentals. This metric provides a quantifiable measure of capitulation, revealing when investors have lost confidence or exhausted their capital. These psychological turning points often coincide with market inflection points, where sentiment and price action begin to shift.

Conclusion

By refining how we measure market distress, the capitulation metric provides valuable insights into local bottom formation. While no single indicator guarantees precision, combining this with broader market context and technical analysis can improve timing for entries in volatile conditions.

Do you want to get access to the source code?

Attached you will find the Google Colab Notebook of the capitulation metric. You just need to plug your API key and run the notebook.


Bacaan Terkait

Vitalik Tegaskan Ethereum Harus 'Mengesankan', Tapi Yayasan Bukanlah Pusatnya

Vitalik Buterin menanggapi kritik komunitas terhadap Yayasan Ethereum (EF) dengan menekankan bahwa Ethereum harus "menakjubkan" dan EF bukanlah pusat kendali, melainkan sebuah simpul dengan tujuan jelas dalam ekosistem yang terdesentralisasi. Dalam esainya, Vitalik mengakui kekhawatiran mengenai kinerja harga ETH dan peran EF. Dia menarik analogi dengan Google, menyatakan bahwa Ethereum harus menghindari jalur yang mengorbankan idealisme awal untuk keuntungan finansial semata. EF, yang hanya memegang sekitar 0.16% dari total pasokan ETH, akan beralih fokus pada tujuan jangka panjang yang krusial bagi keberhasilan Ethereum sebagai sistem yang terbuka, privat, aman, dan tahan sensor. Vitalik menegaskan bahwa "menakjubkan" bagi Ethereum bukan sekadar tentang kecepatan dan skalabilitas tinggi, melainkan keunggulan dalam dimensi CROPS: konsensus yang dapat dibuktikan bebas bug (didukung verifikasi formal berbasis AI), konsensus rantai dengan ketersediaan tinggi, dan minimalisasi perantara. Pendekatan teknis yang teguh ini dimaksudkan untuk membangun "kepastian" tertinggi yang pada akhirnya memberikan premium modal. Menanggapi kritik bahwa EF tidak sejalan dengan kepentingan ekonomi pemegang ETH, Vitalik menyatakan EF akan berhenti menjual ETH dalam jumlah besar dan berkonsentrasi pada area yang tanpanya kemajuan penting tidak akan terjadi. Namun, pertanyaan tentang siapa atau organisasi mana yang akan mengisi kekosongan untuk mewakili dan menyelaraskan kepentingan ekonomi pemegang ETH di ekosistem yang matang ini tetap terbuka dan dianggap kunci bagi pemulihan Ethereum.

链捕手4j yang lalu

Vitalik Tegaskan Ethereum Harus 'Mengesankan', Tapi Yayasan Bukanlah Pusatnya

链捕手4j yang lalu

Galxe: Bagaimana Sebuah Platform Quest Berevolusi Menjadi Infrastruktur Pertumbuhan Web3

**Ringkasan: Galxe – Dari Platform Quest Menjadi Infrastruktur Pertumbuhan Web3** Awalnya dikenal sebagai Project Galaxy pada 2021, Galxe sering disalahpahami hanya sebagai platform *quest* Web3 biasa tempat pengguna menyelesaikan tugas untuk mendapatkan NFT atau imbalan. Namun, dalam beberapa tahun terakhir, platform ini telah berkembang menjadi infrastruktur pertumbuhan inti bagi banyak ekosistem besar seperti Optimism, Arbitrum, dan Linea. Inti nilai Galxe bukanlah pada mekanisme tugasnya, tetapi pada kemampuannya mengubah perilaku pengguna yang terfragmentasi dan sekali pakai menjadi data identitas jangka panjang yang dapat dicatat, diverifikasi, dan digunakan kembali. Melalui *credential*, OAT, Passport, dan sistem skor, setiap tindakan pengguna—dari interaksi media sosial hingga transaksi on-chain—menjadi aset yang terakumulasi dalam *wallet* mereka. Ini menciptakan perubahan psikologis: pengguna tidak hanya mencari imbalan instan, tetapi juga membangun riwayat partisipasi yang dapat meningkatkan peluang mereka mendapatkan akses atau manfaat di masa depan. Bagi proyek, Galxe menyediakan kumpulan pengguna yang dapat disaring berdasarkan riwayat perilaku mereka, memungkinkan kampanye pertumbuhan yang lebih tepat sasaran. Galxe menerapkan jalur pertumbuhan bergaya *gamifikasi*, memandu pengguna secara bertahap dari tugas sederhana (seperti *follow* Twitter) ke interaksi on-chain yang lebih kompleks (seperti *swap* atau *staking*). Pendekatan ini mendidik pengguna, menyaring kualitas mereka, dan pada akhirnya membangun hubungan jangka panjang antara proyek dan komunitas. Dengan meluncurkan produk seperti Passport (verifikasi identitas), Starboard (analitik komunitas), dan Earndrop (distribusi imbalan), Galxe bercita-cita menjadi sistem operasi pertumbuhan yang lengkap untuk Web3. Jaringannya menciptakan *flywheel effect*: semakin banyak proyek yang bergabung, semakin kaya data pengguna; data yang lebih kaya menghasilkan penyaringan yang lebih tepat, yang menarik lebih banyak proyek. Singkatnya, Galxe tidak sekadar menjual lalu lintas pengguna, tetapi membangun tatanan pertumbuhan baru berbasis identitas di Web3, di mana perilaku pengguna bernilai akumulatif dan pertumbuhan berkembang menjadi jaringan hubungan jangka panjang.

marsbit4j yang lalu

Galxe: Bagaimana Sebuah Platform Quest Berevolusi Menjadi Infrastruktur Pertumbuhan Web3

marsbit4j yang lalu

Pulsa Pasar BTC: Minggu ke-22

Pulsa Pasar BTC: Pekan 22 Harga Bitcoin turun selama seminggu terakhir, dari $79K ke rendah lokal dekat $74K sebelum pulih ke arah $77K. Momentum harga turun 21,7%, mencerminkan aksi harga yang lebih lembut dan tekanan jual yang meningkat. Namun, indikator Spot CVD dan Perpetual CVD naik tajam (masing-masing 77,2% dan 35,5%), menunjukkan tekanan jual mulai mereda dan sentimen pasar menjadi lebih seimbang. Aktivitas pasar mendingin dengan volume spot turun 10% dan minat terbuka futures turun 3,5%, mengindikasikan berkurangnya nafsu spekulatif. Di sisi lain, ada tanda-tanda nafsu risiko baru. Pembiayaan sisi long melonjak 135,4%, menyoroti permintaan kuat untuk eksposur long. Di pasar opsi, 25-Delta Skew naik sedikit, sinyal permintaan yang sedikit lebih besar untuk proteksi downside. Di pasar TradFi, arus bersih ETF AS membaik 28,9%, menunjukkan arus keluar modal mereda dan sentimen stabil, meski volume perdagangan ETF turun. Dari perspektif aktivitas jaringan, jumlah alamat aktif harian dan volume transfer yang disesuaikan entitas menurun sedikit, mengisyaratkan fase konsolidasi. Metrik likuiditas menunjukkan profil yang lebih stabil dengan aktivitas spekulatif lebih rendah. Namun, metrik profitabilitas menandakan potensi peningkatan tekanan pasar. Rasio laba belum terealisasi bersih turun signifikan, sementara rasio laba terealisasi menunjukkan peningkatan realisasi kerugian dibandingkan ambil untung, mengindikasikan sentimen hati-hati dan berpotensi bearish. Kesimpulannya, pasar menunjukkan tanda-tanda moderasi dan konsolidasi, dengan aktivitas berkurang, sentimen hati-hati, dan campuran nafsu risiko. Gambaran ini menekankan pentingnya pemantauan ketat terhadap dinamika pasar.

insights.glassnode5j yang lalu

Pulsa Pasar BTC: Minggu ke-22

insights.glassnode5j yang lalu

Gugatan New York Mengincar 3,79 Juta Bitcoin yang Tidak Aktif

Sebuah gugatan hukum di New York mengupayakan pernyataan pengadilan atas puluhan ribu alamat Bitcoin yang telah lama tidak aktif, yang menurut satu analisis eksternal secara kolektif menyimpan sekitar 3,79 juta BTC. Kasus ini diajukan oleh "Noah Doe" dan dua perusahaan LLC Wyoming, berupaya mendefinisikan alamat kripto mandiri yang tidak aktif sebagai properti yang ditinggalkan berdasarkan hukum barang temuan New York. Penggugat mengklaim telah mengidentifikasi 39.069 dompet digital yang mereka anggap terbengkalai dan melaporkannya ke polisi. Mereka berargumen bahwa langkah-langkah ini memenuhi prosedur properti hilang New York, sehingga hak klaim beralih ke mereka. Jumlah BTC yang terlibat sangat besar dan mencakup alamat-alamat yang dikaitkan dengan Satoshi Nakamoto, penambang awal, dan entitas lain. Argumen hukumnya tidak biasa karena memperlakukan alamat Bitcoin yang dorman sebagai properti yang dapat diklaim, meskipun pengaduan mengakui bahwa kripto tidak dapat ditarik tanpa kunci privat. Kasus ini terkait dengan kampanye pemberitahuan on-chain yang dilakukan oleh Salomon Brothers Strategic Advisors, yang memasukkan pesan ke dompet-dompet lama. Analisis Galaxy Research menyebut kampanye OP_RETURN ini sebagai "The Great Bitcoin Dusting". Komunitas Bitcoin mempertanyakan keabsahan klaim ini, menekankan bahwa ketidakaktifan alamat tidak serta-merta berarti ditinggalkan, dan pemberitahuan mungkin tidak sampai ke pemilik sebenarnya jika saldo berada di jenis output yang lebih tua. Kasus ini mempertemukan doktrin hukum dengan realitas protokol Bitcoin.

bitcoinist5j yang lalu

Gugatan New York Mengincar 3,79 Juta Bitcoin yang Tidak Aktif

bitcoinist5j yang lalu

Trading

Spot
Futures
活动图片