Consumer Confidence Hits Bottom, Macro Correlations Simultaneously Break Down: How Much Longer Can the U.S. Stock Market's Solo Rally Last?

marsbitPublié le 2026-05-28Dernière mise à jour le 2026-05-28

Résumé

The U.S. stock market is exhibiting a rare divergence: while consumer confidence hits historic lows and traditional macro asset correlations break down, major indices like the Nasdaq 100 and S&P 500 continue reaching record highs, fueled primarily by AI and semiconductor momentum. The rally is now highly concentrated, with strength rotating from giants like Nvidia to higher-beta plays within semiconductors, particularly memory chips. This surge occurs despite a significant split between pessimistic consumer sentiment and still-resilient actual spending behavior, partially supported by fiscal stimulus. Goldman Sachs traders highlight a critical structural fissure: correlations between the S&P 500 and key macro assets (rates, gold, VIX, oil) have deviated extremely from long-term historical norms. Concurrently, the market is in a negative Gamma regime, making it more sensitive to price moves, and hedge fund positioning in momentum and semiconductors is at crowded levels. The sustainability of this "solo rally" faces three main constraints: 1) Oil price volatility linked to Middle East geopolitical risks, 2) Extreme crowding in semiconductor and momentum trades, increasing vulnerability to disappointments, and 3) The breakdown of traditional macro correlations, suggesting the rally reflects a specific mix of factors rather than broad-based risk appetite. The key question is not if indices can rise further, but which variable—oil, rates, or semiconductor momentum—might trigger ...

Author: Li Jia

Source: Wall Street News

The U.S. stock market is currently displaying a rare split: on one side, consumer confidence has fallen to historic lows and correlations between macro assets have become completely distorted; on the other side, major stock indices continue to set new all-time highs driven by the AI and semiconductor rally. What the market is truly worried about is no longer whether the uptrend can continue, but how long this highly concentrated AI-driven rally can withstand the shocks from oil prices, interest rates, and crowded positioning.

Spurred by rising expectations for U.S.-Iran talks and a surge in the semiconductor sector, U.S. stocks hit new record highs again on Tuesday. The Nasdaq 100 Index surpassed 30,000 points for the first time, and the S&P 500 rose about 0.5%; meanwhile, a decline in oil prices led to lower U.S. Treasury yields, while a rebound in the dollar pressured the performance of gold and Bitcoin.

Semiconductors remain the core driver of this rally. After UBS Group significantly raised its target price for Micron Technology, trading sentiment for memory chips heated up rapidly, with the semiconductor sector rising 14% over the past five days. However, Nvidia has begun to underperform the overall semiconductor index, indicating that funds are shifting from the leader towards sectors with higher elasticity.

Nelson Armbrust, a Goldman Sachs trader, warned that the current correlations between the S&P 500 and interest rates, gold, the VIX, and oil prices have all deviated from their 20-year historical averages and entered extreme ranges. "One side of the market has to give," he said. "The stock indices are not reflecting the full reality of the market."
AI Theme Remains, But Driving Forces Rotate

The strongest driving force in the stock market currently comes from semiconductors, especially the memory chip segment. Goldman Sachs trader Pete Callahan pointed out that the semiconductor index has outperformed Nvidia by about 16.5 percentage points over the past five trading days, marking the largest five-day advantage for the SOX relative to Nvidia since 2018.

Notably, this rally is not being driven by a broad-based surge in mega-cap tech stocks. Large-cap tech stocks overall showed relative weakness, with Nvidia slightly lagging, indicating funds are rotating from the AI leader towards more elastic trading plays within the semiconductor sector. Memory chip-related stocks opened sharply higher, with DRAM ETF nominal trading volume reaching about $30 billion for the day, and Goldman Sachs' Meme-Stocks basket also rose noticeably.

AI remains the market's main theme. AI semiconductors, Agentic AI, and AI data center stocks led the market gains. Goldman Sachs noted that the strength in the momentum factor that day was almost entirely driven by long positions, with the best-performing stocks over the past 12 months continuing to significantly outperform.

Meanwhile, increasingly extreme structural signals are also appearing in the options market. SpotGamma data shows aggressive negative Delta flows in 0-DTE options, primarily driven by selling call options; and the combination of "rising volatility and rising spot prices" persists. This means the current rally is not a typical low-volatility expansion of risk appetite but is increasingly being driven by positioning squeezes and options trading structures.

Consumer Confidence Bottoms, But Behavior and Sentiment Diverge

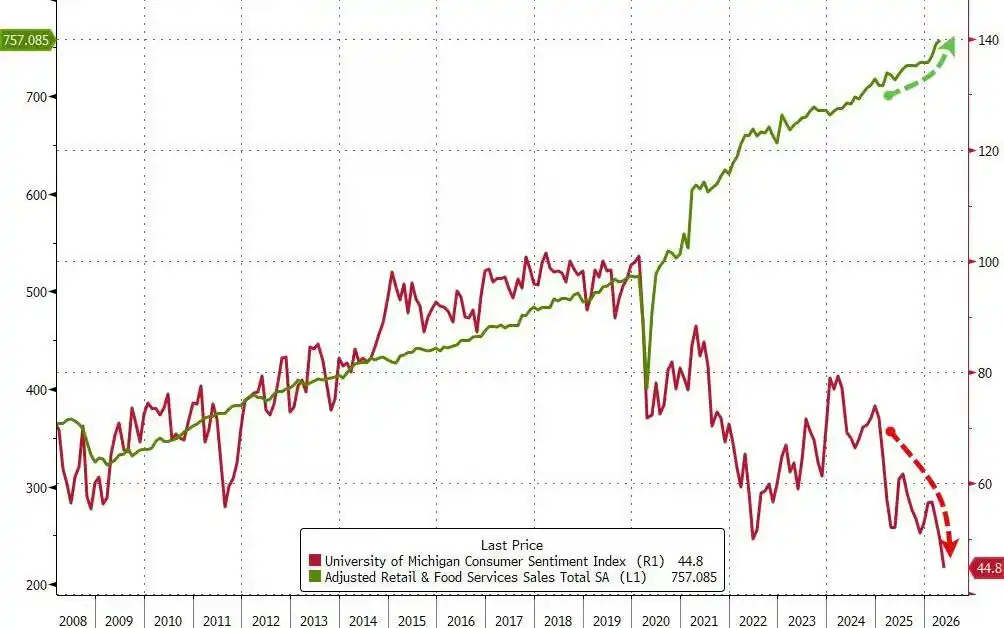
Goldman Sachs trader Chris Hussey pointed out that many are puzzled: why are U.S. stocks still hitting new record highs when consumer confidence indicators have fallen to historic lows? His explanation is that what consumers "feel" and what they "actually do" are inconsistent. In other words, sentiment is pessimistic, but consumer behavior has not deteriorated in sync.

Meanwhile, fiscal stimulus is still supporting household cash flow. Chris Hussey mentioned that tax relief from the budget bill last July is improving household balance sheets, partially offsetting the pressure from rising gasoline prices.

U.S. macro data also shows clear divergence. The Chicago Fed National Activity Index rebounded sharply, the Conference Board Consumer Confidence Index beat expectations, and the Dallas Fed Manufacturing Index held steady; while the S&P CoreLogic Case-Shiller Home Price Index weakened and the Philadelphia Fed Manufacturing Index missed expectations. Overall, U.S. economic data maintains a state of "slightly stronger than expected."

This also explains the market's current contradiction: consumer sentiment is extremely weak, but economic data has not significantly deteriorated yet, and actual consumer behavior has not shown a synchronous decline. However, the AAII Bull-Bear Spread remains negative, indicating investor sentiment has not truly turned optimistic alongside the new stock market highs.

Macro Correlations Fail, Negative Gamma Intensifies: Goldman Sachs Warns of Structural Cracks in U.S. Stocks

Goldman Sachs trader Nelson Armbrust warned that current U.S. stock indices do not reflect the full reality of the market. Correlations between the S&P 500 and key macro assets have comprehensively deviated from long-term averages: correlation with interest rates is at a decade low, correlation with gold is at a decade high, correlation with the VIX is at a two-year high, and correlation with oil prices is at a decade low.

These are extremely rare levels even when viewed across a 20-year historical dimension. In other words, while U.S. stocks are still rising, their traditional联动 relationships with interest rates, volatility, commodities, and safe-haven assets are breaking down. For investors relying on historical correlations for asset allocation, hedging, and risk budgeting, this means model stability is declining.

Meanwhile, Gamma has turned negative. In a negative Gamma environment, the market becomes more sensitive to price fluctuations, and the state of "spot prices rising while volatility simultaneously increases" also means the current market action is not a typical low-volatility one-sided bull market, but increasingly driven by positioning and options structures.

Goldman Sachs HF Trend Monitor data shows hedge funds' current allocation to the momentum factor has risen to the 90th percentile, semiconductor positioning has reached a record 10%, while software positioning has fallen to its lowest since 2019. Highly crowded positioning implies that the rally may still continue upward in the short term driven by chasing funds, but once a reversal occurs, the pullback could also be more severe.

How Far Can U.S. Stocks Go? It Depends on Three Constraints

The first constraint comes from oil prices. Diplomatic progress can quickly depress geopolitical risk premiums, but cannot immediately repair the buffer capacity of shipping, insurance, refineries, and real supply chains. As long as uncertainty remains around the Strait of Hormuz situation and the prospects for a U.S.-Iran ceasefire, oil prices may fluctuate repeatedly between optimistic expectations and tail risks.

The second constraint comes from semiconductor positioning. The current U.S. stock rally relies increasingly on AI and semiconductors, especially memory chips and momentum long trades. If funds continue chasing this direction, indices may maintain strength; but the more crowded the positioning, the higher the market's sensitivity to earnings, guidance, or fund flow changes—any slight disappointment could be rapidly amplified.

The third constraint comes from correlation breakdowns. The simultaneous deviation of the S&P 500's relationship with interest rates, gold, the VIX, and oil prices from long-term averages means the current rally does not equate to a comprehensive easing of macro risks. More accurately, it is the result of a combination of declining geopolitical risk premiums, falling U.S. Treasury yields, AI/semiconductor momentum, and positioning squeezes.

Therefore, the U.S. stock market's "solo party" may continue, but the stability of the rally is declining. What truly matters is not whether the indices can set new highs, but which variables will force a repricing of this trading logic—whether oil prices will rise again, whether interest rates will re-ascend, whether semiconductor momentum will cool, and when those distorted correlations will revert.


Questions liées

QWhat is the main contradiction in the current U.S. stock market as described in the article?

AThe main contradiction is that while consumer confidence is at a historical low and traditional macro correlations have broken down, major stock indices like the Nasdaq 100 and S&P 500 continue to hit record highs, driven primarily by a highly concentrated AI and semiconductor rally.

QWhich sector is identified as the core driving force of the current market rally, and what shift within it is observed?

AThe semiconductor sector is the core driving force. A shift is observed where capital is moving from the AI leader, Nvidia, towards more elastic segments within semiconductors, particularly memory chips, as evidenced by the outperformance of the broader semiconductor index.

QWhat warning does Goldman Sachs trader Nelson Armbrust issue regarding market correlations?

ANelson Armbrust warns that the correlations between the S&P 500 and key macro assets (interest rates, gold, VIX, and oil) have deviated to extreme levels from their 20-year historical averages. This means the market is not reflecting the full reality, and traditional models for asset allocation and hedging are losing stability.

QAccording to the article, what three main constraints could limit the continuation of the U.S. stock market's 'solo celebration'?

AThe three main constraints are: 1) Oil price volatility, influenced by geopolitical risks like the Strait of Hormuz situation and U.S.-Iran negotiations. 2) Overcrowded positioning in the semiconductor sector, making it vulnerable to any negative news. 3) The breakdown of traditional macro correlations, indicating the current rally's foundation is fragile and dependent on a specific mix of factors.

QHow does the article explain the divergence between low consumer confidence and strong stock market performance?

AThe article explains this divergence by highlighting a split between what consumers 'feel' and what they 'actually do.' While sentiment is pessimistic, actual consumer behavior has not deteriorated in sync, partly supported by fiscal stimuli like tax credits, and economic data remains 'slightly stronger than expected.'

Lectures associées

Iran et la Fed — Les "trois scénarios" à venir qui influenceront les marchés mondiaux

La situation en Iran et les perspectives de politique monétaire de la Fed sont devenues les deux principaux facteurs influençant les marchés mondiaux. Une analyse de Deutsche Bank explore trois scénarios possibles concernant les négociations de cessez-le-feu en Iran et leurs implications potentielles sur la trajectoire de la Fed. Le premier scénario, un accord de paix, atténuerait les pressions immédiates de hausse des taux, mais des risques à moyen terme subsisteraient si l'inflation persistait. Le deuxième, une impasse dans les négociations avec un pétrole durablement élevé, est identifié comme le plus susceptible de déclencher un resserrement substantiel de la Fed, potentiellement plusieurs hausses de taux en 2026. Le troisième, une escalade du conflit, créerait une double incertitude pour la Fed : devoir lutter contre un ancrage des anticipations inflationnistes ou répondre à un affaiblissement du marché du travail. La logique centrale est que la situation géopolitique détermine les prix du pétrole, qui influencent à leur tour la dynamique de l'inflation et l'ancrage des anticipations, façonnant ainsi la marge de manœuvre de la Fed. Les signaux clés à surveiller incluent l'évolution des négociations, la stabilité du pétrole en dessous de 100 dollars le baril et les changements de discours des responsables de la Fed.

marsbitIl y a 4 mins

Iran et la Fed — Les "trois scénarios" à venir qui influenceront les marchés mondiaux

marsbitIl y a 4 mins

Ce Skill IA de mise en page graphique pour Xiaohongshu a trouvé une voie pour contourner l'étiquetage IA

En février 2026, Xiaohongshu a exigé l'étiquetage des contenus générés par IA, sous peine de restriction de diffusion. En réponse, le projet open-source `guizang-social-card-skill` propose une approche alternative pour créer des graphiques au format 3:4 pour Xiaohongshu et des couvertures pour WeChat. Au lieu d'utiliser des modèles de génération d'images comme Midjourney, il repose sur le rendu HTML/CSS et des photos provenant de banques d'images telles qu'Unsplash, produisant ainsi une capture d'écran d'une page web. Cette méthode contourne les modèles de détection de l'IA de la plateforme, qui analysent les caractéristiques des pixels générés. Le Skill utilise 28 modèles de mise en page (styles Editorial et Suisse) et des palettes de couleurs prédéfinies. L'IA choisit le modèle, positionne le texte, gère les paramètres (comme les cartes MapLibre) et génère le code HTML/CSS. Un moteur de rendu (Playwright) produit ensuite l'image finale. Le processus priorise les photos de l'utilisateur, puis recherche automatiquement des images sur Unsplash, Pexels, etc. Un script de validation vérifie les erreurs de mise en page. Cette stratégie évite les signatures pixel des modèles de diffusion, mais sa pérennité dépend de la définition évolutive de "contenu synthétique généré par IA" par la plateforme. Si Xiaohongshu étend sa détection aux rendus HTML ou aux modèles de production de masse, l'approche pourrait perdre son avantage. L'article compare trois voies techniques : la génération directe d'images par IA (risque de détection élevé), les moteurs de templates via API (risque de flag anti-spam dû à l'uniformité), et les outils spécifiques à une plateforme (adaptés mais fragiles). Le Skill de Guizang se situe entre l'assistance IA pour la mise en page et l'utilisation de ressources photographiques, correspondant potentiellement à une "assistance IA" tolérée, par opposition à une production de masse entièrement automatisée.

marsbitIl y a 13 mins

Ce Skill IA de mise en page graphique pour Xiaohongshu a trouvé une voie pour contourner l'étiquetage IA

marsbitIl y a 13 mins

Fondateur de Hash Global : Pourquoi j'ai également choisi de liquider tous mes ETH ?

L'auteur, fondateur de Hash Global, explique avoir vendu toutes ses positions en ETH malgré le potentiel impact positif du projet de loi américain CLARITY, qui pourrait clarifier le statut réglementaire de l'ETH en tant que bien numérique décentralisé. Il conteste l'argument avancé par certains selon lequel cette clarté réglementaire conférerait automatiquement à l'ETH une prime monétaire semblable à celle de l'or ou du Bitcoin. Selon lui, la classification juridique ne résout que les problèmes de conformité pour les institutions, mais n'équivaut pas à une reconnaissance en tant que réserve de valeur mondiale. Le marché évalue toujours l'ETH sur des fondamentaux concrets : revenus du réseau, activité DeFi, concurrence, flux de valeur des L2, etc., et non sur un récit monétaire simple comme le BTC. De plus, le développement futur des actifs financiers tokenisés (RWA) comme l'or ou les obligations souveraines sur chaîne pourrait offrir des rendements similaires ou supérieurs, réduisant l'avantage unique de l'ETH en tant qu'actif productif de revenus. L'auteur estime que la prime monétaire restera l'apanage du BTC, de l'or physique et potentiellement de l'or tokenisé. L'ETH jouera un rôle crucial en tant qu'infrastructure de base pour la finance décentralisée et le règlement de ces actifs, mais sa valorisation doit reposer sur sa capture de valeur en tant que plateforme (frais, mise en jeu, demande de nantissement), et non sur une comparaison directe avec les métaux précieux. En conclusion, bien que le CLARITY soit bénéfique pour réduire l'incertitude réglementaire et donc le "rabais réglementaire" de l'ETH, il ne déclenchera pas automatiquement une réévaluation massive basée sur une prime monétaire. La valorisation de l'ETH doit rester ancrée dans les fondamentaux de son écosystème.

链捕手Il y a 15 mins

Fondateur de Hash Global : Pourquoi j'ai également choisi de liquider tous mes ETH ?

链捕手Il y a 15 mins

Trading

Spot
Futures
活动图片