Audiera Price Forecast: BEAT Soars 40% in a Week, Bulls Targeting $4.68 Resistance

cryptonews.ruPublié le 2026-07-29Dernière mise à jour le 2026-07-29

Résumé

Audiera (BEAT) has shown renewed strength, surging 36.79% in 24 hours and over 40% for the week to trade around $3.65. This recovery follows a sharp correction from June's peak above $11.40. Technical indicators have improved, with the 20-day EMA ($2.91) above the 50-day EMA ($2.65), signaling regained buyer control. Key resistance is at $4.68, aligned with the 38.2% Fibonacci level. A break above could target $5.97 and $7.26, with the $9.10-$11.44 zone representing major previous highs. Support lies at $3.08 (23.6% Fib) and the 20-day EMA at $2.91. A drop below $2.91 could lead to a deeper pullback. Derivatives data shows open interest stabilizing at around $81.87 million, down from over $350 million in June, indicating a more balanced market with less excessive leverage. Recent spot flows show modest net inflows, suggesting renewed accumulation. The short-term outlook depends on bulls defending the $2.91-$3.08 support area while building momentum toward the $4.68 resistance. A confirmed breakout above this level would signal a stronger recovery, while failure could lead to consolidation near current supports.

Audiera ($BEAT) is showing renewed strength following a sharp correction after its June peak above $11.40. The token recently gained momentum, rising 36.79% in the last 24 hours and 40.28% over the past seven days. Currently, $BEAT is trading around $3.65, with a market cap of approximately $1.13 billion.

The recent recovery reflects improving market sentiment as buyers return after weeks of consolidation. Furthermore, technical indicators suggest that $BEAT has regained strength, although traders remain cautious about short-term volatility and key resistance levels ahead.

Technical Forecast for $BEAT Shows Improved Bullish Structure

The daily chart of $BEAT/USDT shows a gradual recovery phase after the previous decline. The token is currently trading above its major exponential moving averages, signaling improved medium-term strength.

The 20-day EMA at $2.91 has risen above the 50-day EMA at $2.65. Moreover, both averages remain above the 100-day EMA at $2.19 and the 200-day EMA at $1.69.
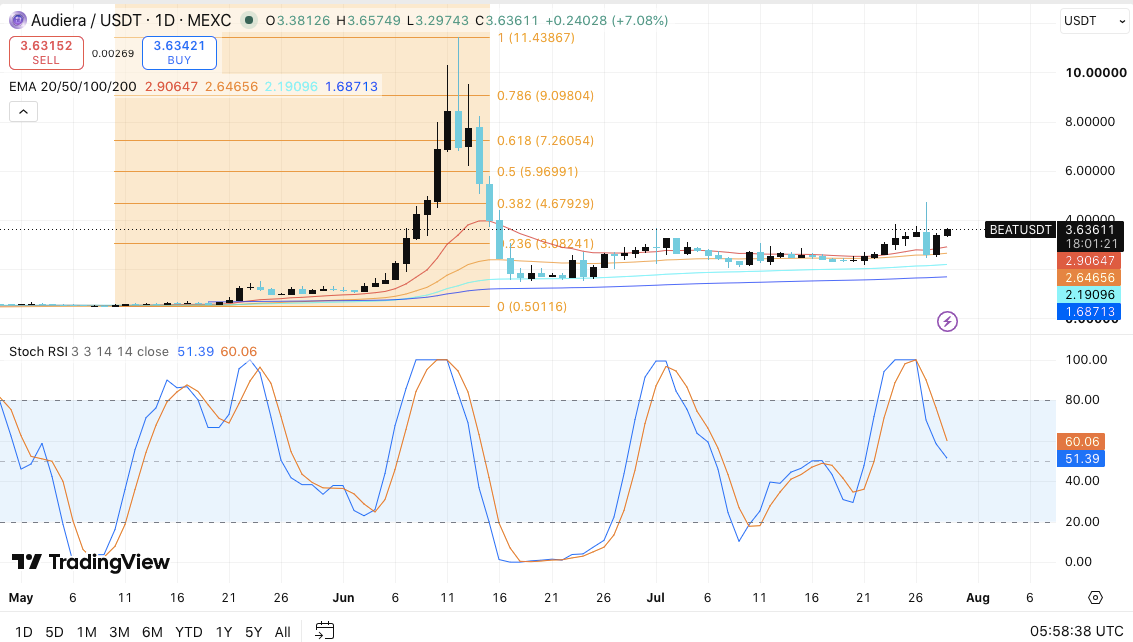
Audiera Price Dynamics (Source: Trading View)

This moving average alignment indicates that buyers have regained control. However, $BEAT still needs sustained buying pressure to confirm a full trend reversal. The first major resistance lies at $4.68, which coincides with the 38.2% Fibonacci retracement level. A breakout above this zone could open the path to $5.97 and $7.26.

Furthermore, the $7.26 level represents a significant test for the bulls, as it could confirm a stronger recovery. If momentum is sustained, $BEAT could eventually challenge the resistance zone between $9.10 and $11.44. This area contains previous highs and could attract increased selling activity.

Support Levels and Market Momentum

The short-term outlook for $BEAT largely depends on whether buyers can defend key support areas. The $3.08 level, associated with the 23.6% Fibonacci retracement, remains the first support zone. Additionally, the 20-day EMA at $2.91 provides another layer of defense for the current bullish setup.

A drop below $2.91 could weaken market confidence and expose the token to further decline. Consequently, traders may view the 50-day EMA at $2.65 as the next crucial defensive level.

The Stochastic RSI has started to decline from overbought territory. This suggests that short-term momentum may weaken following the recent rally. Therefore, $BEAT may undergo consolidation before attempting another upward move.

Derivatives Activity Stabilizes After June Volatility

Audiera's open interest data shows significant shifts in trader positioning over recent months. During the rally in early June, open interest surged above $350 million as leveraged traders increased their exposure. This rise reflected strong speculative interest during $BEAT's explosive price movement.
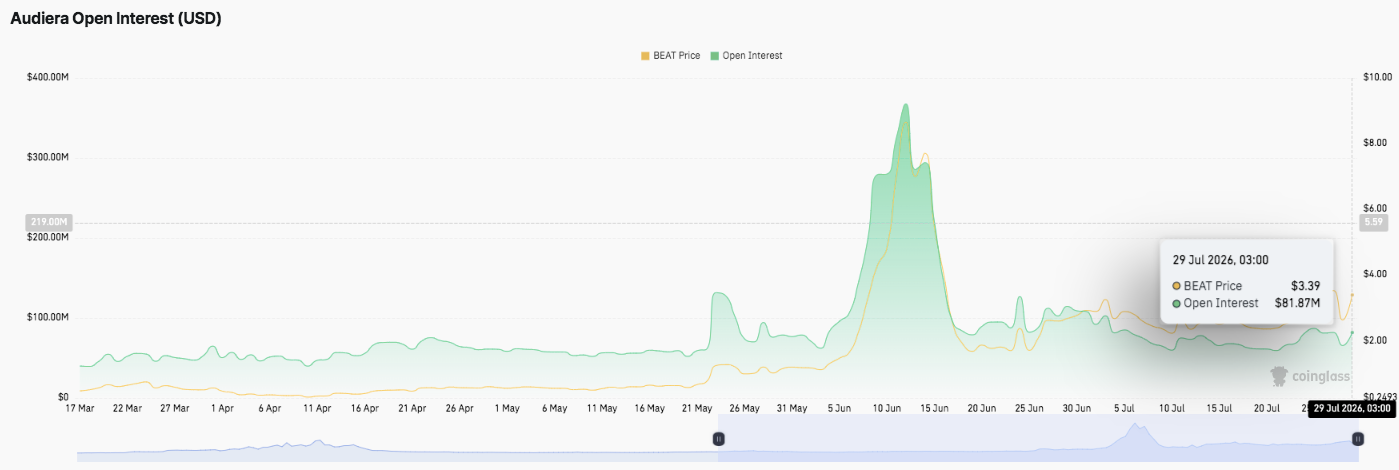
Source: CoinGlass

However, open interest sharply declined following the market reversal. The drop indicates widespread position unwinding and reduced leverage among derivative traders. Since mid-June, open interest has stabilized between $60 million and $120 million.

The latest figure is around $81.87 million, while $BEAT trades around $3.39. This points to a more balanced derivatives market without excessive leverage buildup. Importantly, stable open interest could provide a healthier foundation for future price movements.

Spot Flows Indicate Renewed Investor Interest
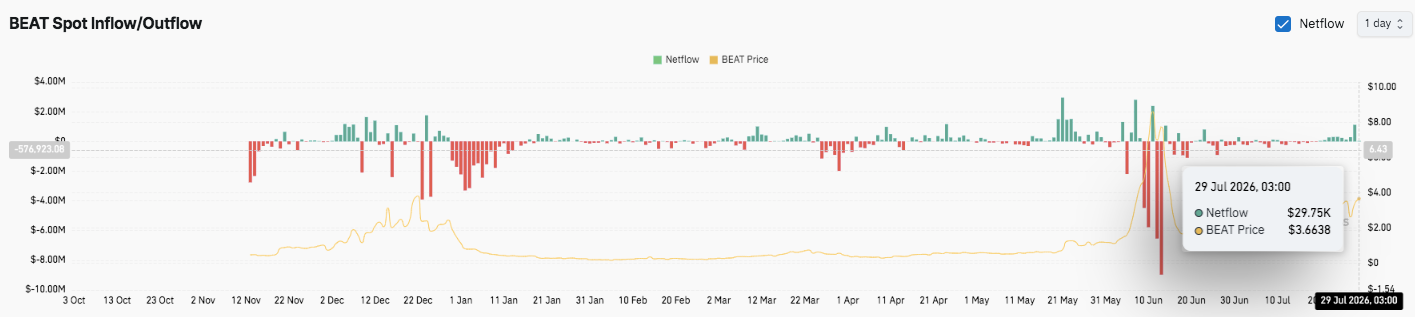
Source: CoinGlass

$BEAT's spot inflow and outflow data reveal mixed but improving investor activity. Previous periods recorded significant outflows, indicating profit-taking after the strong rally. Additionally, several large spikes in inflows and outflows occurred during volatile trading sessions in June.

Recently, market activity has become more balanced, with net flows turning slightly positive. The latest data shows an inflow of approximately $29.75 thousand, suggesting renewed accumulation among investors.

Audiera Price Technical Overview

Key levels remain clearly defined for Audiera ($BEAT) as the token attempts to extend its recovery following the June correction.

Upside Levels: $4.68 remains the immediate resistance zone, followed by $5.97 and $7.26, which align with key Fibonacci retracement levels. A decisive breakout above $7.26 could reinforce bullish momentum and open the path to $9.10 and the previous high zone around $11.44.

Downside Levels: $3.08 represents the first major support zone, followed by the 20-day EMA at $2.91 and the 50-day EMA at $2.65. A deeper correction could reveal a broader support area between the 100-day EMA at $2.19 and the 200-day EMA at $1.69.

Resistance Ceiling: The $4.68 level remains a critical barrier for the bulls. A successful daily close above this zone would confirm intensifying buy-side pressure and increase the likelihood of a sustained recovery. However, failure to overcome this resistance could lead to consolidation around current support levels.

Will the Audiera Price Rise?

Audiera's near-term direction hinges on whether buyers can maintain support above the $2.91-$3.08 area while building momentum towards the $4.68 resistance. The recent recovery, improved EMA structure, and balanced derivatives activity point to a gradual improvement in market sentiment. Additionally, modestly positive spot flows suggest renewed investor interest after the June sell-off.

If bullish momentum strengthens and trading volume increases, $BEAT could challenge $5.97 and $7.26 before targeting higher resistance near $9.10. However, losing the $2.91 support would weaken the recovery and increase the risk of a pullback to $2.65 or lower. For now, $BEAT remains in a crucial recovery phase, and technical confirmation coupled with sustained buyer participation will likely determine the next major move.

end-content

Cryptos en tendance

Questions liées

QWhat are the current price and recent weekly performance of Audiera (BEAT) according to the article?

AThe current price is around $3.65. Over the past week, it has risen by 40.28%.

QWhat is the immediate key resistance level that BEAT needs to overcome to continue its bullish momentum?

AThe immediate key resistance level is at $4.68, which coincides with the 38.2% Fibonacci retracement level.

QWhat do the Moving Average alignments suggest about the market structure for BEAT?

AThe 20-day EMA ($2.91) is above the 50-day EMA ($2.65), and both are above the 100-day and 200-day EMAs. This alignment indicates that buyers have regained control, signaling an improving medium-term bullish structure.

QHow has the Open Interest for BEAT derivatives changed since June, and what does the current level suggest?

AOpen Interest spiked above $350 million during the June rally but sharply declined afterward. It has since stabilized around $60–120 million, with the latest figure at approximately $81.87 million. This suggests a more balanced derivatives market with less excessive leverage, providing a healthier foundation for future price moves.

QWhat are the two critical short-term support levels for BEAT mentioned in the technical analysis?

AThe first key support level is at $3.08, associated with the 23.6% Fibonacci level. The second is the 20-day Exponential Moving Average at $2.91. A break below $2.91 could weaken market confidence.

Lectures associées

Les actions chutent plus fort que la crypto, où est passée l’argent ?

En juillet, les marchés boursiers mondiaux ont connu des chutes spectaculaires, en particulier le Kospi sud-coréen qui a déclenché des mécanismes de suspension (circuit breakers) après des baisses de plus de 10% et 6% sur deux jours. Des valeurs technologiques comme SK Hynix, pourtant bénéficiaires, se sont effondrées en raison de résultats légèrement inférieurs aux attentes. Les ETF à effet de levier sur ces titres ont subi des pertes dépassant 80%. Contrairement aux attentes, le Bitcoin n'a pas servi de refuge. Sa relative stabilité s'explique par une correction anticipée en mai-juin, lors de sorties massives des ETF américains. Les capitaux désertant les actions se sont principalement redirigés vers les liquidités, les obligations d'État et surtout l'or, dont le prix a fortement augmenté. L'analyse révèle que le Bitcoin et l'or ne sont plus perçus comme des actifs similaires : l'or est privilégié pour la préservation du capital, tandis que le Bitcoin reste un actif risqué recherchant la performance. La crise actuelle est interprétée comme un « déléveraging » forcé, ciblant les positions les plus spéculatives, notamment dans les semi-conducteurs. Des facteurs comme la hausse des taux au Japon et l'introduction potentielle d'un nouveau concurrent (ChangXin Memory) ont accentué la pression. Les perspectives pour le Bitcoin dépendent désormais d'un assouplissement de la politique monétaire mondiale et d'une clarification réglementaire, comme l'adoption du projet de loi CLARITY aux États-Unis. Bien que n'étant pas un havre de paix immédiat, le Bitcoin, ayant déjà subi sa correction, pourrait retrouver son attractivité pour les investisseurs en quête de diversification une fois la tempête passée.

marsbitIl y a 11 mins

Les actions chutent plus fort que la crypto, où est passée l’argent ?

marsbitIl y a 11 mins

« Dernière phase avant un nouveau cycle ». Ce qui attend le bitcoin en août

**Résumé en français :** Le cours du bitcoin clôture juillet sur une reprise à deux chiffres depuis son plus bas de l'année, mais les experts interrogés anticipent des difficultés pour août. Plusieurs facteurs exercent une pression : un environnement macroéconomique défavorable (taux d'intérêt élevés aux États-Unis, inflation persistante), une forte concurrence des autres actifs (obligations, actions technologiques) et des sorties nettes record des ETF spot sur bitcoin au premier semestre. Historiquement, août est un mois faible pour le marché crypto, avec une médiane de rendements négatifs. Bien qu'un nouveau cycle haussier du bitcoin soit attendu à terme, la phase actuelle est vue comme la dernière étape corrective avant son démarrage. Les scénarios pour août privilégient une continuation de la consolidation, avec une probabilité élevée de test des niveaux bas. Le scénario de base (50% de probabilité) envisage un range entre 58 000 et 68 000 USD. Un scénario baissier (30%) pourrait voir le bitcoin descendre vers 50 000-55 000 USD en cas de rupture sous 58 000 USD. Un scénario haussier au-dessus de 67 000 USD (vers 71 000-75 000 USD) n'est jugé possible qu'à 20%. Les experts recommandent aux investisseurs de profiter de ces niveaux pour accumuler du bitcoin ou des projets solides à long terme, tout en évitant les actifs plus spéculatifs. Un rebond significatif n'est pas attendu avant le quatrième trimestre 2024.

cryptonews.ruIl y a 20 mins

« Dernière phase avant un nouveau cycle ». Ce qui attend le bitcoin en août

cryptonews.ruIl y a 20 mins

Trading

Spot

Articles tendance

Comment acheter BEAT

Bienvenue sur HTX.com ! Nous vous permettons d'acheter Audiera (BEAT) de manière simple et pratique. Suivez notre guide étape par étape pour commencer votre parcours crypto.Étape 1 : Création de votre compte HTXUtilisez votre adresse e-mail ou votre numéro de téléphone pour ouvrir un compte sur HTX gratuitement. L'inscription se fait en toute simplicité et débloque toutes les fonctionnalités.Créer mon compteÉtape 2 : Choix du mode de paiement (rubrique Acheter des cryptosCarte de crédit/débit : utilisez votre carte Visa ou Mastercard pour acheter instantanément Audiera (BEAT).Solde :utilisez les fonds du solde de votre compte HTX pour trader en toute simplicité.Prestataire tiers :pour accroître la commodité d'utilisation, nous avons ajouté des modes de paiement populaires tels que Google Pay et Apple Pay.P2P :tradez directement avec d'autres utilisateurs sur HTX.OTC (de gré à gré) : nous offrons des services personnalisés et des taux de change compétitifs aux traders.Étape 3 : stockage de vos Audiera (BEAT)Après avoir acheté vos Audiera (BEAT), stockez-les sur votre compte HTX. Vous pouvez également les envoyer ailleurs via un transfert sur la blockchain ou les utiliser pour trader d'autres cryptos.Étape 4 : tradez des Audiera (BEAT)Tradez facilement Audiera (BEAT) sur le marché Spot de HTX. Il vous suffit d'accéder à votre compte, de sélectionner la paire de trading, d'exécuter vos trades et de les suivre en temps réel. Nous offrons une expérience conviviale aux débutants comme aux traders chevronnés.

498 vues totalesPublié le 2026.01.22Mis à jour le 2026.06.02

Comment acheter BEAT

Discussions

Bienvenue dans la Communauté HTX. Ici, vous pouvez vous tenir informé(e) des derniers développements de la plateforme et accéder à des analyses de marché professionnelles. Les opinions des utilisateurs sur le prix de BEAT (BEAT) sont présentées ci-dessous.

活动图片