End of Correction or Continuation of Trend: Technical Structure Review of BTC and HYPE | Guest Analysis

Odaily星球日报Publié le 2026-07-06Dernière mise à jour le 2026-07-06

Résumé

**Weekly Technical Analysis: BTC & HYPE Structure Review** This analysis covers the multi-timeframe technical structure for Bitcoin (BTC) and HYPE. **Bitcoin (BTC) Analysis:** BTC's correction from its May 6 high has formed a clear four-segment pattern on the daily chart. The market is currently in a (3-4) rebound phase. The key determinant for the short-term trend is the endpoint of this rebound ("Endpoint 4"): * **Path 1 (Preferred Scenario):** If the rebound surpasses the $65,700 resistance, subsequent pullbacks are less likely to break the key support at $57,820 (July 1 low). This would suggest a transition into a consolidating range, building energy for a potential bullish reversal. * **Path 2:** Failure to reach $65,700, or even $64,500, increases the probability of a breakdown below $57,820, continuing the downtrend. The 4-hour chart shows a completed five-wave decline from June 15, culminating in a momentum divergence at the low, which supported the recent bounce. **BTC Weekly Outlook & Strategy (Jul 6-12):** * **Core View:** Focus on the high point of the daily rebound from $57,820. * **Key Levels:** * Resistance: $64,500-$65,700; $67,300; $69,500-$71,000. * Support: $60,950-$62,300; $57,820; $55,000. * **Strategy:** * **Mid-term:** Maintain ~20% short position. Consider increasing shorts to <50% if price stalls in the $65,700-$67,300 zone with confirming model signals. * **Short-term:** Use 30% capital for swing trades between su...

This weekly report conducts a multi-period technical structure analysis focusing on BTC and HYPE. For Bitcoin, the analysis begins with the daily and 4-hour charts, examining the correction structure since the May 6th peak. Combined with a proprietary quantitative model, it offers predictions for key resistance and support levels this week, along with medium- and short-term trading paths. The HYPE section concentrates on the 4-hour chart trend, analyzing the structural evolution of the current rebound and providing corresponding risk control suggestions for this week's short-term operations. Details are as follows.

Last Week's Strategy Verification

  • BTC Market Prediction Verification: Last week's article explicitly stated that Bitcoin's short-term correction was nearing its end. The actual market movement largely aligned with the predicted path, validating the forward-looking judgment.
  • HYPE Market Prediction Verification: Last week's article pointed out that a short-term entry opportunity for long positions in HYPE was about to emerge. Current market movements have confirmed this judgment.

I. Multi-Period Trend Structure Analysis of Bitcoin

1. Daily Chart Trend Structure Analysis

Bitcoin Daily Candlestick Chart
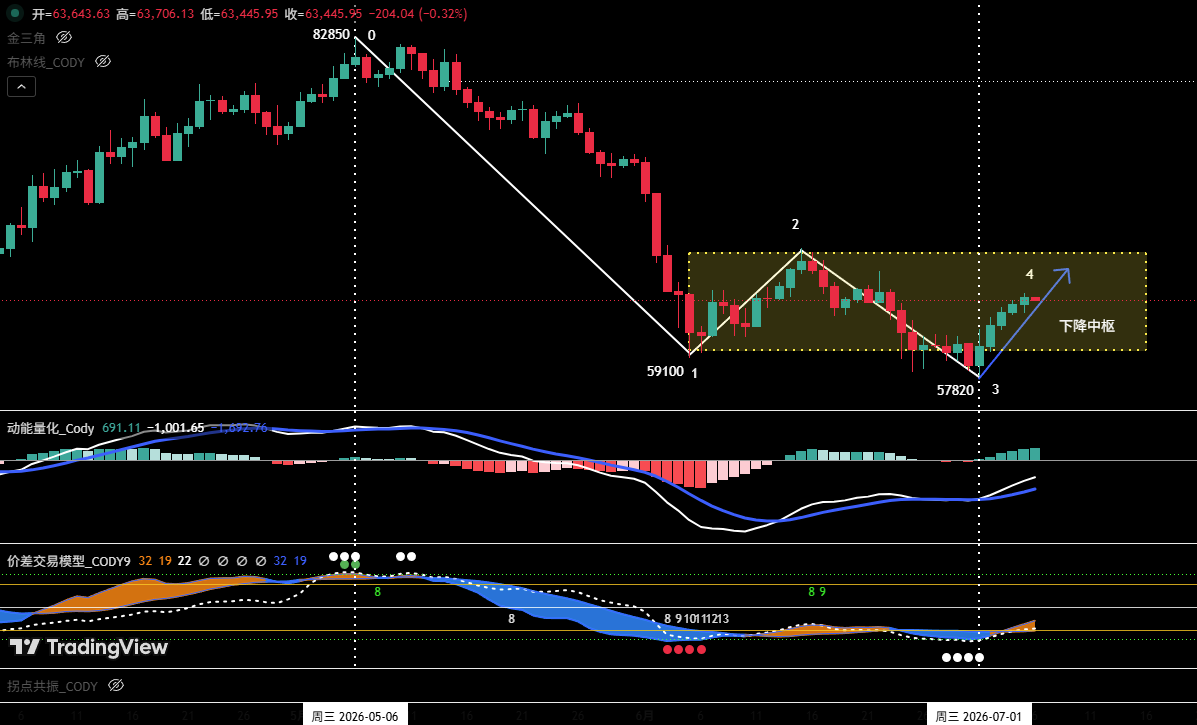
Figure 1

1. As shown in Figure 1: The correction that began from the May 6th high of $82,850 has clearly formed a four-stage correction structure on the daily chart, from "Point 0" to "Point 4".

2. The market is currently in the (3-4) rebound phase. The final position of "Point 4" will determine the short-term price direction.

  • Path One: If the rebound price at "Point 4" can break through the resistance at $65,700, the probability of a subsequent pullback directly breaking below the support at the July 1st low of $57,820 will be significantly reduced. In this scenario, the market is expected to rebound again after the correction ends, with the recent overall trend likely entering a range-bound consolidation pattern. The longer this consolidation structure persists, the more it helps to slow downward momentum and accumulate strength for a subsequent bullish counterattack.
  • Path Two: If the rebound price at "Point 4" fails to reach $65,700, or even falls below $64,500, the probability of a subsequent pullback directly breaking below $57,820 increases substantially, making it more likely for the market to continue its downward trend.

3. Analysis based on the proprietary quantitative model indicates a high probability of the market entering range-bound consolidation (i.e., Path One).

2. Hourly Chart Trend Structure Deep Dive (Using 4-hour as Analysis Period)

Bitcoin 4-hour Candlestick Chart
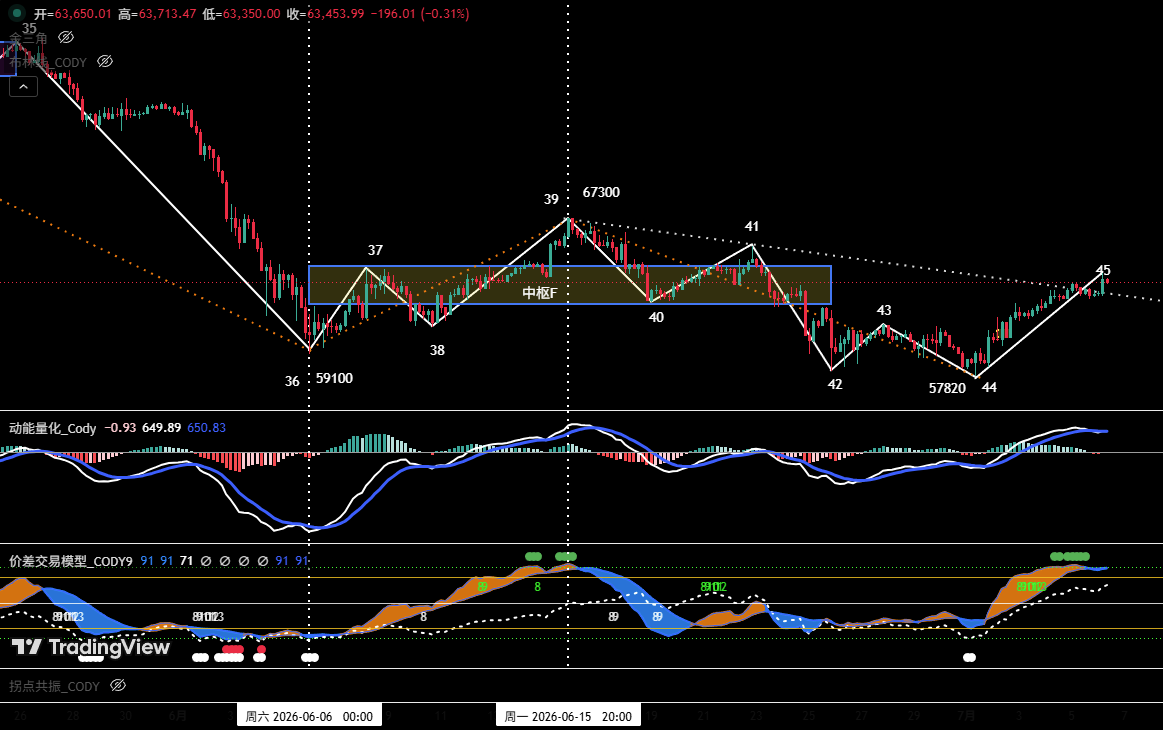
Figure 2

1. Last week's review pointed out: "If the end of Point 44 is below $58,110 accompanied by the formation of a momentum bottom divergence, the market will present a rebound opportunity." Last week's price action validated this judgment, with the actual movement highly consistent with the predicted structure.

2. On the 4-hour chart, the hourly-level decline wave that started from the June 15th high of $67,300 has completed a full five-wave structure; simultaneously, at the end of the correction, a clear momentum bottom divergence formed between low points "Point 44" and "Point 42," providing technical support for the subsequent oversold rebound.

3. The market is currently in the (44-45) rebound phase. From Figure 2, the current rebound high "Point 45" has broken above the lower boundary of the previous "Falling Channel F" (around $62,300), indicating short-term momentum is shifting in favor of bulls. If the price can further break through "Point 41" (around $65,700), it would signal an upgrade in rebound strength, significantly reducing the probability of a subsequent pullback directly breaking below "Point 44" (around $57,820).

II. Bitcoin Weekly Market Forecast and Trading Strategy (07.06~07.12)

1. BTC Weekly Market Trend Forecast

Core View: Focus on the high point of the daily oversold rebound starting from the low of $57,820.

2. Core Resistance Levels:

• First Resistance Zone: $64,500~$65,700 area (previous significant high/low points)

• Second Resistance Zone: Around $67,300 (previous significant resistance area)

• Third Resistance Zone: $69,500~$71,000 area (previous significant resistance area)

3. Core Support Levels:

• First Support Level: $60,950~$62,300 area (previous significant support)

• Second Support Level: Around $57,820 (previous significant support)

• Third Support Level: Around $55,000 (previous significant support)

4. Weekly Trading Strategy

1 Medium-Term Strategy:

Bitcoin Daily Candlestick Chart (Position Monitoring Model)
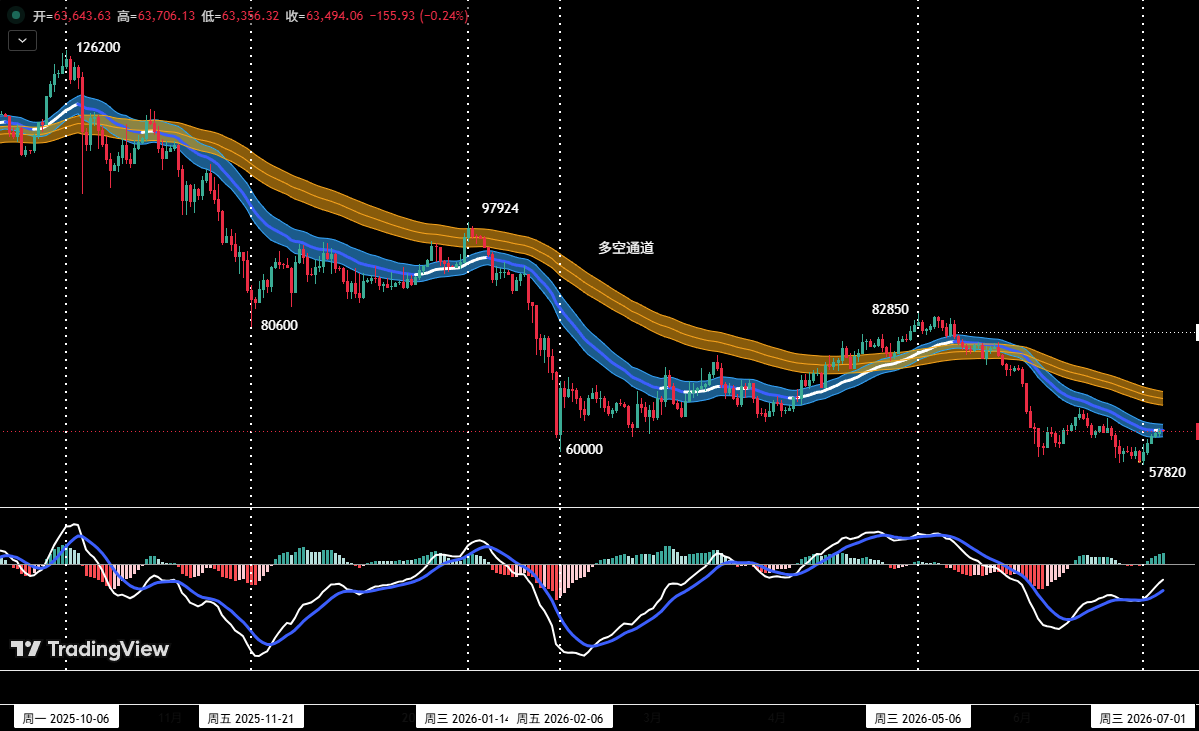
Figure 3

As shown in Figure 3, the price has effectively broken below the "Bull-Bear Channel," confirming a shift to a bear-dominated market structure.

  • Current medium-term short positions can be maintained at around 20%.
  • If the price rebounds to the $65,700~$67,300 zone and shows signs of stagnation, combined with top signals from the proprietary quantitative model, consider increasing medium-term short positions to within 50%.

2 Short-Term Strategy

Utilize 30% of capital, set stop-losses, and seek "price difference" opportunities based on support and resistance levels (using 30-minute/60-minute charts as operational cycles).

3 Short-Term Operation Contingency Plans

To dynamically respond to the market's complex evolution, two specific operational plans, A and B, are drafted in advance:

  • Plan A: Testing Short Positions in Strong Resistance Zone
  • Entry: If the price rebounds to the $65,700~$67,300 zone and meets resistance, combined with quantitative model top signals, establish short positions of around 30%.
  • Risk Control: Set initial stop-loss.
  • Exit: Gradually close positions to take profits when the price adjusts near important support levels, combined with model signals.
  • Plan B: Light Long Positions in Strong Support Zone
  • Entry: If the price breaks above the $65,700 zone, meets resistance, pulls back, and stabilizes near the strong support of $57,820, showing signs of bottoming, combined with quantitative model bottom signals, establish long positions of around 15%.
  • Risk Control: Set initial stop-loss.
  • Exit: Gradually close positions to take profits when the price rebounds near important resistance levels, combined with model signals.

III. HYPE Hourly Chart Trend Structure Analysis

HYPE 4-hour Candlestick Chart
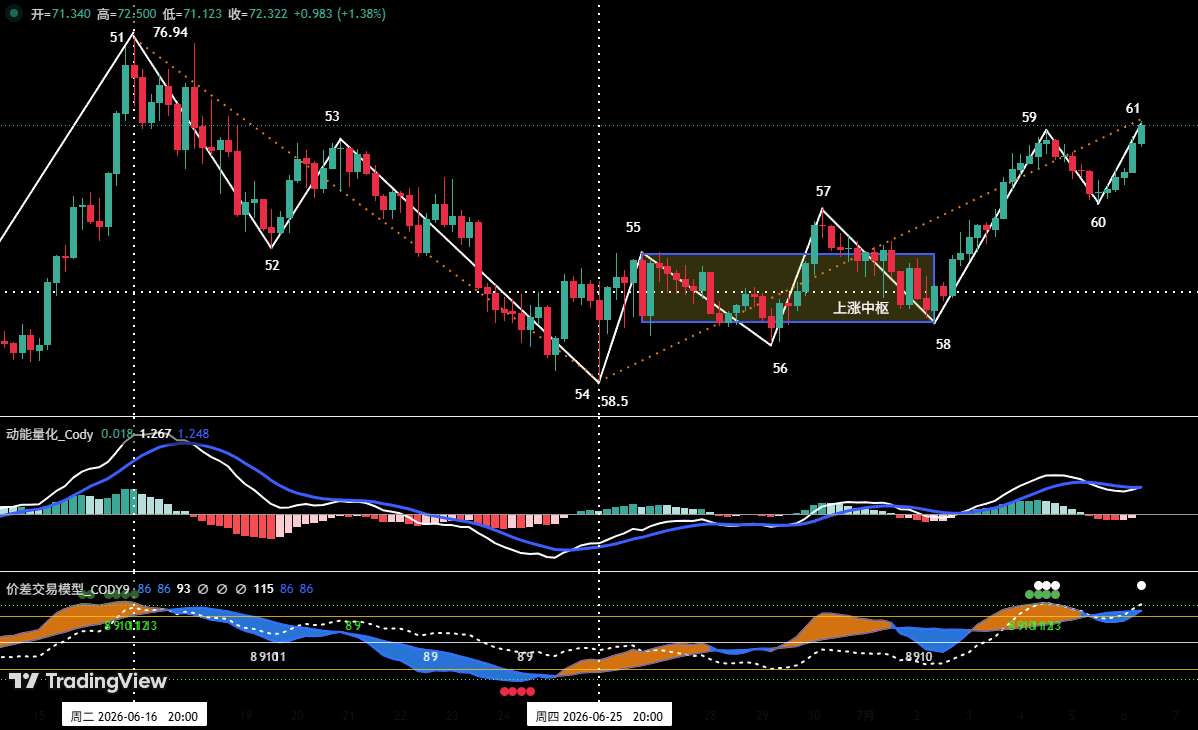
Figure 4

  1. As shown in Figure 4, last week's review stated: "If 'Point 56' is higher than 'Point 54', it forms a 'Double Bottom' pattern, potentially ending this correction, with a high probability of a rebound starting from 'Point 56'." To date, the market movement closely aligns with the analysis. In last week's actual movement, HYPE price rose from "Point 56" (around $60.55) to "Point 59" (around $72.06), with a maximum gain of approximately 19.01%.
  2. Analyzing the 4-hour chart, the rebound in HYPE starting from the June 25th low of $58.5 (Point 54) can be subdivided into a seven-wave upward structure on the 4-hour cycle: 54-55, 55-56, 56-57, 57-58, 58-59, 59-60, 60-61.
  3. The price is currently in the 60-61 upward phase, with the overall upward structure complete. However, the proprietary "Price Difference Trading Model" detected top warning signals at "Point 59" and "Point 61," and the price is approaching the historical high area near $76.94. Therefore, blind chasing of rallies is not advisable at this moment; remain vigilant against short-term correction risks.

IV. HYPE Weekly Market Forecast and Short-Term Trading Strategy

1. HYPE Weekly Market Trend Forecast

Core Resistance Levels

  • First Resistance: Around $75~$76.94
  • Second Resistance: Around $80

Core Support Levels

  • First Support: Around $68
  • Second Support: Around $65.5
  • Third Support: $60.5~$61.5 area

Core View for the Week: When the price rises to the $75~$76.94 area, observe the battle outcome between bulls and bears over this zone.

2. HYPE Weekly Short-Term Trading Strategy

This week's focus is on closing positions to lock in profits and prevent risks. If long positions were established in the support zone according to the plan, it is recommended to move the stop-loss up to around $68 to protect profits (or decide independently). If the market shows signs of adjustment, close positions promptly to take profits.

V. HYPE Short-Term Operation Review

We strictly followed the operation plan and, based on trading signals from our proprietary "Price Difference Trading Model" and "Momentum Quantitative Model," completed one short-term (long) trade last week, achieving a total trading profit of approximately: 10.23%.

Short-Term Trade 1: (See Table 1)

1. HYPE Short-Term Trade Details Summary:(Leverage*1x)
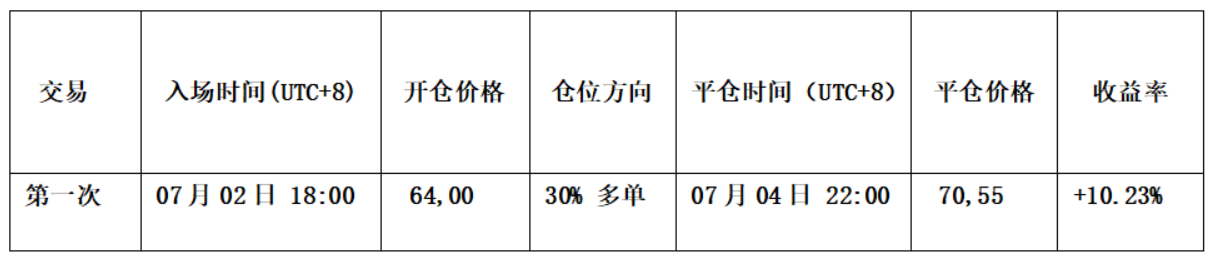
Table 1

2. Short-Term Trade Review:(See Figure 5)

• Entry Strategy:

a. Based on an accurate judgment of the overall upward price trend.

b. When the price effectively broke through the short-term downtrend line, and both the "Price Difference Trading Model" and "Momentum Quantitative Model" simultaneously issued bottom divergence resonance signals.

Therefore, we established a 30% long position at $64.

• Exit Strategy:

a. When the price rose near the $72 resistance and showed signs of stagnation, with the candlesticks forming a "Top Reversal" pattern.

b. The "Price Difference Trading Model" triggered a strong top warning signal (green dot + white dot), forming a top resonance signal with the "Momentum Quantitative Model".

Therefore, we closed all positions around $70.55.

• Summary: This trade successfully yielded a profit of approximately 10.23%.

HYPE_60-minute Candlestick Chart:(Momentum Quantitative Model + Price Difference Trading Model)
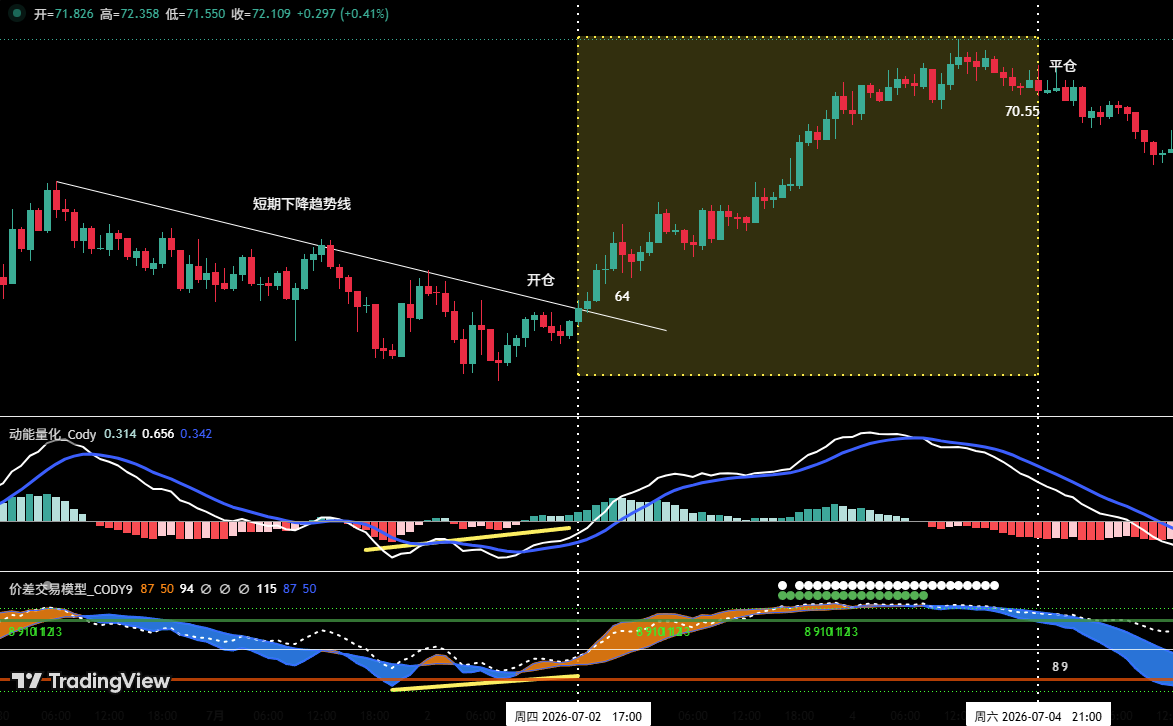
Figure 5 (Short-Term Trade Illustration)

VI. Special Notes

  1. When opening a position: Immediately set an initial stop-loss.
  2. When profit reaches 1%: Move the stop-loss to the entry price (break-even point) to ensure capital safety.
  3. When profit reaches 2%: Move the stop-loss to the 1% profit level.
  4. Continuous tracking: Thereafter, for every additional 1% profit the price makes, move the stop-loss up by 1% accordingly, dynamically protecting and locking in profits.

Financial markets change rapidly, and all market analysis and trading strategies require dynamic adjustment. All views, analytical models, and operational strategies mentioned in this article are derived from personal technical analysis, intended solely for personal trading log purposes. They do not constitute any investment advice or basis for operation. The market involves risks, investing requires caution. Please do not make decisions based solely on this content.


Cryptos en tendance

Questions liées

QWhat are the two key technical analysis paths for Bitcoin's current rebound based on the 'Endpoint 4' price position mentioned in the article?

APath One: If the rebound at 'Endpoint 4' can break above the $65,700 resistance, a subsequent pullback is less likely to directly breach the July 1st low of $57,820. The market is then expected to move into a range-bound consolidation, which would help dissipate selling pressure and build momentum for a future upward move. Path Two: If the rebound at 'Endpoint 4' fails to reach $65,700 or even stays below $64,500, a subsequent pullback has a high probability of directly breaking below the $57,820 support, indicating a continuation of the prior downtrend. According to the author's proprietary quantitative model, the probability of Path One (range-bound consolidation) is significantly higher.

QAccording to the 4-hour chart analysis for Bitcoin, what specific condition did the author previously predict that would signal a rebound opportunity, and how did the market action last week validate it?

AThe author predicted that if 'Endpoint 44' finished below $58,110 and was accompanied by the formation of a momentum bottom divergence, the market would present a rebound opportunity. Last week's market action validated this prediction, as the actual price movement aligned closely with the forecasted structure. The low at 'Endpoint 44' (around $57,820) did fall below the specified level, and a momentum divergence was confirmed, leading to the current oversold rebound.

QWhat is the core trading strategy for HYPE this week (the week of the article's publication) according to the author's analysis?

AThe core trading strategy for HYPE this week is to prioritize locking in profits and managing risk. If long positions were already established in support zones as per previous plans, it is advised to move the stop-loss up to around $68 to protect profits (or adjust based on individual judgment). If the market shows signs of a pullback, positions should be closed promptly to realize gains. The article emphasizes caution against blindly chasing the rally near the historical high region of $76.94.

QDescribe the specific conditions (entry and exit signals) for the HYPE short-term long trade that resulted in a 10.23% profit, as detailed in the trade复盘 (review).

AEntry Conditions: 1. Based on an accurate研判 of the overall uptrend. 2. Price effectively broke through a short-term descending trendline. 3. The proprietary 'Price Difference Trading Model' and 'Momentum Quantitative Model' simultaneously issued bottom divergence共振 signals. Based on these conditions, a 30% long position was established at $64. Exit Conditions: 1. Price rose near the $72 resistance level and showed signs of stagnation, with the K线 forming a 'top分型' pattern. 2. The 'Price Difference Trading Model' triggered a strong top预警 signal (Green dot + White dot), which formed a top共振 signal with the 'Momentum Quantitative Model'. Based on these conditions, the entire position was closed around $70.55, resulting in a profit of approximately 10.23%.

QWhat is the author's recommended dynamic stop-loss management rule once a trade becomes profitable, as outlined in the '特别提示' (Special Notes) section?

AThe author's recommended dynamic stop-loss management rules are: 1. Upon opening a position: Immediately set an initial stop-loss. 2. When profit reaches 1%: Move the stop-loss to the entry price (breakeven point) to ensure capital safety. 3. When profit reaches 2%: Move the stop-loss to the 1% profit level. 4. Continuous tracking: Thereafter, for every additional 1% gain in profit, move the stop-loss up by 1% accordingly, dynamically protecting and locking in profits.

Lectures associées

La fête des puces se refroidit ? Morgan Stanley (Wilson) : Les capitaux se tournent vers des géants de l'IA comme Microsoft, Amazon

Le marché boursier américain pourrait peiner à atteindre de nouveaux sommets à court terme, les capitaux se détournant des actions de semi-conducteurs, qui ont pourtant connu de fortes hausses cette année, au profit des géants de l'infrastructure cloud d'IA, ou "hyperscalers". Michael Wilson, stratège en chef des actions de Morgan Stanley, souligne dans un récent rapport que l'élan du secteur des semi-conducteurs s'essouffle. Les investisseurs se tournent désormais vers les leaders de l'informatique intensive pour l'IA, tels que Microsoft, Amazon et Meta, qui ont sous-performé cette année. Cette rotation intervient dans un contexte de faiblesse générale du marché, ce qui devrait continuer à peser sur les indices principaux. Wilson maintient son objectif pour le S&P 500 à 8000 points d'ici fin d'année, soit une hausse potentielle d'environ 7%. L'indice des semi-conducteurs de Philadelphie a reculé de près de 14% depuis son pic historique le mois dernier, suscitant des inquiétudes quant à une surévaluation, malgré une hausse de 123% depuis septembre dernier. Selon Wilson, ce ralentissement de l'élan affecte désormais les grandes capitalisations, augmentant la pression sur les indices. À l'inverse, les hyperscalers comme Microsoft, Amazon et Meta présentent un attrait certain dans l'écosystème de l'IA, bénéficiant du soutien de leurs activités principales solides. Un panier d'actions d'hyperscalers compilé par UBS a même enregistré une baisse de 2% depuis septembre, suggérant un potentiel de rattrapage par rapport aux semi-conducteurs. Toutefois, Wilson note que ces entreprises pourraient commencer à réviser à la baisse leurs prévisions de dépenses en capital (capex), un point clé pour les investisseurs. Cette rotation pourrait également profiter à d'autres secteurs tels que la consommation discrétionnaire, les transports et les biotechnologies. Cette vision est partagée par Mislav Matejka de JP Morgan, qui estime que la dynamique du marché s'élargira au-delà de la technologie dans le second semestre, l'IA n'étant pas la seule thématique en jeu.

链捕手Il y a 23 mins

La fête des puces se refroidit ? Morgan Stanley (Wilson) : Les capitaux se tournent vers des géants de l'IA comme Microsoft, Amazon

链捕手Il y a 23 mins

Le premier philosophe IA au monde, ses 9 ans chez Google DeepMind : Se battre pour la sécurité de l'AGI

Le premier philosophe de l’IA mondiale a passé neuf ans chez Google DeepMind, où il a œuvré pour la sécurité de l’AGI. Iason Gabriel a rejoint DeepMind en 2017, alors seul philosophe dans un laboratoire d’IA de pointe, avec pour mission de réfléchir à l’éthique de l’intelligence artificielle. Son cadre d’« alignement à quatre parties » – conciliant les intérêts du système d’IA, de l’utilisateur, du développeur et de la société – est devenu un outil opérationnel pour définir le comportement de Gemini. Ses travaux sur les risques de l’anthropomorphisme ont directement influencé les principes de conception des modèles de langage de Google, les entraînant à ne pas se faire passer pour des humains. Pourtant, la course financière (6700 milliards de dollars investis par les géants tech) et les impératifs commerciaux accélèrent le déploiement plus vite que les garde-fous éthiques. Un cas tragique en 2025 a montré les limites des protections, un utilisateur ayant contourné les interventions de sécurité de Gemini. De plus, la décision de Google en 2026 d’autoriser les applications militaires de son IA marque un recul par rapport aux principes initiaux de DeepMind. Aujourd’hui, les recherches de Gabriel se tournent vers l’impact systémique de l’AGI sur l’économie et la société, anticipant une transformation comparable à la révolution industrielle. Après neuf ans à se demander ce qu’est l’IA, la question fondamentale qui émerge est désormais : qui sommes-nous ?

marsbitIl y a 1 h

Le premier philosophe IA au monde, ses 9 ans chez Google DeepMind : Se battre pour la sécurité de l'AGI

marsbitIl y a 1 h

Gemini 3.5 Pro fuité en secret, rattrapant Fable 5 en développement front-end

**Gemini 3.5 Pro : La fuite révèle une avancée majeure en génération de code front-end** Des informations fuient concernant Gemini 3.5 Pro, la future version « haut de gamme » de Google, dont le lancement est anticipé pour le 17 juillet. La révélation la plus frappante porte sur ses performances exceptionnelles dans la génération de code visuel et d'interfaces utilisateur (UI). Selon les premiers retours de développeurs ayant testé une version divulguée, Gemini 3.5 Pro montre un saut de qualité remarquable dans ce domaine précis. Il génère des interfaces au design plus raffiné, avec une meilleure gestion des couleurs et de l'espace. Sa capacité à produire du code front-end « prêt à l'emploi » et des graphiques SVG complexes de haute fidélité en une seule itération est particulièrement saluée. Certains comparent même ses résultats, en termes d'esthétique et d'atmosphère, favorablement à ceux de Fable 5, un modèle concurrent réputé. Cependant, cette fuite nuance également cet enthousiasme. Dans les tâches de raisonnement complexe, d'ingénierie logicielle à grande échelle ou d'exécution de tâches longues et multi-étapes (comme celles des benchmarks SWE-Bench Pro), Gemini 3.5 Pro serait toujours à la traîne derrière des modèles comme Fable 5 ou GPT-5.6. Sa force semble donc ciblée. La raison du retard de sa sortie serait liée à un processus de ré-entraînement complet (« préformation ») sur une nouvelle architecture de base, plus performante que celle de son homologue léger, Gemini 3.5 Flash. Cette même base servirait également à développer un futur modèle de génération d'images, nommé « Nano Banana Pro », destiné à concurrencer GPT-Image 2 d'OpenAI. Ainsi, Google miserait sur cette refonte pour regagner du terrain sur deux fronts : le code front-end et la génération d'images. Si les affirmations de la fuite se confirment le 17 juillet, Gemini 3.5 Pro pourrait redistribuer les cartes dans un secteur de l'IA en perpétuelle accélération.

marsbitIl y a 1 h

Gemini 3.5 Pro fuité en secret, rattrapant Fable 5 en développement front-end

marsbitIl y a 1 h

Trading

Spot

Articles tendance

Comment acheter HYPE

Bienvenue sur HTX.com ! Nous vous permettons d'acheter Hyperliquid (HYPE) de manière simple et pratique. Suivez notre guide étape par étape pour commencer votre parcours crypto.Étape 1 : Création de votre compte HTXUtilisez votre adresse e-mail ou votre numéro de téléphone pour ouvrir un compte sur HTX gratuitement. L'inscription se fait en toute simplicité et débloque toutes les fonctionnalités.Créer mon compteÉtape 2 : Choix du mode de paiement (rubrique Acheter des cryptosCarte de crédit/débit : utilisez votre carte Visa ou Mastercard pour acheter instantanément Hyperliquid (HYPE).Solde :utilisez les fonds du solde de votre compte HTX pour trader en toute simplicité.Prestataire tiers :pour accroître la commodité d'utilisation, nous avons ajouté des modes de paiement populaires tels que Google Pay et Apple Pay.P2P :tradez directement avec d'autres utilisateurs sur HTX.OTC (de gré à gré) : nous offrons des services personnalisés et des taux de change compétitifs aux traders.Étape 3 : stockage de vos Hyperliquid (HYPE)Après avoir acheté vos Hyperliquid (HYPE), stockez-les sur votre compte HTX. Vous pouvez également les envoyer ailleurs via un transfert sur la blockchain ou les utiliser pour trader d'autres cryptos.Étape 4 : tradez des Hyperliquid (HYPE)Tradez facilement Hyperliquid (HYPE) sur le marché Spot de HTX. Il vous suffit d'accéder à votre compte, de sélectionner la paire de trading, d'exécuter vos trades et de les suivre en temps réel. Nous offrons une expérience conviviale aux débutants comme aux traders chevronnés.

740 vues totalesPublié le 2024.12.11Mis à jour le 2026.06.02

Comment acheter HYPE

Discussions

Bienvenue dans la Communauté HTX. Ici, vous pouvez vous tenir informé(e) des derniers développements de la plateforme et accéder à des analyses de marché professionnelles. Les opinions des utilisateurs sur le prix de HYPE (HYPE) sont présentées ci-dessous.

活动图片