SUI Action: Weekly Pattern Suggests Price Is Coiling For A Bigger Move

bitcoinistPublié le 2025-06-22Dernière mise à jour le 2025-06-22

Résumé

The SUI/USDT weekly chart is attracting attention as the price action tightens within a defined range. After a period of...

Trusted Editorial content, reviewed by leading industry experts and seasoned editors. Ad Disclosure

The SUI/USDT weekly chart is attracting attention as the price action tightens within a defined range. After a period of decline and consolidation, the asset is stabilizing, with key support levels holding firm. The structure suggests that the asset may be gearing up for a potential shift in trend.

Price Action Coiling Up — Will SUI Snap Upward?

SUI has formed a symmetrical triangle squeeze, a pattern known for preceding explosive moves. Its price recently dipped below the lower trendline, raising alarms for a potential breakdown. However, Atres Crypto Academy noted on X that this may have been a bull trap, a temporary shakeout before a sharp reversal.

If SUI snaps back into the triangle with strong momentum, it would signal that the breakdown was a false move, and bulls may be regaining control. In that case, the stage would be for an upside breakout, with the target set at $3.50 or more.
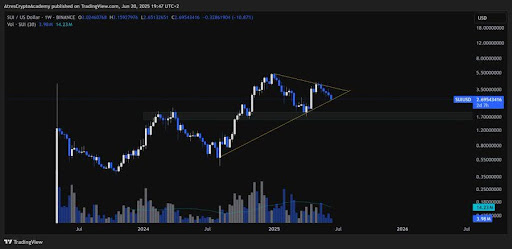
SUI
Source: Atres Crypto on X

SUI price action is forming a falling wedge pattern, a bullish reversal setup. After dropping 37% from its May highs, the altcoin is now testing a key support zone between $2.70 and $3.00, an area that has typically drawn buying interest. WEBBZ.SUI highlighted that a confirmed breakout could propel the token toward the $4.50 to $5.00 region, and if support fails to hold, the next critical level will be the $2.00 zone.

According to Gemxbt, the 1-hour chart is showing a consolidation phase around the $2.85 level, with the price stabilizing above the 5, 10, and 20-hour moving averages, signaling strength and support in this zone.

The Relative Strength Index (RSI) is also trending upward, steadily moving away from oversold territory. This suggests that bullish momentum is building. Furthermore, the Moving Average Convergence Divergence (MACD) is approaching a bullish crossover, indicating possible upward price movement if confirmed by increased volume.

Signs Of Strength Emerging 

SUI has quietly surged from under $0.60 to over $4.00 in less than a year, making an impressive nearly 7x gain despite pullbacks. The price-performance underscores the growing interest and momentum behind the token.

Emilio Crypto Bojan mentioned that the fundamentals are starting to catch up with the price action. DeFi aggregator volume has now surpassed $45 billion, with a 19% increase over the past 30 days, and bullish vibes are building ahead.

SUI is showing signs of strength after holding the critical support zone at $2.70, suggesting that a potential bounce is building. Presently, the market structure shows that conditions are favorable for a reversal, provided the bulls step in decisively. Cult Babe also revealed that the price action appears to be preparing for an upward move, with the key focus of reclaiming the $2.90 resistance level.

SUI
SUI trading at $2.7 on the 1D chart | Source: SUIUSDT on Tradingview.com
Featured image from Shutterstock, chart from Tradingview.com
Editorial Process for bitcoinist is centered on delivering thoroughly researched, accurate, and unbiased content. We uphold strict sourcing standards, and each page undergoes diligent review by our team of top technology experts and seasoned editors. This process ensures the integrity, relevance, and value of our content for our readers.

Godspower Owie is my name, and I work for the news platforms NewsBTC and Bitcoinist. I sometimes like to think of myself as an explorer since I enjoy exploring new places, learning new things, especially valuable ones, and meeting new people who have an impact on my life, no matter how small. I value my family, friends, career, and time. Really, those are most likely the most significant aspects of every person's existence. Not illusions, but dreams are what I pursue.

Cryptos en tendance

Lectures associées

Le succès de Robinhood Chain prouve qu'Ethereum n'est pas mort

Le succès de Robinhood Chain prouve qu'Ethereum est plus vivant que jamais. Contrairement aux affirmations selon lesquelles les entreprises réelles éviteraient les L1/L2, Robinhood a précisément choisi le modèle L1+L2 d'Ethereum pour sa blockchain dédiée. La plateforme utilise Ethereum pour le règlement, la disponibilité des données (via les blobs) et la sécurité, tout en adoptant ETH comme token de gaz natif. Cet exemple illustre un changement de paradigme dans la crypto : l'ère de la monétisation des tokens cède la place à une économie on-chain axée sur des modèles commerciaux en espèces réels. Les entreprises traditionnelles cherchant à optimiser leurs activités existantes privilégient désormais l'infrastructure pour ses avantages commerciaux – réduction des risques, contrôle, personnalisation et accès à la liquidité – plutôt que pour promouvoir un token natif. La structure en « haltère » d'Ethereum répond parfaitement à ces besoins : la couche L1 offre une base décentralisée, neutre et liquide, tandis que les L2 permettent un environnement d'exécution hautement performant, personnalisable et contrôlé par l'opérateur. Cette approche évite aux entreprises de supporter le coût et la complexité de créer et maintenir une L1 souveraine. Comme Robinhood et Coinbase (avec Base) l'ont démontré, le choix d'une L2 Ethereum est une décision commerciale rationnelle, et non idéologique. Cette tendance devrait renforcer le réseau Ethereum et l'utilité de l'ETH, car son intégration dans les produits grand public accroîtra sa distribution, sa liquidité et son effet de réseau monétaire. Robinhood n'est pas une exception, mais un signal fort de l'avenir des blockchains pour les entreprises réelles.

Odaily星球日报Il y a 40 mins

Le succès de Robinhood Chain prouve qu'Ethereum n'est pas mort

Odaily星球日报Il y a 40 mins

Trading

Spot

Articles tendance

Comment acheter MOVE

Bienvenue sur HTX.com ! Nous vous permettons d'acheter Movement (MOVE) de manière simple et pratique. Suivez notre guide étape par étape pour commencer votre parcours crypto.Étape 1 : Création de votre compte HTXUtilisez votre adresse e-mail ou votre numéro de téléphone pour ouvrir un compte sur HTX gratuitement. L'inscription se fait en toute simplicité et débloque toutes les fonctionnalités.Créer mon compteÉtape 2 : Choix du mode de paiement (rubrique Acheter des cryptosCarte de crédit/débit : utilisez votre carte Visa ou Mastercard pour acheter instantanément Movement (MOVE).Solde :utilisez les fonds du solde de votre compte HTX pour trader en toute simplicité.Prestataire tiers :pour accroître la commodité d'utilisation, nous avons ajouté des modes de paiement populaires tels que Google Pay et Apple Pay.P2P :tradez directement avec d'autres utilisateurs sur HTX.OTC (de gré à gré) : nous offrons des services personnalisés et des taux de change compétitifs aux traders.Étape 3 : stockage de vos Movement (MOVE)Après avoir acheté vos Movement (MOVE), stockez-les sur votre compte HTX. Vous pouvez également les envoyer ailleurs via un transfert sur la blockchain ou les utiliser pour trader d'autres cryptos.Étape 4 : tradez des Movement (MOVE)Tradez facilement Movement (MOVE) sur le marché Spot de HTX. Il vous suffit d'accéder à votre compte, de sélectionner la paire de trading, d'exécuter vos trades et de les suivre en temps réel. Nous offrons une expérience conviviale aux débutants comme aux traders chevronnés.

425 vues totalesPublié le 2024.12.13Mis à jour le 2026.06.02

Comment acheter MOVE

Discussions

Bienvenue dans la Communauté HTX. Ici, vous pouvez vous tenir informé(e) des derniers développements de la plateforme et accéder à des analyses de marché professionnelles. Les opinions des utilisateurs sur le prix de MOVE (MOVE) sont présentées ci-dessous.

活动图片