Crypto market expert, ChartNerd, has said that XRP’s recent flash crash could be a “blessing in disguise.” According to the analyst, the drawdown has placed the cryptocurrency at the exact sell-side liquidity the analyst mentioned in previous reports, increasing the potential for a bullish takeover even as market dynamics remain uncertain and weak.
Why The XRP Crash Could Be A Blessing In Disguise
In an X post on January 9, ChartNerd suggested that the recent sell-off that saw the XRP price crash by more than 4.6% this week could end up working in the market’s favor. He said the decline may be a “huge” blessing in disguise, as it has sent the price directly into a long-anticipated sell-side liquidity zone.
The analyst shared a chart highlighting the sell-side liquidity pocket around the $1.8 level on the monthly heatmap. Rather than signaling weakness, ChartNerd indicated XRP’s latest move aligned with areas where bulls have consistently shown interest. He noted that this liquidity zone had acted as a key support area for the altcoin for approximately 13 months, with bulls repeatedly stepping in to prevent deeper downside.
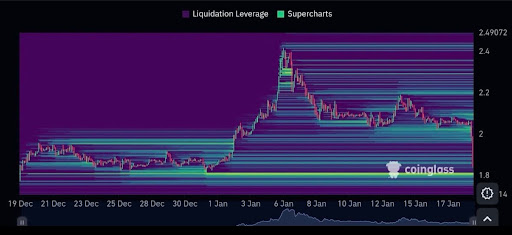
Notably, XRP experienced a major flash crash this week, sending its price tumbling from above $2 to below $1.95. Following its earlier January high near $2.49, the cryptocurrency also declined sharply, now settling into this highlighted liquidity band. On the heatmap, the area around $1.80 appears to be the most intense and concentrated, reflecting strong historical engagement and repeated price reactions.
ChartNerd has characterized XRP’s retest of sell-side liquidity as a “clarity response” rather than a structural breakdown. Typically, a decline of this magnitude can trigger fear and uncertainty in the market about a cryptocurrency’s next move. However, ChartNerd has said that he is now closely monitoring how the market responds to this new reaction. His analysis offers hope that the recent crash may ultimately benefit investors by establishing a clearer directional bias, rather than simply being a destructive sell-off that undermines its broader structure.
While the analyst’s report adds significant context to XRP’s latest move, community members have responded with their own forecasts. Some believe that the recent crash into sell-side liquidity could trigger another breakdown to $1.20, which would represent a more than 38% drop from current levels around $1.96. Others, however, remain relatively bullish, opting to wait and see how the market reacts.
Price Stabilizes After Crash
This week, XRP gave up gains that had fueled a major recovery earlier this year. While hovering around $2, XRP repeatedly tested upper resistance levels but failed to break out to the upside. Although the recent decline pushed it back underneath $2, its price has since stabilized and is now consolidating above $1.95.
Interestingly, the pullback has been accompanied by a significant increase in trading volume. Recent reports reveal that XRP’s trading activity spiked across several markets despite its struggling price.