The History of U.S. Stocks is, Behind It, a History of American Wars

marsbitPublicado a 2026-05-08Actualizado a 2026-05-08

Resumen

The article argues that the history of the U.S. stock market is deeply intertwined with American military conflicts. While current Middle East tensions raise economic concerns, major indices like the S&P 500 and Nasdaq continue hitting new highs. Historical analysis shows U.S. wars, from the Spanish-American War to recent conflicts in the Middle East, have often coincided with market gains, as seen in the Dow Jones's performance during these periods. The U.S. transitioned from a war participant to an initiator, with most conflicts post-Vietnam being short, focused on oil, and achieving strategic goals. The market's reaction to war has evolved. Pre-1950s, investor sentiment directly drove swings based on battle outcomes. From the Korean War onward, the focus shifted to economic channels like inflation, oil prices, and fiscal policy. For instance, during the Gulf War, stock movements inversely correlated with oil price swings. The primary beneficiary industries have also changed: coal dominated WWII, oil surged during Korea and Vietnam, but by the Gulf War, the indirect economic impact made consumer staples outperform. Overall, as the U.S. economy grew, the direct market impact of individual wars diminished, giving way to broader macroeconomic factors like interest rates and deficits as the key drivers.

Written by: Li Jia

Source: Wall Street News

When cannons roar, gold pours in. Just as the market is hotly debating whether Middle East conflicts will drag down the global economy, the S&P 500 and Nasdaq indices have both hit new record highs. What exactly does war mean for U.S. stocks?

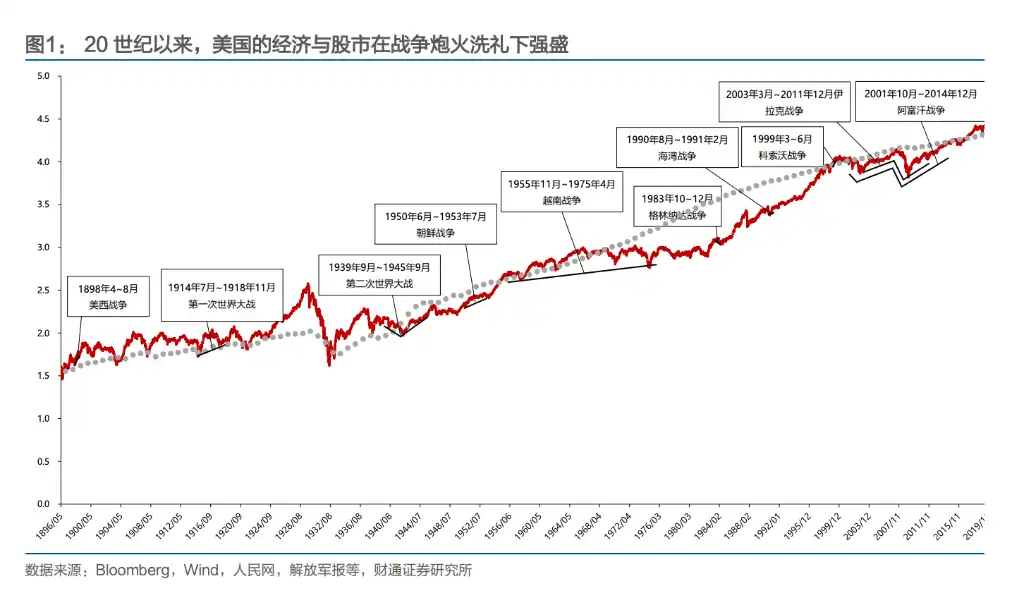
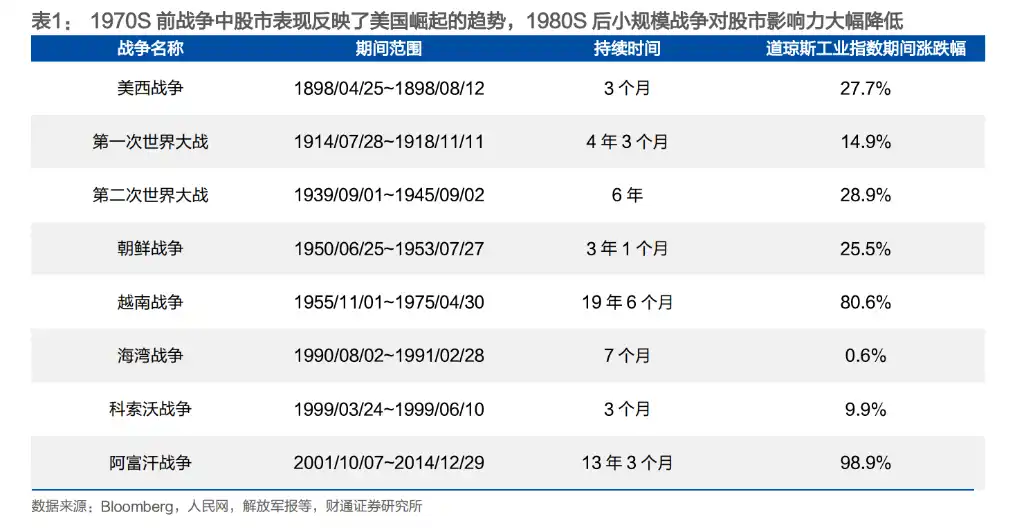
A report from Caitong Securities provides a straightforward answer: War and the long-term bull market in U.S. stocks are not opposites but rather symbiotic. The historical performance of the Dow Jones Industrial Average confirms this—it rose 28% during the Spanish-American War, 26% during the Korean War, and still gained over 80% during the 19-year Vietnam War, while nearly doubling during the Afghanistan War, which spanned the period around the 2008 financial crisis.

Since becoming the world's largest economy at the end of the 19th century, the U.S. has gained substantial benefits from most wars it fought, except for the Vietnam War. From seizing Spanish colonies in the Spanish-American War to profiting handsomely from the two World Wars, and further to the Gulf War and subsequent smaller-scale conflicts centered around oil resources, the U.S. completed its transformation from a 'war participant' to a 'war initiator.'

The reaction path of U.S. stocks amid the sound of gunfire is also clear: During WWII and earlier wars, the market was primarily impacted through sentiment shocks. Starting with the Korean War, this direct effect gradually weakened, and wars increasingly transmitted their impact to the stock market through economic channels like inflation, oil prices, and fiscal deficits.

The Vietnam War was the only war where the U.S. suffered a 'loss,' and it profoundly rewrote its war logic. Since then, almost every conflict initiated by the U.S. has shared three characteristics: short duration, limited geographic scope, and a focus on oil—with all ultimately achieving their objectives.
From 'Taking Advantage of a Fire' to Initiating Trouble: The Three Shifts in American War Strategy

The 1898 Spanish-American War was the first major war actively initiated by the U.S. At that time, domestic monopoly conglomerates urgently needed new markets, investment venues, and sources of raw materials, and Spain's crumbling colonial empire became the ideal target. After the war, the U.S. gained control over Cuba and acquired the Philippine Islands, Guam, and Puerto Rico. The Dow Jones Industrial Average rose 28% during the three-month war, in sync with victories on the main battlefields.

When World War I broke out, the U.S. initially remained neutral. During the market closure in July 1914, investors realized America would become the biggest beneficiary of the European conflict—its homeland, far from the battlefield, could continue production and export arms to Europe. By 1917, American banks, including J.P. Morgan, had provided $10 billion in loans to the British and French governments for purchasing weapons. Although the index fell nearly 10% after the official entry into the war in April 1917, the industrial index had already risen approximately 107% from its low in 1914 to March 1917.

World War II was the crucial conflict that established the U.S. as a global hegemon. At the outbreak in September 1939, U.S. stocks initially fell due to suppressed corporate earnings expectations from the 'excess profits tax'—Congress imposed a tiered tax of up to 95% on profits exceeding $5,000, severely dampening the numerator in the Dividend Discount Model (DDM). It wasn't until the Battle of the Coral Sea and the Battle of Midway in May 1942 turned the tide of war that investors keenly sensed the war's direction, leading U.S. stocks to bottom out and rebound ahead of time. The industrial index rose 82% in the latter half of the war, the transportation index rose 127%, and the utilities index surged 203%.

The Korean War was the first war the U.S. 'did not win.' Although military demand stimulated the post-WWII sluggish economy, the U.S. military failed to achieve its stated objectives. Nonetheless, the Dow Jones Industrial Average still rose 26% throughout the entire period, with the transportation index soaring 86%.

The Vietnam War became a watershed; it was the only war where the U.S. was defeated and gained no benefits.

The U.S. defense budget skyrocketed from $49.6 billion in 1961 to $81.9 billion in 1968 (43.3% of the federal budget), the fiscal deficit ballooned from $3.7 billion to $25 billion, and inflation rose from 1.5% to 4.7%. The U.S. share of the world's total GDP fell from 34% to less than 30%. Post-war, U.S. war strategy shifted completely: it abandoned large-scale ground wars in favor of short-duration, low-casualty, air-strike-centric 'proxy-style' conflicts.

Subsequent wars—the Gulf War, Kosovo War, Afghanistan War, and Iraq War—were all without exception initiated by the U.S., leveraging local conflicts or black swan events. The war zones were mainly concentrated in the Middle East and the Balkans, with the core objectives revolving around oil resource control and military demand.
The Transmission of War to the Stock Market Has Changed: From Sentiment-Driven to Economy-Driven

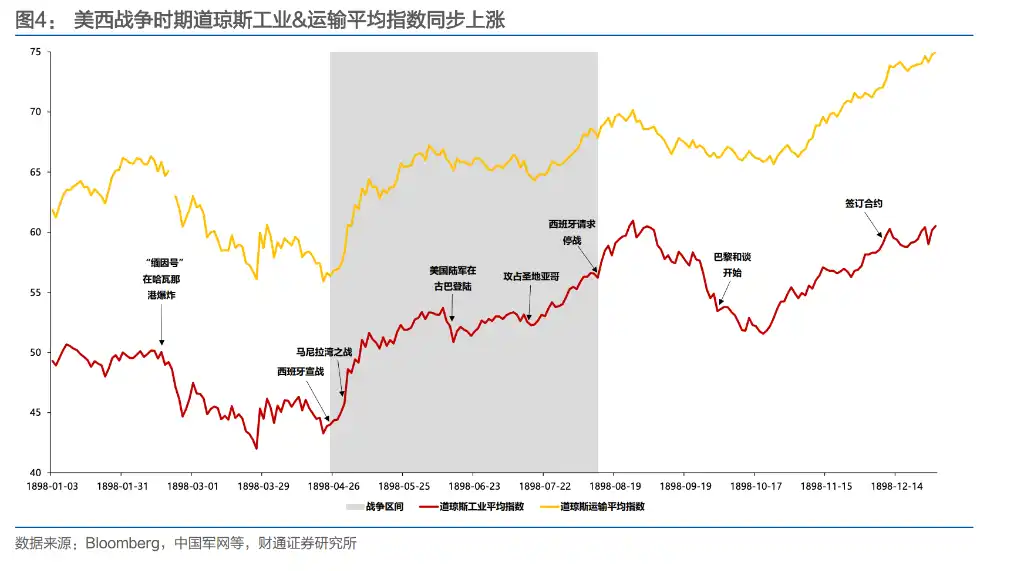
During WWII and earlier, war events often directly impacted investor sentiment. During the Spanish-American War, victories at the Battle of Manila Bay and the Battle of Santiago de Cuba each drove the index up by about 10% within ten days. In contrast, news of the U.S. entering the two World Wars often triggered panic selling.
But starting with the Korean War, this direct impact gradually faded. From November 1950 to February 1951, despite successive retreats by UN and U.S. forces, the U.S. stock market continued to rise—the reason being that the post-WWII stagnant economy restarted during the Korean War: U.S. real GDP grew about 8.7% in 1950 and remained above 8% in 1951. The fiscal expansion brought by the war, in turn, became a catalyst for economic recovery.

This shift became even more pronounced during the Vietnam War. The Battle of Ia Drang in November 1965 (the first large-scale battle for U.S. troops in Vietnam) did not cause a significant market shock; the 'Tet Offensive' launched by North Vietnam in early 1968 also failed to stop U.S. stocks from reaching new highs. What truly drove the market was instead the Federal Reserve tightening credit conditions in 1966 in response to Vietnam War expenditures, along with the two economic recessions of 1969-1970 and 1973-1975. War sentiment had given way to macroeconomic policy and corporate earnings.

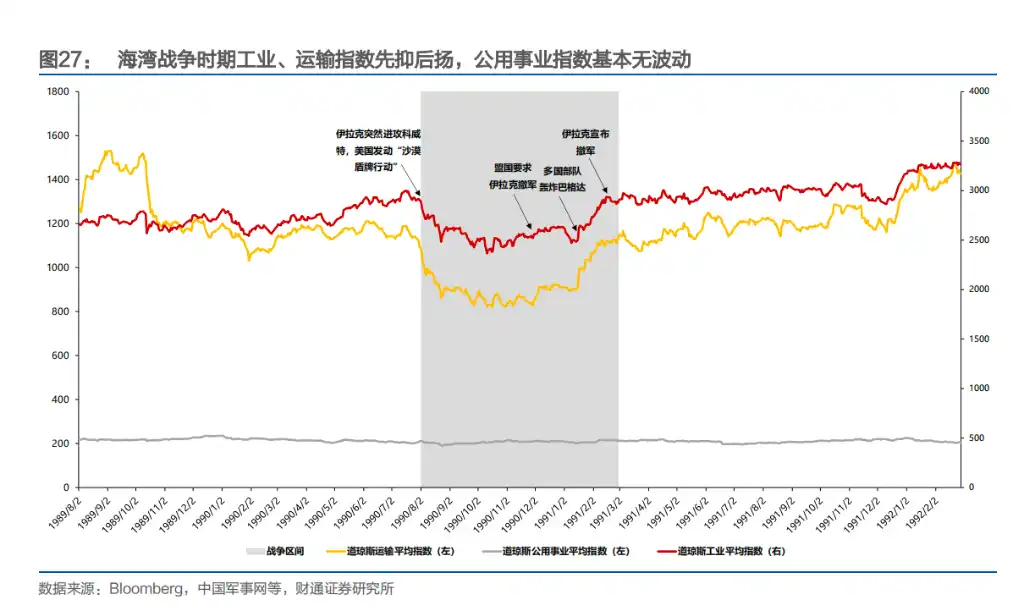
The Gulf War provides the clearest case of 'economic transmission.' After Iraq's invasion of Kuwait in August 1990, oil prices surged, and the market anticipated a U.S. economic recession, pushing S&P 500 valuations to a bottom. When coalition forces bombed Baghdad in January 1991, oil prices fell back to pre-war levels, and the stock market rebounded in sync. During the war, the Dow and crude oil prices moved almost perfectly inversely—the market was trading the trade-off between inflation and growth.

The 2001 Afghanistan War and the 2003 Iraq War further validated this pattern. The most symbolic moment was perhaps the killing of Osama bin Laden in May 2011—arguably the most breakthrough moment in the Afghanistan War. The next day, the Dow fell a mere 0.02%, and the S&P 500 declined 0.18%. The market almost completely ignored the news.

In summary, the reaction of U.S. stocks to war has undergone a clear evolution path: shifting from 'sentiment dominance' to 'economic transmission.' Early wars directly shook the market through news of victories and defeats, but since the Korean War, the stock market has increasingly focused on real economic variables like fiscal expansion, inflation expectations, oil price volatility, and monetary policy.

War itself is no longer the reason for rises or falls; how war affects growth and costs is what the market truly prices.

Which Industry Profits from War? The Answer is Changing

During WWII, coal was the lifeblood of war. Bituminous coal's share rose from 43.8% pre-war to 48.9%, and the industry cumulatively rose 415%.

During the Korean War, oil took over as the new protagonist. Crude oil extraction and refining took the top two spots for gains, with profits climbing continuously from mid-1950 to the first half of 1952. During the Vietnam War, the collapse of the Bretton Woods system forced the U.S. dollar to depreciate, and OPEC was allowed to raise prices to compensate for losses. The oil extraction industry exploded during the dollar crisis from late 1970 to early 1973, surging a staggering 1378% throughout the war.

The Kosovo War continued this pattern, with raw materials and energy industries performing best.

The Gulf War is the only exception—the transmission path shifted to the indirect mode of 'oil price → economic expectations,' making consumer staples and health industries advantageous in the short term, while energy, raw materials, industrials, and other heavy-asset sectors performed the worst.

A notable trend is: As the U.S. economy's size has expanded, the defense industry has transformed from a growth engine into a fundamental part of the economy. The marginal contribution of any single war to the overall economy has been declining, and the driving force for the stock market has increasingly shifted to macroeconomic variables like inflation, interest rates, and fiscal deficits.


Preguntas relacionadas

QAccording to the article, how has the relationship between war and the U.S. stock market evolved over time?

AThe relationship has evolved from one where war directly impacted the market through sentiment (e.g., WWII and earlier), to one where its influence is transmitted indirectly through economic channels like inflation, oil prices, and fiscal deficits (e.g., from the Korean War onwards). The market now prices how war affects growth and costs, not the war events themselves.

QWhat was the turning point in U.S. war strategy according to the analysis, and what were its key features?

AThe Vietnam War was the turning point. It was the only war the U.S. lost and gained no benefit from. Post-Vietnam, U.S. strategy shifted to conflicts characterized by being short in duration, small in scale, and centered around oil resources, often fought through proxies or with air power dominance.

QWhich sector benefited the most during World War II, and how did the leading sector change in subsequent major conflicts?

ADuring World War II, the coal industry benefited the most, with its share of production rising significantly. In subsequent conflicts, the leading sector shifted: petroleum took the lead during the Korean and Vietnam Wars. However, the Gulf War was an exception, where consumer staples and healthcare performed better due to the indirect economic transmission via oil prices.

QHow did the U.S. stock market react to key battlefield victories in early wars versus significant events in modern wars, such as the killing of Osama bin Laden?

AIn early wars like the Spanish-American War, key battlefield victories (e.g., Manila Bay) caused immediate and significant stock market rallies (~10% in 10 days). In contrast, modern wars show a muted direct reaction. For example, the killing of Osama bin Laden in 2011 resulted in only minor daily movements in major indices, indicating the market had become largely indifferent to such event-driven war news.

QWhat role did World War I and World War II play in America's rise to global economic dominance, according to the article?

AWorld War I allowed the initially neutral U.S. to profit massively by producing and exporting arms and supplies to European allies, with banks providing huge loans. World War II was the key conflict that cemented America's global霸主 (hegemony) status. Although initial war taxes suppressed corporate profits, the market rebounded strongly after pivotal battles turned the tide, and the war effort ultimately solidified the U.S. as the world's leading economic and military power.

Lecturas Relacionadas

¿Dónde está el anclaje de valoración de MegaETH tras la salida de Aave y la fuerte volatilidad de su TVL?

Según datos de DefiLlama, MegaETH experimentó una fuerte volatilidad en su TVL entre el 9 y el 10 de julio, cayendo brevemente a poco más de 30 millones de dólares, lo que supone una caída del 60% en 24 horas y un descenso del 70% respecto al pico de mayo. El principal protocolo en cadena, Aave V3, retiró alrededor del 80% de su liquidez en un día. El precio del token MEGA cayó a unos 0,048 dólares, con una capitalización de mercado de unos 54 millones de dólares y un FDV de aproximadamente 4.800 millones. MegaETH, una vez una de las nuevas blockchains más esperadas, contó con una fuerte afluencia de capital inicial respaldado por importantes fondos de capital de riesgo y entusiasmo de KOLs. En su punto máximo, su FDV alcanzó los 20.000 millones de dólares y su TVL de DeFi llegó a 245 millones, posicionándose entre las 11 principales blockchains. Sin embargo, su TVL dependía en gran medida de Aave y de estrategias de apalancamiento con stablecoins como USDe. Cuando el rendimiento de USDe cayó por debajo del coste de préstamo en Aave, estas posiciones se desmontaron, provocando una salida masiva de capital. Actualmente, el valor de MegaETH parece desalineado con su actividad real. Con un FDV de 4.700 millones de dólares, los protocolos de la cadena generan menos de 90.000 dólares de ingresos reales en 30 días y tienen solo 2.619 direcciones activas diarias. Además, gran parte de los ingresos provienen de una aplicación de juego de cartas, Monster, y no de protocolos DeFi. Su stablecoin nativa, USDM, también está perdiendo valor. La comunidad critica la falta de comunicación del equipo y la migración de proyectos a otras cadenas. El caso de MegaETH refleja una tendencia más amplia en la que el mercado está dejando de premiar los altos TVL impulsados por incentivos o arbitraje, exigiendo en su lugar fundamentos sólidos, ingresos reales y un ecosistema saludable para respaldar la valoración. A menos que el equipo pueda convertir el capital recaudado en adopción y utilidad real, es difícil ver un pilar sólido para su valoración más allá de posibles rebotes temporales por sentimiento del mercado.

链捕手Hace 3 hora(s)

¿Dónde está el anclaje de valoración de MegaETH tras la salida de Aave y la fuerte volatilidad de su TVL?

链捕手Hace 3 hora(s)

Informe en profundidad de Goldman Sachs: ¿Quiénes serán los ganadores a largo plazo en la industria china de modelos de IA a gran escala?

Informe de Goldman Sachs sobre los posibles ganadores a largo plazo en la industria china de modelos de IA. Los modelos de inteligencia artificial de China se encuentran en un punto de inflexión histórico. Según Goldman Sachs, los modelos de código abierto han alcanzado un rendimiento cercano al de los modelos propietarios globales líderes. Esta evolución ha pasado del enfoque en la eficiencia de costos de DeepSeek el año pasado al momento de la inteligencia del modelo de GLM de Zhipu este año. La adopción por parte de empresas chinas y pymes globales se está expandiendo rápidamente, creando un efecto de vuelo de datos que impulsará nuevas iteraciones. La clave del éxito radica en la innovación arquitectónica y la eficiencia de parámetros, lo que permite a los modelos chinos lograr un rendimiento comparable a un costo significativamente menor. Se está formando una estructura de mercado de dos niveles: un segmento premium (ej. GLM5.2 de Zhipu) y un segmento de bajo costo para tareas de agentes inteligentes y usuarios sensibles al precio. Se proyecta que los ingresos por API y suscripciones de modelos chinos crecerán drásticamente, de 35 mil millones de RMB en 2026 a 879 mil millones en 2030. La estrategia predominante es el código abierto o de pesos abiertos, que favorece la adopción, aunque presenta desafíos para la monetización. La industria podría migrar hacia un modelo de "pesos abiertos + licencia comunitaria" con acuerdos de reparto de ingresos. La expansión internacional, especialmente en mercados no estadounidenses, representa la mayor oportunidad de crecimiento, aprovechando la ventaja de costo-rendimiento. Goldman Sachs identifica a los posibles ganadores utilizando un marco tridimensional que evalúa la capacidad de fijación de precios, la ventaja de costos y la solidez financiera. En modelos de texto básico, Zhipu AI y DeepSeek tienen la posición más sólida. En el ámbito multimodal/generación de video, ByteDance lidera con su modelo Seed. La firma mantiene su calificación de compra para MiniMax, citando su atractiva valoración.

marsbitHace 3 hora(s)

Informe en profundidad de Goldman Sachs: ¿Quiénes serán los ganadores a largo plazo en la industria china de modelos de IA a gran escala?

marsbitHace 3 hora(s)

Informe Profundo de Goldman Sachs: ¿Quién será el ganador a largo plazo en la industria china de modelos de IA grandes?

China se encuentra en un punto de inflexión histórico en cuanto a modelos de IA a gran escala. Según Goldman Sachs, los modelos chinos de código abierto/ponderaciones abiertas han alcanzado un rendimiento cercano al de los mejores modelos propietarios globales, con una rápida adopción por empresas chinas y pymes mundiales, creando un efecto de círculo virtuoso de datos para futuras mejoras. El informe destaca la ventaja de coste-eficiencia de los modelos chinos, lograda mediante innovaciones arquitectónicas (como MoE) que permiten alto rendimiento con menos parámetros activos (3-5%). Modelos como DeepSeek V4 Pro (1,6 billones de parámetros) y GLM5.2 de Zhipu (0,7 billones) son ejemplos clave. El LongCat 2.0 de Meituan, entrenado con chips nacionales, marca un hito en la autosuficiencia. El mercado se está estructurando en dos niveles: modelos premium (como GLM5.2, ~1$/millón de tokens) y modelos económicos para agentes de IA (~0.06-0.2$/millón). Se proyecta que los ingresos por API/suscripción crezcan desde 35.000 millones de RMB en 2026 hasta 879.000 millones en 2030. La estrategia predominante es el código abierto o ponderaciones abiertas (salvo ByteDance), lo que fomenta la adopción pero limita la monetización directa. Se espera una transición hacia licencias comunitarias con acuerdos de reparto de ingresos para mejorar la rentabilidad. La expansión internacional, especialmente en mercados no estadounidenses, es clave. El enfoque empresarial global está cambiando de maximizar tokens a priorizar el ROI. Plataformas como AWS Bedrock y Gemini ya ofrecen modelos chinos. Para identificar a los ganadores a largo plazo, Goldman Sachs aplica un marco basado en capacidad de fijación de precios, ventaja en costes y solidez financiera. En modelos de texto, Zhipu y DeepSeek tienen la posición más fuerte. En multimodal/generación de video, ByteDance lidera con Seed, seguido por Kuaishou y MiniMax. Se mantiene una calificación de compra para MiniMax y Kuaishou.

链捕手Hace 3 hora(s)

Informe Profundo de Goldman Sachs: ¿Quién será el ganador a largo plazo en la industria china de modelos de IA grandes?

链捕手Hace 3 hora(s)

Trading

Spot
活动图片