Global Asset Rotation: Why Does Liquidity Drive the Cryptocurrency Cycle? (Part 1)

marsbitPublicado a 2025-12-26Actualizado a 2025-12-26

Resumen

This article introduces a new series on global asset allocation and rotation, arguing that liquidity—not new narratives—is the primary driver of cryptocurrency market cycles. While narratives like RWA or X-402 can attract attention, they are triggers, not fundamental drivers. The real force is capital flow: ample liquidity amplifies even weak narratives, while liquidity contraction undermains the most compelling ones. The framework begins by mapping global assets not by traditional labels (stocks, bonds, commodities) but by their roles and dependencies within economic and liquidity cycles. Cryptocurrency is reclassified not as a traditional risk asset (like equities, which have cash flows and valuation models) but as a non-cash-flow alternative asset. Its price action is driven primarily by capital inflows and outflows, making it highly sensitive to liquidity and risk appetite. Five key macro indicators are identified as core drivers: interest rates (especially real rates), inflation metrics (CPI, PCE), economic growth indicators (PMI, GDP), systemic liquidity (central bank balance sheets, money supply), and risk appetite (volatility indices, credit spreads). A causal chain is proposed: inflation influences interest rates, which affect liquidity, which then drives risk preference and ultimately asset prices. The U.S. remains the anchor for global capital flows, and understanding its monetary policy cycle is crucial. During loose monetary conditions, risk assets like crypto...

This article marks the beginning of a new series of research on global asset allocation and rotation. After delving deeply into this topic, we discovered one of the most unexpected yet crucial facts: what ultimately determines a cryptocurrency bull market is not the emergence of new narratives.

Whether it's RWA, X402, or any other concept, these themes are often triggers, not the true driving forces. They can attract attention but do not, in themselves, provide energy. The real power comes from capital. When liquidity is abundant, even weak arguments can be amplified into market consensus. And when liquidity dries up, the most powerful arguments struggle to maintain their momentum.

This first part focuses on building the foundation: how to construct a global asset allocation and rotation framework that places cryptocurrency in the proper macro context. The latter part of the framework will be explained in subsequent articles.

Step 1: Step Outside Crypto, Map Global Assets

The first step is to deliberately step outside the cryptocurrency market and construct a panoramic view of global assets. Traditional classifications—stocks, bonds, commodities—are useful but insufficient for understanding capital rotation across different cycles.

Instead, we can classify assets based on the roles they play during different phases of the economic and liquidity cycles. What matters is not whether an asset is labeled "equity" or "commodity," but rather what it depends on and what it is vulnerable to. Some assets benefit from falling real rates, some from inflation uncertainty, and others from outright risk aversion.

Building an "asset spectrum map" does not require deep expertise in every market. What it truly requires is an intuitive understanding of the interdependencies of each asset: which conditions support it and which conditions weaken it. This mental map will become the reference system for all subsequent decisions.

Within this framework, cryptocurrency deserves special treatment.
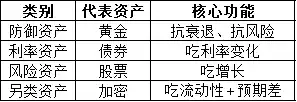
Why Crypto is an Alternative Asset, Not a Traditional Risk Asset?

Cryptocurrencies are often grouped with stocks (especially U.S. tech stocks) because their price movements are highly correlated. Superficially, this classification seems reasonable. Cryptocurrencies exhibit extreme volatility, high beta, and significant drawdowns—all characteristics similar to risk assets.

However, correlation itself does not define economic essence.

From a capital structure perspective, stocks have cash flows. Companies generate earnings, distribute dividends, and can be valued using discounted cash flow models or valuation multiples. Even when prices deviate from fundamentals, the anchoring logic is still based on cash flows.

Crypto assets operate on a fundamentally different logic. They do not generate dividends, nor do they have intrinsic cash flow that can be discounted. Therefore, traditional valuation frameworks simply do not apply.

Instead, cryptocurrencies behave like a purely liquidity-sensitive asset. Their price movements are primarily driven by capital inflows and outflows, rather than changes in fundamental productivity. Narratives help explain *why* capital flows, but they do not determine *that* it flows. Capital flows regardless.

Thus, cryptocurrency is best understood as a non-cash-flow alternative asset, positioned at the extreme end of the risk appetite spectrum. It performs best when liquidity is abundant and risk appetite is high; it underperforms when capital prioritizes safety and yield.

Liquidity is the Core Driver of Crypto Performance

Once you view cryptocurrency as a liquidity asset rather than a valuation asset, its behavior across cycles becomes easier to explain.

In equity research, price targets often stem from a structured process: forecasting future revenue, applying valuation multiples, and discounting the result to present value. This works because the asset itself generates measurable economic output.

Cryptocurrency lacks this anchoring effect. Its upside depends on whether new capital is willing to enter the market and accept higher prices. And this capital almost always comes from outside the crypto ecosystem—from stocks, credit, or cash sitting idle due to low yields.

Therefore, understanding the source and timing of liquidity is more important than tracking individual protocols or events. When capital begins seeking higher volatility and convexity, cryptocurrency becomes one of the most attractive destinations. And when capital prioritizes capital preservation, crypto is often the first asset to be sold.

In short, liquidity is the decisive factor; everything else is secondary.

Step 2: Focus on Macro Drivers First, Asset Details Second

The second pillar of this framework is macro analysis. It is more efficient to first identify the variables influencing price movements rather than starting with the study of specific assets. All assets are integrated together.

At the highest level, five macro indicators play a central role:

  • Interest rates, especially the distinction between nominal and real rates.

  • Inflation indicators, such as the Consumer Price Index (CPI) and Personal Consumption Expenditures (PCE).

  • Economic growth indicators, such as Purchasing Managers' Index (PMI) and Gross Domestic Product (GDP) trends.

  • Systemic liquidity, often reflected in central bank balance sheets and money supply measures.

  • Risk appetite, typically measured by volatility indices and credit spreads.

Many crypto participants closely watch Federal Reserve meetings but often focus solely on the rate decision. However, institutional capital places greater importance on real rates (nominal rates adjusted for inflation) because real rates determine the true opportunity cost of holding a non-yielding asset.

Inflation data is widely discussed in crypto circles, but liquidity and risk appetite receive little attention. This is a blind spot. Monetary supply dynamics and volatility regimes often explain overall market behavior before narratives even emerge.

A useful mental model is a simple chain of transmission:

  1. Inflationary pressures influence interest rates.
  2. Interest rates influence liquidity conditions.
  3. Liquidity conditions influence risk appetite.
  4. Risk appetite drives asset prices.

Understanding where the economy is positioned in this chain provides deeper insight than analyzing assets in isolation.

Step 3: Build a Cycle-Based Mental Model

The economic cycle is a familiar concept, but it remains crucial. At a macro level, economic cycles tend to alternate between expansion and contraction, easing and tightening.

Simply put, the pattern often looks like this:

Periods of monetary easing favor risk assets, including cryptocurrencies and small-cap stocks.

Periods of monetary tightening favor defensive assets like cash, government bonds, and gold.

This framework is not meant to be applied mechanically. Each asset's reaction will vary based on timing, expectations, and positioning. Nonetheless, a cycle-based reference helps avoid emotional decision-making during shifts in the market landscape.

An important nuance is that the global economic cycle is not synchronized. The world does not operate as a single economy.

As growth momentum slows, the U.S. might be transitioning from late-cycle high rates towards easing. Japan might be cautiously ending decades of ultra-loose monetary policy. China continues its structural adjustments in a low-inflation environment, while parts of Europe still grapple with economic stagnation.

Despite this divergence, the United States remains the anchor for global capital flows. Dollar liquidity and U.S. interest rates still exert the strongest influence on global capital movements. Therefore, any global asset rotation framework should start with the U.S. and expand outward.

Conclusion: Framework Before Forecast

This first half of the framework emphasizes structure over prediction. The goal is not to forecast short-term price movements but to understand the factors that make certain assets competitive at specific points in time.

By redefining crypto as a liquidity-driven alternative asset, focusing on macro drivers before narratives, and basing decisions on cycle awareness, investors can avoid many common analytical pitfalls.

The next article will build upon this, delving into the sequence of capital flows, real-world indicators, and how to identify when liquidity is shifting towards high-risk assets.

Some of the above viewpoints are referenced from @Web3___Ace

Original article link

Criptos en tendencia

Preguntas relacionadas

QWhat is the primary driver of cryptocurrency bull markets according to the article?

ALiquidity, not new narratives, is the primary driver of cryptocurrency bull markets. Capital flows are the true source of energy, while narratives are merely triggers that can amplify market consensus when liquidity is abundant.

QHow does the article suggest classifying assets for a global asset allocation framework?

AThe article suggests classifying assets based on the roles they play in different phases of the economic and liquidity cycle, focusing on what conditions support or weaken them, rather than traditional labels like 'equities' or 'commodities'.

QWhy is cryptocurrency considered an alternative asset rather than a traditional risk asset in the framework?

ACryptocurrency is considered a non-cash-flow alternative asset because it lacks intrinsic cash flows (like dividends) and cannot be valued using traditional discounted cash flow models. Its price is primarily driven by capital inflows and outflows, making it a pure liquidity-sensitive asset at the extreme end of the risk preference spectrum.

QWhat are the five core macro indicators that the article identifies as crucial for understanding price movements?

AThe five core macro indicators are: 1) Interest rates, particularly the distinction between nominal and real rates; 2) Inflation indicators like CPI and PCE; 3) Economic growth indicators like PMI and GDP trends; 4) Systemic liquidity, reflected in central bank balance sheets and money supply; 5) Risk appetite, measured by volatility indices and credit spreads.

QWhat is the simple transmission chain model described in the article for understanding how macro factors drive asset prices?

AThe simple transmission chain model is: 1) Inflationary pressures influence interest rates; 2) Interest rates influence liquidity conditions; 3) Liquidity conditions influence risk appetite; 4) Risk appetite drives asset prices.

Lecturas Relacionadas

Primer informe financiero tras la gran desvinculación del STRC, ¿cómo restaurará Strategy su rueda de capital?

STRC Superó Su Primera Prueba de Presión: Strategy Informa Pérdidas por BTC, pero Reajusta su Estrategia de Capital El 31 de julio, Strategy, la compañía de tesorería de Bitcoin, publicó sus resultados del segundo trimestre de 2026. A pesar de un aumento del 6.9% en los ingresos totales a $122 millones, la empresa registró una pérdida neta de $8.22 mil millones, impulsada principalmente por $8.32 mil millones en pérdidas no realizadas por la caída del precio de Bitcoin. Su tenencia de BTC creció un 11%, llegando a 843,775 BTC con un costo promedio de $75,000. La atención del mercado se centra en si Strategy puede restaurar su "volante de capital" tras la desvinculación de su principal instrumento de financiación, STRC, que cotiza con un descuento (aproximadamente $89.5). El informe muestra un cambio fundamental: de la compra fija de BTC a una gestión de capital activa y bidireccional. Esta nueva estrategia, el "Marco de Capital de Crédito Digital", conecta sus reservas de BTC, efectivo en USD, acciones ordinarias (MSTR) y valores digitales (STRC). Incluye un programa de monetización, a través del cual ya vendió $218.4 millones en BTC, y planes de recompra de hasta $1 mil millones para STRC (ya recompraron $28.9 millones). La prioridad absoluta es llevar STRC de vuelta a su valor nominal de $100, con el 8 de septiembre como referencia clave. El CEO Phong Le subrayó que la empresa mantendrá el dividendo anual de STRC en el 12%, confiando en el fortalecimiento de su colchón de efectivo ($3.75 mil millones, suficiente para más de 2.1 años de obligaciones) para restaurar la confianza. El futuro de Strategy depende de superar dos pruebas: la reinserción exitosa de STRC a corto plazo y la recuperación del precio de Bitcoin a largo plazo.

marsbitHace 55 min(s)

Primer informe financiero tras la gran desvinculación del STRC, ¿cómo restaurará Strategy su rueda de capital?

marsbitHace 55 min(s)

STRC pierde su ancla: primera presentación de resultados tras la crisis, ¿cómo repara Strategy su volante de capital?

STRC, la principal herramienta de financiación de la empresa tesorera de bitcoin Strategy, sufrió una significativa pérdida de su paridad (anclaje) a partir de mayo, cayendo desde su valor nominal objetivo de 100 dólares a mínimos cercanos a 75 dólares. En este contexto, Strategy publicó su informe financiero del segundo trimestre de 2026. Aunque la compañía reportó una pérdida neta de 8.22 mil millones de dólares, principalmente por pérdidas no realizadas en sus activos digitales debido a la volatilidad del precio de BTC, mantuvo su estrategia central: sus reservas de bitcoin aumentaron un 11% hasta las 843,775 BTC. Sin embargo, el modelo de capital ha cambiado radicalmente. Strategy ha transitado de un ciclo de "financiación y compra" fijo a una gestión de capital activa y bidireccional. Como parte de su nuevo "Marco de Capital de Crédito Digital", ha comenzado a vender BTC (unos 218.4 millones de dólares hasta ahora) para reforzar su liquidez en efectivo, que ya asciende a 3.75 mil millones. El objetivo principal actual es reparar la confianza y devolver el STRC a su paridad. La dirección se ha comprometido a no emitir nuevas acciones preferentes (STRC) con descuento. En su lugar, utilizará su amplia reserva de efectivo para cubrir dividendos y está ejecutando un programa de recompra de hasta 1 mil millones de dólares en valores de crédito digital, priorizando el STRC. La compañía se ha fijado el 8 de septiembre como fecha de referencia para lograr este reanclaje. En resumen, Strategy busca demostrar que es una empresa operativa capaz de gestionar activamente su balance, utilizando sus reservas de BTC, efectivo en dólares, acciones ordinarias (MSTR) y valores de crédito digital (STRC) de forma dinámica para optimizar su estructura financiera. El éxito final de este nuevo modelo depende a corto plazo de la recuperación de la paridad del STRC y, a largo plazo, de un repunte sostenido del precio de Bitcoin.

Odaily星球日报Hace 1 hora(s)

STRC pierde su ancla: primera presentación de resultados tras la crisis, ¿cómo repara Strategy su volante de capital?

Odaily星球日报Hace 1 hora(s)

AWS representa el 60% de los ingresos totales, Amazon presenta un Q2 sin puntos débiles

Amazon anunció los resultados de su segundo trimestre, con ventas totales de 200,600 millones de dólares. La cifra neta más llamativa fue un beneficio neto de 62,600 millones, impulsado en gran parte por una ganancia no operativa de 53,400 millones procedente de la revalorización de su inversión en Anthropic. Centrándose en el desempeño operativo, el beneficio operativo fue de 27,500 millones. AWS, el negocio de computación en la nube, fue el principal motor, representando el 60.5% de este beneficio operativo. Sus ingresos crecieron un 36.8% interanual, y su beneficio operativo aumentó casi dos tercios. Otras divisiones también mostraron un crecimiento sólido. La publicidad creció un 26.2%, y tanto los servicios para vendedores externos como las tiendas en línea aceleraron su ritmo. Sin embargo, el fuerte flujo de caja operativo generado se ve contrarrestado por importantes inversiones de capital. En los últimos 12 meses, la compra neta de propiedades y equipos (1,690 mil millones) superó al flujo de caja operativo (1,614 mil millones), lo que llevó al flujo de caja libre a territorio negativo. La empresa atribuye este gasto principalmente a inversiones en infraestructura para IA y centros de datos. En resumen, el trimestre mostró un desempeño operativo robusto y sin puntos débiles evidentes, liderado por la aceleración de AWS y el crecimiento de la publicidad y el comercio minorista, mientras la empresa continúa reinvirtiendo agresivamente en su futuro.

marsbitHace 1 hora(s)

AWS representa el 60% de los ingresos totales, Amazon presenta un Q2 sin puntos débiles

marsbitHace 1 hora(s)

Dos trimestres consecutivos en pérdidas, Coinbase necesita depender de algo más que la negociación

La plataforma estadounidense de intercambio de criptomonedas Coinbase registró una pérdida neta de 359 millones de dólares en el segundo trimestre, el segundo trimestre consecutivo en números rojos. Aunque los ingresos totales cayeron a 1220 millones de dólares, su cuota de mercado en volumen de comercio de criptomonedas alcanzó un récord del 10,3%, según la compañía. El informe muestra que Coinbase está diversificando sus fuentes de ingresos más allá de las comisiones por transacciones al contado, que cayeron a 599 millones de dólares. Los ingresos por suscripciones y servicios, en 555 millones, casi los igualan, destacando los 292 millones provenientes de actividades relacionadas con la stablecoin USDC. Más del 30% de la oferta circulante de USDC se encuentra ahora en los productos de Coinbase. Mientras el volumen de operaciones al contado cayó un 24% hasta 1,46 billones de dólares, el volumen de derivados se mantuvo estable en 10,3 billones, reflejando la demanda continua de instrumentos para cobertura y apalancamiento en un mercado con baja volatilidad. A pesar de la pérdida neta GAAP, el EBITDA ajustado fue positivo en 208 millones de dólares por decimocuarto trimestre consecutivo. La diferencia se debe principalmente a partidas no operativas como cambios en el valor razonable de activos. La compañía también ha reducido gastos, ajustando su guía anual a entre 4200 y 4450 millones. La pregunta clave que deja el informe es si estas nuevas fuentes de ingresos, como las stablecoins y los derivados, pueden sostener a la plataforma de manera más estable a través de los ciclos de mercado, reduciendo su dependencia exclusiva de la actividad transaccional especulativa.

marsbitHace 1 hora(s)

Dos trimestres consecutivos en pérdidas, Coinbase necesita depender de algo más que la negociación

marsbitHace 1 hora(s)

Trading

Spot

Artículos destacados

Cómo comprar O

¡Bienvenido a HTX.com! Hemos hecho que comprar O1 exchange (O) sea simple y conveniente. Sigue nuestra guía paso a paso para iniciar tu viaje de criptos.Paso 1: crea tu cuenta HTXUtiliza tu correo electrónico o número de teléfono para registrarte y obtener una cuenta gratuita en HTX. Experimenta un proceso de registro sin complicaciones y desbloquea todas las funciones.Obtener mi cuentaPaso 2: ve a Comprar cripto y elige tu método de pagoTarjeta de crédito/débito: usa tu Visa o Mastercard para comprar O1 exchange (O) al instante.Saldo: utiliza fondos del saldo de tu cuenta HTX para tradear sin problemas.Terceros: hemos agregado métodos de pago populares como Google Pay y Apple Pay para mejorar la comodidad.P2P: tradear directamente con otros usuarios en HTX.Over-the-Counter (OTC): ofrecemos servicios personalizados y tipos de cambio competitivos para los traders.Paso 3: guarda tu O1 exchange (O)Después de comprar tu O1 exchange (O), guárdalo en tu cuenta HTX. Alternativamente, puedes enviarlo a otro lugar mediante transferencia blockchain o utilizarlo para tradear otras criptomonedas.Paso 4: tradear O1 exchange (O)Tradear fácilmente con O1 exchange (O) en HTX's mercado spot. Simplemente accede a tu cuenta, selecciona tu par de trading, ejecuta tus trades y monitorea en tiempo real. Ofrecemos una experiencia fácil de usar tanto para principiantes como para traders experimentados.

413 Vistas totalesPublicado en 2026.06.19Actualizado en 2026.06.29

Cómo comprar O

Cómo comprar PROS

¡Bienvenido a HTX.com! Hemos hecho que comprar Pharos (PROS) sea simple y conveniente. Sigue nuestra guía paso a paso para iniciar tu viaje de criptos.Paso 1: crea tu cuenta HTXUtiliza tu correo electrónico o número de teléfono para registrarte y obtener una cuenta gratuita en HTX. Experimenta un proceso de registro sin complicaciones y desbloquea todas las funciones.Obtener mi cuentaPaso 2: ve a Comprar cripto y elige tu método de pagoTarjeta de crédito/débito: usa tu Visa o Mastercard para comprar Pharos (PROS) al instante.Saldo: utiliza fondos del saldo de tu cuenta HTX para tradear sin problemas.Terceros: hemos agregado métodos de pago populares como Google Pay y Apple Pay para mejorar la comodidad.P2P: tradear directamente con otros usuarios en HTX.Over-the-Counter (OTC): ofrecemos servicios personalizados y tipos de cambio competitivos para los traders.Paso 3: guarda tu Pharos (PROS)Después de comprar tu Pharos (PROS), guárdalo en tu cuenta HTX. Alternativamente, puedes enviarlo a otro lugar mediante transferencia blockchain o utilizarlo para tradear otras criptomonedas.Paso 4: tradear Pharos (PROS)Tradear fácilmente con Pharos (PROS) en HTX's mercado spot. Simplemente accede a tu cuenta, selecciona tu par de trading, ejecuta tus trades y monitorea en tiempo real. Ofrecemos una experiencia fácil de usar tanto para principiantes como para traders experimentados.

415 Vistas totalesPublicado en 2026.06.22Actualizado en 2026.06.29

Cómo comprar PROS

Qué es VERONA

I. Introducción al Proyecto VERONA es una blockchain construida para todos, en cualquier lugar, a través de la abstracción de la cadena. Utilizando su capa de Abstracción Generalizada, VERONA se distingue por integrar funcionalidades complejas de blockchain, como cuentas, firmas e interoperabilidad, directamente a nivel de protocolo. Este enfoque permite interactuar con aplicaciones de blockchain sin necesidad de entender las tecnologías subyacentes.1) Información Básica Nombre: VERONA (VERONA)III. Enlaces Relacionados Enlace al sitio web oficial: https://xion.burnt.com/ Libro Blanco: https://xion.burnt.com/whitepaper.pdf Exploradores: https://explorer.burnt.com/ Redes Sociales: https://x.com/burnt_xion Nota: La introducción del proyecto proviene de los materiales publicados o proporcionados por el equipo oficial del proyecto, que es solo para referencia y no constituye asesoramiento de inversión. HTX no se hace responsable de ninguna pérdida directa o indirecta resultante.

436 Vistas totalesPublicado en 2026.06.22Actualizado en 2026.06.22

Qué es VERONA

Discusiones

Bienvenido a la comunidad de HTX. Aquí puedes mantenerte informado sobre los últimos desarrollos de la plataforma y acceder a análisis profesionales del mercado. A continuación se presentan las opiniones de los usuarios sobre el precio de A (A).

活动图片