I. Product Architecture and Evolutionary Logic of the Tokenized Equity Market
The true paradigm shift of the tokenized equity market occurred between 2023 and 2025, with the maturation of three key variables driving the qualitative transformation. First, on-chain perpetual contract mechanisms matured—GMX's GLP pool model, dYdX v4's order book architecture, and Hyperliquid's dedicated L1 engine built on Arbitrum Stylus compressed on-chain derivatives latency to the millisecond level, while built-in oracles and liquidation engines enabled round-the-clock uninterrupted trading capabilities that traditional centralized exchanges cannot offer. Second, oracle infrastructure underwent a leap forward—Chainlink Data Streams and Pyth Network enabled Asian equity prices to be brought on-chain with sub-second latency, resolving the long-standing price source reliability issue that had constrained tokenized financial products. Third, the regulatory framework began to take shape—the SEC released positive signals from late 2025 to early 2026, preparing to launch an "Innovation Exemption" to provide a regulatory sandbox path for compliant tokenized products; on June 8, 2026, Coinbase officially launched four CFTC-regulated equity index perpetual contracts (AI10, China10, Defense10, Tech100), marking the formal entry of regulated entities into this segment.
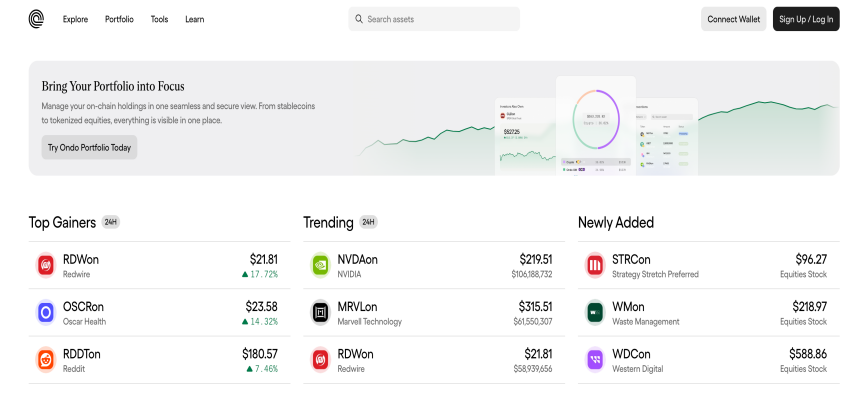
From a product structure perspective, the current market consists of two distinct yet complementary product types. The first category is fully collateralized spot tokenization, represented by Ondo Finance, xStocks, and Backed. Ondo Finance holds an absolute leading position with a TVL of $887.8 million, accounting for 60.87% of the entire market and covering 231 stocks; xStocks ranks second with a TVL of $394.2 million and a 27.03% share. The core value of these products lies in cross-border investment accessibility and settlement efficiency—investors can hold global equities without opening local brokerage accounts, and on-chain settlement shortens T+2 to T+0.
The second category is perpetual contracts, represented by Hyperliquid, Binance, and dYdX. These products do not hold actual stocks; they merely use stablecoins as margin to replicate exposure to the underlying asset price. Their greatest advantages lie in 24/7 round-the-clock trading, leverage of up to 20x, and rapid listing capabilities enabled by the absence of underlying asset custody requirements. A typical example is that after the Hyperliquid community passed the HIP-3 proposal in October 2025, perpetual contracts on Korean blue-chip stocks such as Samsung Electronics and SK Hynix were successively launched, triggering a wave of "tokenized equity contracts going on-chain" centered on Asian markets, with Binance quickly following suit to list similar instruments.
II. Market Structure Reconstruction and Competitive Landscape Driven by Perpetual Contracts
The 2026 competitive landscape of tokenized equity perpetual contracts presents a clear three-tier structure: an on-chain protocol-dominated layer, a centralized exchange catch-up layer, and a gradual institutional entry layer. Hyperliquid, leveraging the ultra-low latency and zero gas fee advantages of its dedicated L1 chain, occupies approximately 50% of the perpetual contract market trading volume share. Its core strategy can be summarized as "geographic arbitrage"—prioritizing coverage of high-liquidity Asian markets such as South Korea and Japan, leveraging the periods when local exchanges are closed to establish liquidity barriers, thereby attracting global-session speculators and hedgers. Binance, as the world's largest crypto trading platform, accelerated the expansion of its tokenized equity perpetual contract product line in late 2025 and has formed a duopoly with Hyperliquid. The average price difference for the same instrument between the two ranges from 0.93% to 1.03%, with a maximum of up to 2.3% under extreme market conditions, which both reflects the insufficient competition among market makers and constitutes natural fertile ground for arbitrage trading.
Coinbase, leveraging its CFTC regulatory license, takes a "compliant alternative" approach, providing U.S. institutional investors with the first regulated entry to on-chain equity derivatives. The four index perpetual contracts (AI10, China10, Defense10, Tech100) launched in June 2026 adopt a centralized clearing model, with each transaction subject to KYC verification and anti-money laundering review, which contrasts sharply with Hyperliquid's decentralized permissionless model. dYdX v4 builds an independent application chain based on the Cosmos SDK, focusing on institutional-grade order books and cross-chain interoperability; GMX's GLP model provides a more flexible listing and liquidity provision mechanism for smaller-cap instruments. From the evolution of competitive focus, the market is shifting from the early "who lists first" to "who prices most accurately"—oracle latency, market maker depth, and liquidation mechanisms have become the three pillars determining platform competitiveness. Empirical research shows that the correlation coefficient between perpetual contract prices and the next-day opening price of the underlying stock reaches as high as 0.85 to 0.89, with regression coefficients of 0.93 and 1.00 respectively, meaning that tokenized equity perpetual contracts are no longer merely passive price-tracking tools but are becoming an information aggregation and price discovery mechanism that operates independently of traditional exchanges.
III. Empirical On-Chain Validation: The Triple Value Creation Mechanism of Perpetual Contracts
The widespread attention garnered by tokenized stock perpetual futures is fundamentally driven by their ability to create the triple unique value that traditional equity markets cannot offer. The first value is the overnight price discovery function. Through systematic research on Samsung Electronics and SK Hynix perpetual contracts, it was found that the after-hours movements of both instruments systematically lead the next day's opening prices. Specifically, if the Samsung Electronics perpetual contract shows an upward trend after the KOSPI close, the probability of the next day opening higher is approximately 82%; conversely, a decline indicates a 96% probability of opening lower. For SK Hynix, the results are equally striking, with a rise indicating a 95% probability of opening higher the next day, and a decline indicating a 78% probability of opening lower. More critically, regression coefficient analysis shows values of 0.93 and 1.00 respectively, indicating that overnight perpetual contracts can not only predict the direction of the next day's open but also accurately predict the magnitude of the opening gap. This information aggregation capability stems from the 24/7 continuous operation of on-chain markets—macro news, corporate announcements, and industry developments from around the world can be reflected in perpetual contract prices in real time, without having to wait for the next trading day's opening auction.
The second value is the Delta-neutral arbitrage mechanism driven by funding rates. The funding rate design of perpetual contracts naturally transfers benefits between long and short positions—when market sentiment is bullish, longs pay funding to shorts, and vice versa. Data shows that the Samsung Electronics perpetual contract generates an average intraday positive premium of about 0.15%, and SK Hynix about 0.23%. Theoretically, constructing a Delta-neutral strategy by buying fully collateralized spot tokens while shorting an equivalent amount of perpetual contract positions can completely eliminate directional exposure and achieve annualized theoretical returns of 66.7% to 119.7% solely through funding rates. Of course, factors such as slippage costs, basis risk, and capital utilization will compress the theoretical return space in actual execution, but this is already sufficient to attract professional market makers and quantitative hedge funds to deploy on a large scale. The third value is the structural opportunity for cross-exchange arbitrage. Since same-name instruments are dispersed across multiple independently operated platforms with no unified clearing mechanism, the average price spread for Samsung Electronics perpetual contracts between Binance and Hyperliquid maintains at 0.93%, with a maximum of up to 2.3% during extreme periods. Particularly during nighttime and weekends when on-chain liquidity declines due to the closure of spot markets, the spread further widens, providing arbitrage traders with multi-platform access a natural window for cyclical profits.
IV. Four Major Directions of Innovation Trends and Business Opportunities
The rapid expansion of the tokenized equity perpetual contract market is fostering four innovation directions with independent commercial value. The first direction is professional market maker services. Unlike the traditional financial market model where designated market makers hold a monopoly, the on-chain perpetual contract market is open to any participant with sufficient capital and technical capability. The current reality of same-name instruments being independently priced across multiple platforms means that nighttime and weekend spreads naturally widen to 0.15% to 0.75%, creating a sustained and highly predictable profit space for professional market makers. The second direction is regional oracle services. The pricing demand for Asian market equities outside New York and London trading hours has given rise to an entirely new oracle sub-market—oracle service providers capable of providing high-frequency, multi-layer-verified pricing data during Asian equity market closure periods will become key infrastructure providers for this segment. The third direction is tokenized issuance intermediary services. Currently, a large number of constituents in KOSPI 200, Nikkei 225, and Hang Seng Index have not yet been tokenized for issuance. One-stop "issuance-as-a-service" platforms that can provide compliance docking, asset custody, pricing parameter setting, and liquidity guidance between traditional securities issuers and on-chain trading platforms hold vast market potential. The fourth direction is on-chain hedge fund strategy based on basis. Compared with traditional basis hedging, the on-chain perpetual contract version offers structural advantages, including higher capital efficiency due to the absence of traditional securities settlement cycles and compound revenue streams from cross-platform spreads. Professional hedge funds can dynamically allocate positions across multiple platforms to achieve high-frequency turnover and amplify returns.
From a broader industry perspective, Coinbase's launch of CFTC-regulated index perpetual contracts marks the beginning of U.S. regulators incorporating this new type of financial product into the formal classification system. The Basel Committee restarted the review of bank crypto asset exposure rules in November 2025; once banks are permitted to hold tokenized equity exposure, the entire segment's liquidity will see exponential growth. 4Pillars Research forecasts that if 1% of global stock market capitalization is tokenized, the market size could reach $1.34 trillion by 2030, while the current penetration rate is less than one ten-thousandth.
V. Risk Analysis and Investment Strategies
Although the tokenized equity perpetual contract market is growing rapidly, its risk structure is complex and multi-layered. Smart contract risk is the most direct technical threat—perpetual contract protocols suffered cumulative losses exceeding $500 million between 2024 and 2025 due to oracle attacks, liquidation logic vulnerabilities, and front-end manipulation. The most cautionary event among these was the Hyperliquid JELLY token incident in February 2025, which exposed flaws in the liquidation mechanism and caused some users to suffer actual losses involuntarily. At the market risk level, the high-leverage characteristic amplifies returns while exponentially amplifying liquidation risk—the low-liquidity environment during earnings seasons or major policy event releases may trigger cascading liquidations and lead to price crashes. Liquidity fragmentation risk constitutes the third dimension of systemic threat—perpetual contracts on the same instrument such as Samsung Electronics or SK Hynix are dispersed across multiple independent platforms each with its own pricing, lacking a unified clearing coordination mechanism between platforms, which may lead to massive and persistent price spread distortions between parallel markets under extreme market conditions.
Regulatory uncertainty is the most significant exogenous risk factor. Attitudes vary significantly across countries on this issue: although the legislative process for U.S. CLARITY Act has proposed safe harbor provisions for DeFi developers, overall progress remains hindered; the EU MiCA framework's specific scope of coverage for on-chain equity derivatives remains unclear; Hong Kong and Singapore, as Asian financial centers, have not yet issued specific regulatory guidelines for tokenized equities; Japan's Financial Services Agency's cautious attitude toward crypto derivatives may also limit the pace of product adoption in the Japanese market.

Based on the above risk framework, investment strategies can be constructed from three dimensions. The first dimension is platform token allocation strategy—the HYPE token is highly correlated with platform trading volume due to Hyperliquid's 30% fee buyback-and-burn mechanism, while ONDO and DYDX represent the core beta instruments of the leading RWA segment protocol and decentralized derivatives infrastructure respectively. The second dimension is ecosystem participation strategy—quantitative teams can deploy automated trading systems based on funding rate arbitrage and cross-platform spread arbitrage, while retail investors can leverage the overnight price discovery function to optimize next-day trading decisions on traditional stocks. Empirical data shows that this auxiliary decision-making can improve the win rate of short-term Asian market strategies by approximately 7 to 12 percentage points. The third dimension is the Gamma market-making strategy—simultaneously providing liquidity on multiple exchanges and automatically hedging exposure to earn the bid-ask spread, while also leveraging the cyclical directional returns of funding rates to enhance overall returns. The core risk monitoring indicators should focus on three time nodes: the impact of the Roman Storm trial verdict in the second half of 2026 on the legal definition of DeFi developer liability boundaries, whether the CLARITY Act can achieve substantive legislative progress in the U.S. Congress, and the specific compliance requirements for the Travel Rule in DeFi scenarios under the next revision of FATF standards.
VI. Conclusion and Future Outlook
The true historical significance of tokenized equity perpetual contracts lies in their attempt to answer the most central proposition since the birth of blockchain technology: Can on-chain finance transcend the narrow scope of "on-chain finance for cryptocurrencies" to truly become "on-chain finance for all assets"? The 85% movement consistency and regression coefficients of 0.93 to 1.00 of Samsung Electronics perpetual contracts strongly demonstrate that on-chain derivatives can not only effectively track the price movement trajectory of traditional assets but can also independently perform effective price discovery and information aggregation functions during traditional market closure periods. Judging from the perspective of the investment clock, the second half of 2026 to 2027 will be the critical catalytic window for this segment—the market response after the launch of Coinbase's regulated index perpetual contracts, whether the SEC's "Innovation Exemption" can be formally implemented, and whether Hyperliquid can maintain its market share leadership in the on-chain perpetual contract field—these three observation indicators will become the core reference frame for judging whether the tokenized equity market can move from an experimental stage to mainstream adoption. For investors with sufficient risk tolerance, the huge gap between the current penetration rate of less than 0.01% of global stock market capitalization contrasted with the compound growth rate exceeding 200x constitutes a typical early-stage segment investment landscape—high return potential coexists with high uncertainty. Participants should adhere to the criteria of controllable underlying risk, traceable compliance pathways, and verifiable technical iteration as the yardsticks for screening investment targets.