What’s Going On With The Dogecoin Price?

bitcoinistPublicado a 2025-04-28Actualizado a 2025-04-29

Resumen

With the broader crypto market witnessing a bullish reversal, the Dogecoin price is again looking to reclaim the psychological $0.2...

Trusted Editorial content, reviewed by leading industry experts and seasoned editors. Ad Disclosure

With the broader crypto market witnessing a bullish reversal, the Dogecoin price is again looking to reclaim the psychological $0.2 level. Crypto analysts such as Master Kenobi have suggested that the leading meme coin is primed to reach new highs. 

Dogecoin Price Ready To Breakout From Falling Wedge 

In an X post, crypto analyst Trader Tardigrade stated that the Dogecoin price is showing a breakout from a falling wedge. This came as he revealed that a bullish cross has occurred on the Stochastic Relative Strength Index (RSI) biweekly chart. His accompanying chart showed that DOGE could break above the $0.2 price level on this move.   

Interestingly, in another X post, Trader Tardigrade predicted that the Dogeocoin price could soon outperform the Bitcoin price. The analyst revealed that the current On-Balance Volume (OBV) pattern on the DOGE/BTC chart mirrors the previous one. He added that this pattern emerged just before the leading meme coin outperformed the flagship crypto from October to December 2024. 
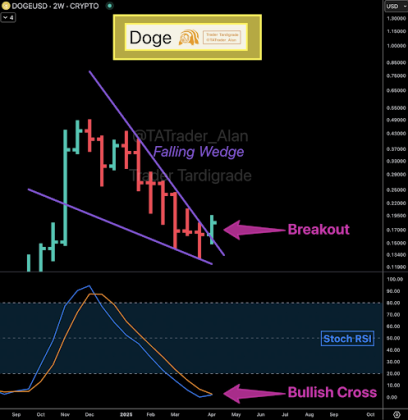
Dogecoin
Source: Trader Tardigrade on X

The crypto analyst remarked that given that both price action and indicators show the same pattern, he believes the Dogecoin price will soon “drastically” outperform Bitcoin. DOGE could enjoy massive gains if it replicates it price performance from October to December 2024. The meme coin had underperformed for most of 2024 but ended the year on a high as it went on to record the most year-to-date (YTD) gain among the top 10 cryptos by market cap. 

Trader Tardigrade also believes that another bull run may be imminent for the Dogecoin price. He revealed that DOGE has broken down to its Round Bottom in this cycle. Based on this, he asserted that a “massive” bull run is imminent for the leading meme coin. His accompanying chart showed that DOGE could reach as high as $2.8 when it records this massive bull run. 

Update On The DOGE Macro Chart

In an X post, crypto analyst Master Kenobi provided an update on the macro chart for the Dogecoin price. He stated that the macro chart and a comparison of the current configuration with the situation in 2017 reveal that the meme coin has all the necessary ingredients for a “massive” pump.

The crypto analyst also revealed that the 21-day EMA on the 3-day chart indicates that the Dogecoin price current outlook is bullish. He remarked that additional factors such as bullish divergence and the breaking of the trendline on the Relative Strength Index (RSI) also reinforce this bullish outlook. It is worth mentioning that the analyst recently predicted that the leading meme coin could rally to a new all-time high (ATH) by June. 

At the time of writing, the Dogecoin price is trading at around $0.18, up in the last 24 hours, according to data from CoinMarketCap.

Dogecoin
DOGE trading at $0.18 on the 1D chart | Source: DOGEUSDT on Tradingview.com
Featured image from Getty Images, chart from Tradingview.com
Editorial Process for bitcoinist is centered on delivering thoroughly researched, accurate, and unbiased content. We uphold strict sourcing standards, and each page undergoes diligent review by our team of top technology experts and seasoned editors. This process ensures the integrity, relevance, and value of our content for our readers.

Scott Matherson is a leading crypto writer at Bitcoinist, who possesses a sharp analytical mind and a deep understanding of the digital currency landscape. Scott has earned a reputation for delivering thought-provoking and well-researched articles that resonate with both newcomers and seasoned crypto enthusiasts. Outside of his writing, Scott is passionate about promoting crypto literacy and often works to educate the public on the potential of blockchain.

Lecturas Relacionadas

Ethereum y Bitcoin enfrentan una compresión de oferta histórica: estas 2 métricas revelan qué sigue

A pesar de meses de volatilidad en el mercado, los tenedores de Ethereum y Bitcoin siguen mostrando poco interés en devolver sus monedas a los exchanges. Las retiradas persistentes continúan reduciendo la oferta líquida disponible. En el momento de publicación, la cantidad de Bitcoin almacenada en exchanges está en su nivel más bajo desde 2017, y la de Ethereum en su mínimo desde 2015. Los flujos netos negativos indican que los inversores institucionales y a largo plazo prefieren custodiar sus monedas en ETFs o tesorerías corporativas, lo que reduce la presión de venta a corto plazo y crea escasez. Si la demanda se recupera, esta oferta limitada podría amplificar el descubrimiento de precios. Detrás de esto, los tenedores a largo plazo de Bitcoin están absorbiendo la oferta circulante, reflejando una creciente convicción. El cambio neto de su posición ha vuelto a ser positivo, confirmando una nueva acumulación. Las "HODL Waves" y el aumento de la oferta ilíquida muestran que las monedas más antiguas permanecen inactivas. La oferta en manos de tenedores a largo plazo se acerca a los 15 millones de BTC, mientras que la de los tenedores a corto plazo ha disminuido, sugiriendo una transferencia hacia manos más fuertes. Sin embargo, el mero ajuste de la oferta puede no sostener la recuperación de Bitcoin. Una tendencia alcista duradera aún requeriría una demanda de compra más fuerte para absorber la liquidez disponible. Sin ese apoyo, Bitcoin podría tener dificultades para mantener el impulso a pesar de los saldos en exchanges cada vez más escasos.

ambcryptoHace 3 hora(s)

Ethereum y Bitcoin enfrentan una compresión de oferta histórica: estas 2 métricas revelan qué sigue

ambcryptoHace 3 hora(s)

AxBlade × AWS Hong Kong Summit Concluye: Definiendo la Responsabilidad para la IA Física

AxBlade, la capa de rendición de cuentas para IA autónoma, coorganizó el evento exclusivo "De la IA Agente a la IA Física: ¿Qué se financia después de la ola de modelos?" junto con el AWS Summit Hong Kong Week. La reunión, dirigida a invitados, reunió a más de 100 fundadores, investigadores, líderes empresariales e inversores para examinar la brecha crítica de infraestructura entre las demostraciones de IA y su implementación en el mundo real. El evento destacó el consenso de que la IA Física no puede pasar del laboratorio a la producción sin identidad verificable, ejecución confiable y registros de comportamiento criptográficamente comprobables. Tres paneles exploraron el cambio del financiamiento de modelos hacia infraestructura, los desafíos de responsabilidad y seguridad cuando los agentes de IA interactúan con sistemas físicos, y la necesidad de middleware para la adopción empresarial, enfatizando la auditabilidad. Como única capa de infraestructura nativa de blockchain representada, AxBlade demostró cómo su blockchain pública Layer 2, que combina Identidad Descentralizada (DID), Entornos de Ejecución Confiables (TEE) y Prueba de Comportamiento de Conocimiento Cero (PoB), aborda directamente esta brecha de responsabilidad. "No estamos construyendo modelos de IA. Estamos construyendo la infraestructura de confianza que los hace auditables", afirmó Nick Hau, fundador de AxBlade. El evento incluyó sesiones de networking y una cena privada, con participación de instituciones como AWS, NVIDIA, Y Combinator, Roche, Pfizer y la City University de Hong Kong.

TheNewsCryptoHace 4 hora(s)

AxBlade × AWS Hong Kong Summit Concluye: Definiendo la Responsabilidad para la IA Física

TheNewsCryptoHace 4 hora(s)

Trading

Spot
活动图片