Understanding how early token holders behave can give traders valuable insights about market trends and potential price corrections/tops, especially during the token’s early days when price discovery is still in progress. Since early holders often control a large share of the supply, their buying and selling decisions can strongly influence price movements.
In this article, we will analyze these early phases - particularly the first major top that often emerges once the initial price discovery period concludes. To do so, we will explore the following four metrics:
- Early Holder Balance
- The Herfindahl Index
- NUPL (Net Unrealized Profit/Loss)
- Cost Basis Distribution (CBD) heatmap.
By looking at the same phenomenon from different angles, traders can better anticipate market shifts and time their exits more effectively.
1. Early Holder Balance
A straightforward way to gauge their impact is by tracking how balances of early holders change over time. Early holders typically accumulate tokens at low prices. As the asset appreciates, many start selling, increasing sell pressure and often triggering price corrections. Tracking how these balances evolve can reveal large-scale profit-taking trends, helping traders anticipate corrections.
How It Works:
- Balance Dips: When early holders sell their tokens, their cumulative balances decrease. If these declines align with price peaks, it suggests significant sell pressure that may signal a top.
- Price Impact: Since early holders often control a large portion of the token supply, their selling can create sharp price declines.
- Chart Insights: By monitoring balance evolution, traders can spot trends showing large-scale profit-taking, helping them anticipate market corrections.
Figure 1 below shows how early SHIB holders initially accumulated tokens at low prices (reaching over 20% of the total supply) and later sold a substantial amount as the price spiked, triggering a sharp decline. In the chart, the blue line represents the balance in SHIB units, while the yellow line shows the percentage of the total token supply held by early SHIB holders. This visualization highlights how their relative ownership evolved over time and the impact of their selling activity on the market.
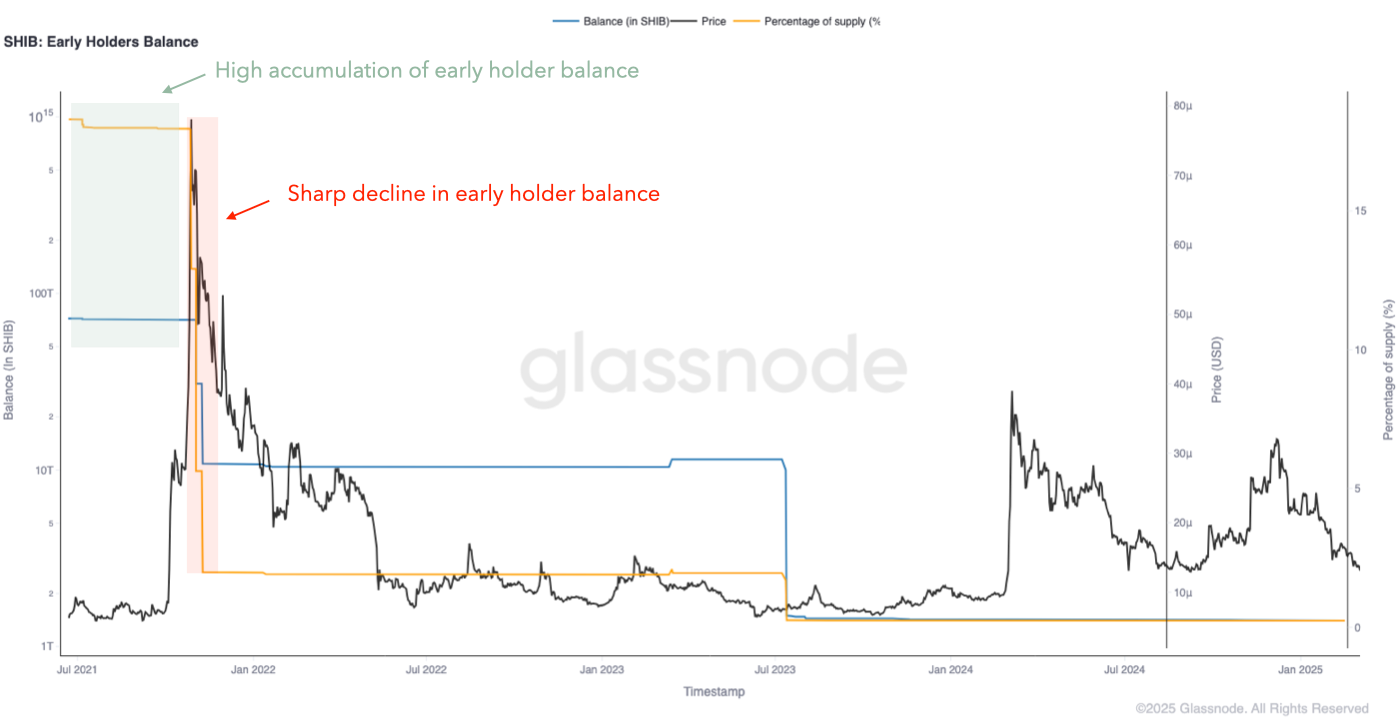
While the rest of the metrics in this article will focus on SHIB to ensure a consistent analysis of the same asset from different perspectives, it is worth first examining Early Holder Balance across other tokens. This allows us to observe different early holder balance behaviors and their potential impact on price before narrowing our focus to SHIB.
Figure 2 provides another example of how early holders strategically sold their APW holdings at key price peaks.
- First sell-off (left side of the chart): The yellow line, representing the percentage of total supply held by early holders, drops sharply. This indicates a massive sell-off, which happens around the first major price peak.
- Accumulation phase (middle of the chart): After the initial sell-off, the remaining early holders showed low activity
- Second sell-off (right side of the chart): As the price experiences another uptrend, early holders, after accumulating more tokens, once again unload a significant portion of their holdings, causing a steep decline in their percentage of total supply.
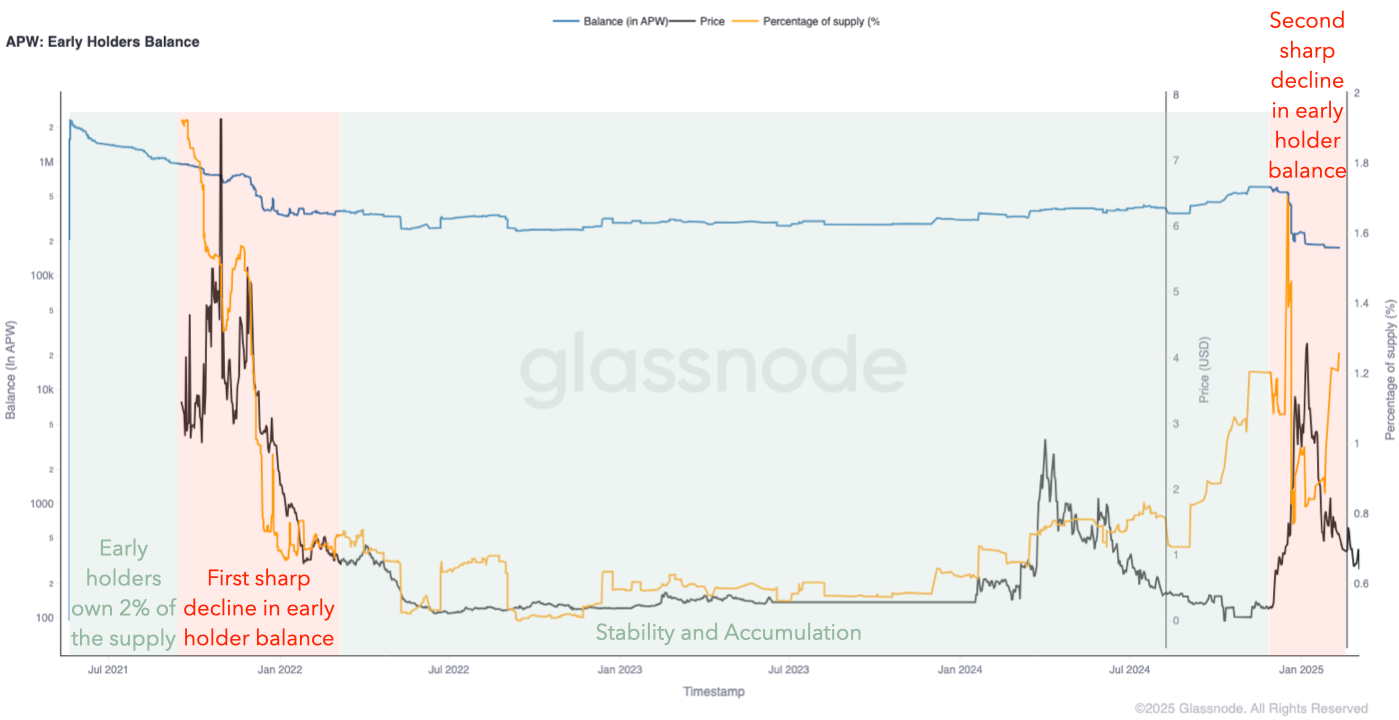
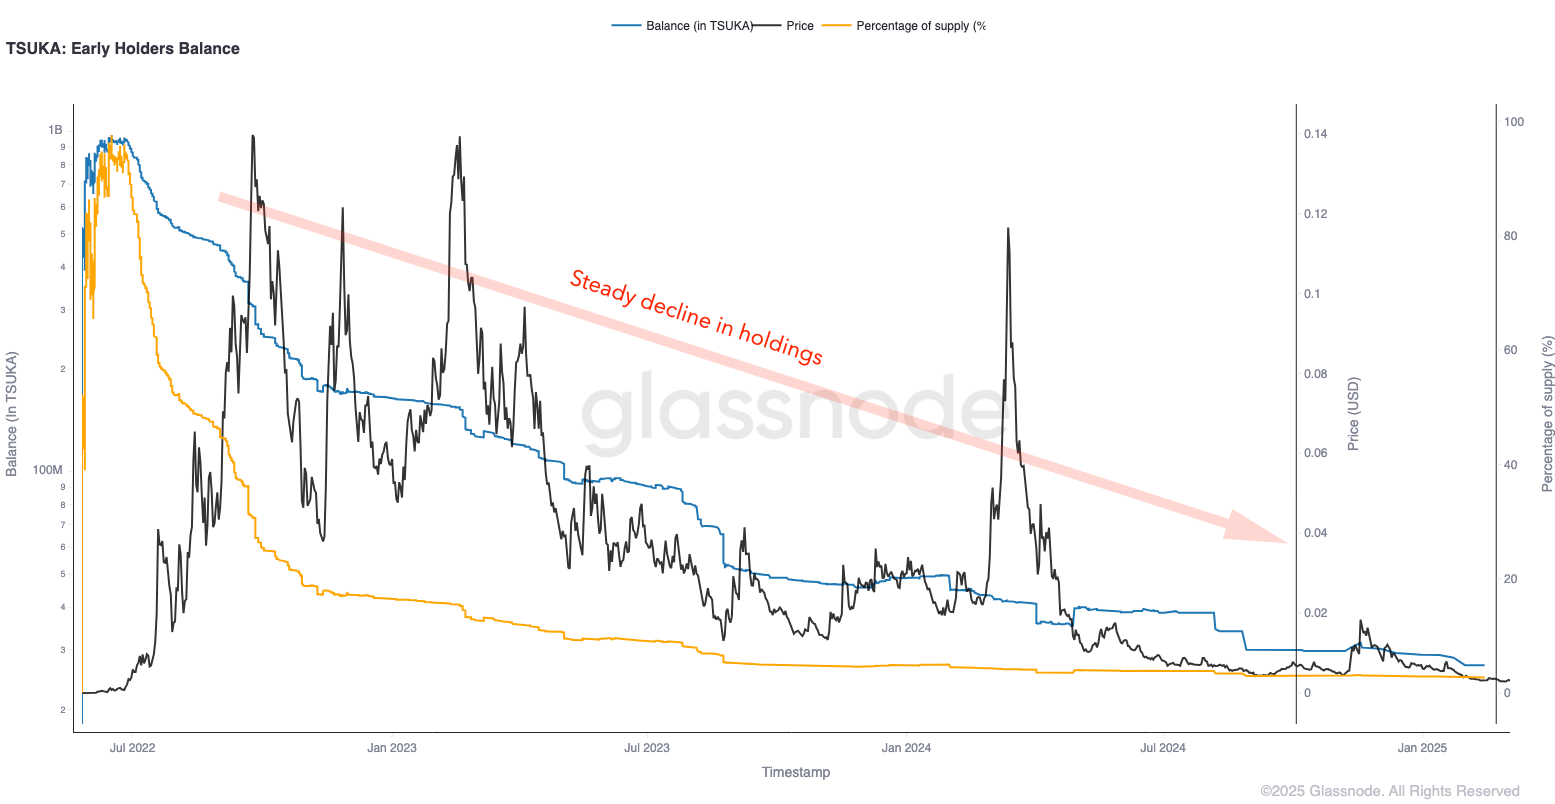
Figure 3 chart shows a gradual reduction in TSUKA's early holders’ positions, unlike the abrupt sell-offs in the previous examples:
- Steady decline in holdings helped avoid sharp price drops.
- More controlled selling led to better price stability.
- Selling pressure was spread over time, reducing market shocks.
This suggests a measured exit strategy that helped prevent extreme volatility.
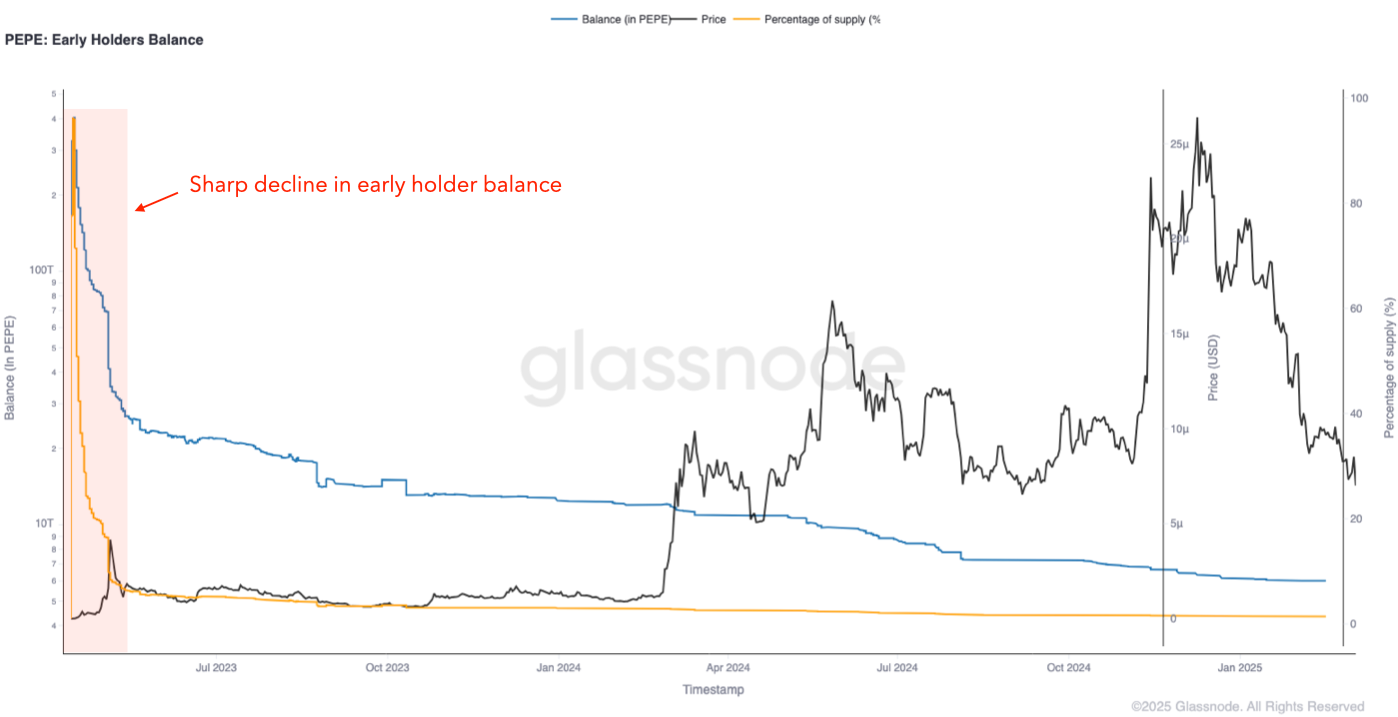
In Figure 4, early PEPE holders sold most of their tokens immediately after the first price increase, as seen in the sharp drop in the orange line at the left.
- Early exit: Most tokens were sold at the start, triggering a sharp decline in price, but also preventing large future sell-offs. This is similar to what happened in SHIB.
- Price discovery: With most early holders out, the market was able to set the price more organically.
- Long-term stability: Since there were no major future distributions, price movements were driven more by new demand rather than large holder activity.
This approach avoids gradual selling pressure and allows the market to determine a fair price without ongoing supply shocks.
The Early Holder Metric is currently not part of Studio.
Interested in learning more about it?
Please contact our institutional sales team for further details.
2. Monitoring the Herfindahl Index
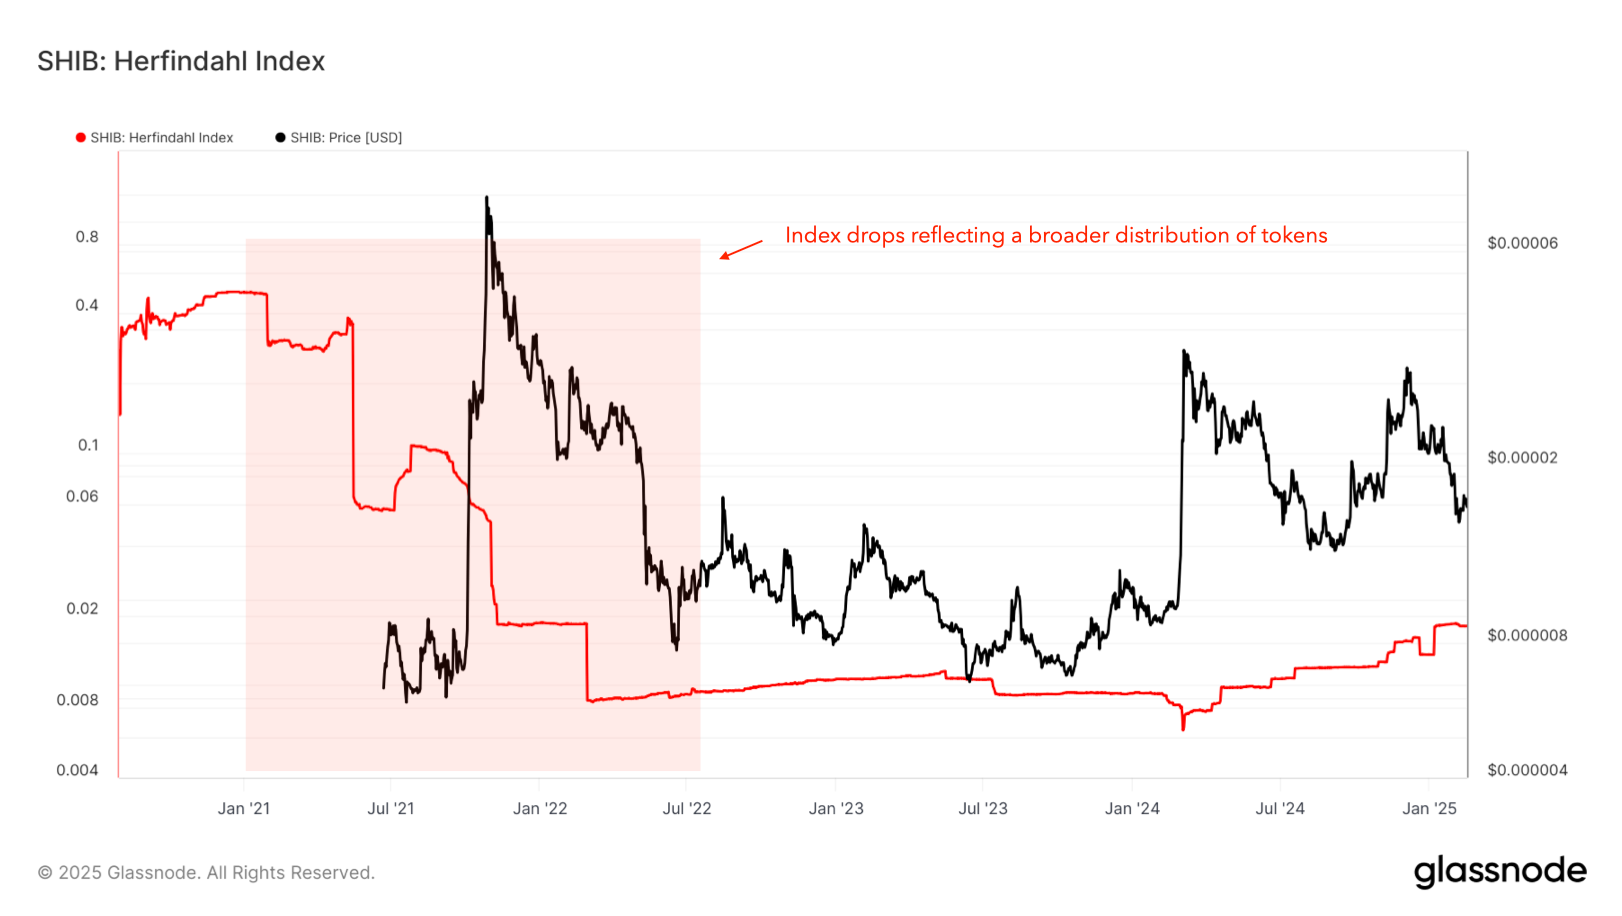
The Herfindahl Index measures market concentration. A high index indicates that a few large holders dominate the market, while a low index suggests a more even distribution of tokens.
How It Works:
- Early Holder Influence: At launch, early holders tend to concentrate a large share of the supply, leading to a high Herfindahl Index.
- Market Dynamics: As these early holders sell, the index drops, reflecting a broader distribution of tokens.
- Market Signals: A falling Herfindahl Index alongside declining early holder balances suggests that tokens are spreading across more market participants, signaling potential profit-taking behavior and a possible market top.
Figure 5 shows the SHIB Herfindahl Index (red line) alongside the price (black line). The sharp decline in the index corresponds to moments when large holders distributed their holdings, coinciding with price peaks.
3. Using NUPL (Net Unrealized Profit/Loss)
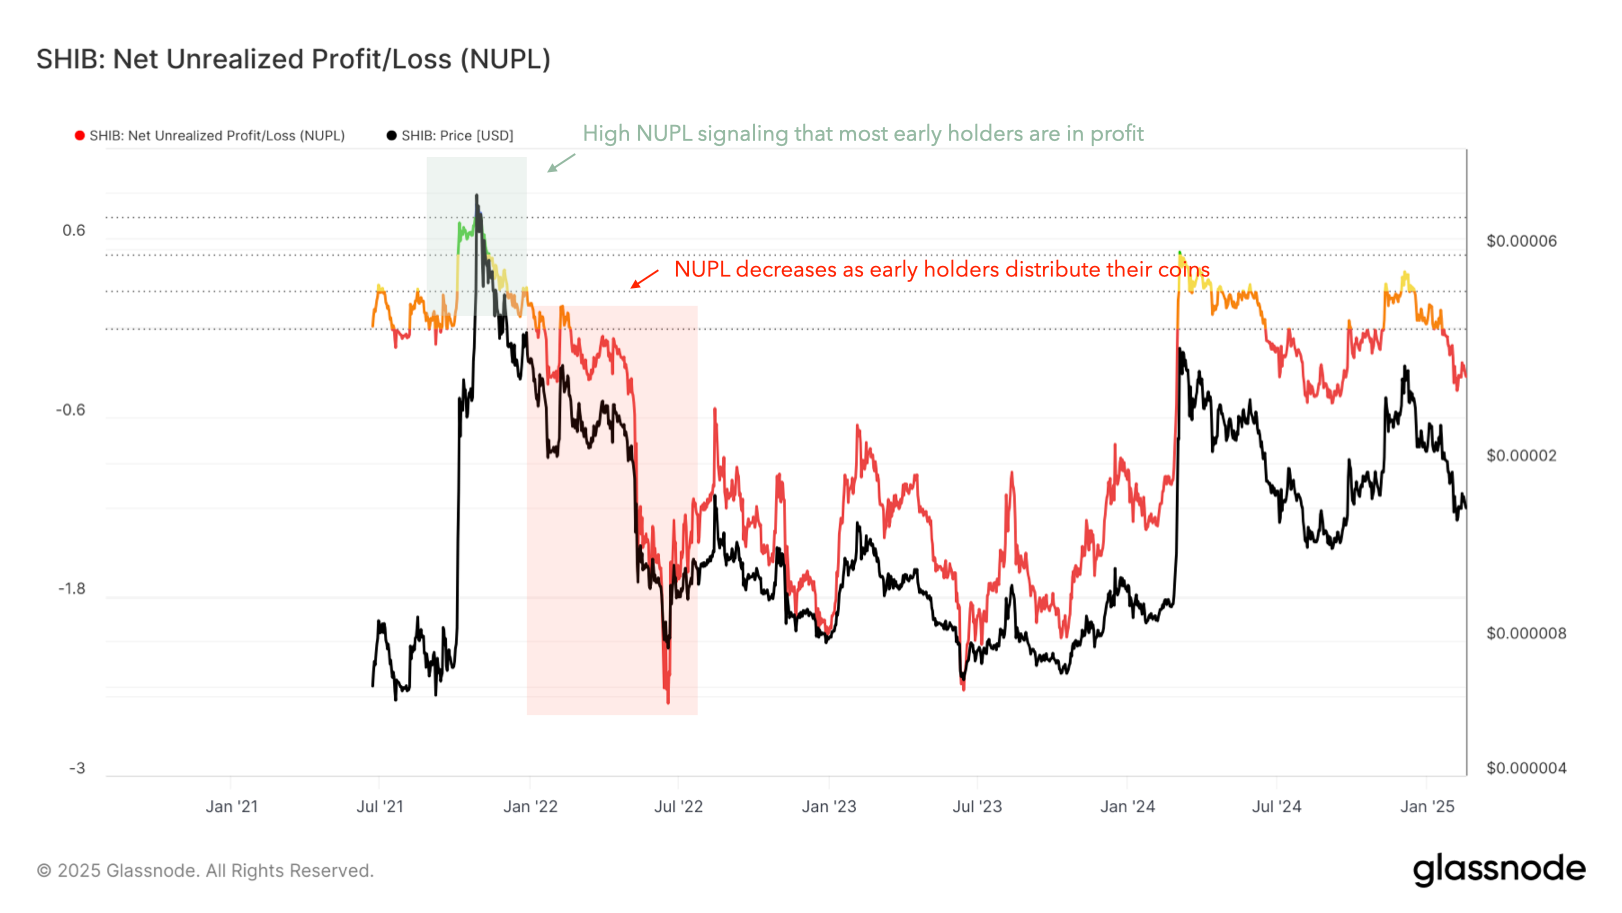
Net Unrealized Profit/Loss (NUPL) is an on-chain metric that quantifies the unrealized gains or losses of all holders at a given time. It serves as a sentiment indicator, helping to detect potential market tops and bottoms based on investor profitability.
In the case of early holders, their profit-taking behavior is often reflected in the early NUPL peaks, as they tend to accumulate at lower prices and distribute holdings during periods of strong price appreciation.
How It Works:
- Early NUPL Increases → Euphoria and Distribution: High NUPL values in the early stages of a token’s lifecycle indicate that most holders are in profit, which often leads to profit-taking by early holders and increases sell pressure.
- Early NUPL Declines → Early holders exit: If a token is reaching new highs but NUPL starts declining early in its lifecycle, it suggests that early adopters and large holders are distributing their holdings, leading to a weakening market structure.
Figure 6 below visualizes SHIB’s NUPL alongside price, showing how early high NUPL values coincide with price peaks, often followed by sell-offs. Please focus only on the first price peak, as it represents the initial phase where early holders are most active, as we’ve seen in the early holder balance metric.
4. Analyzing the CBD (Cost Basis Distribution)
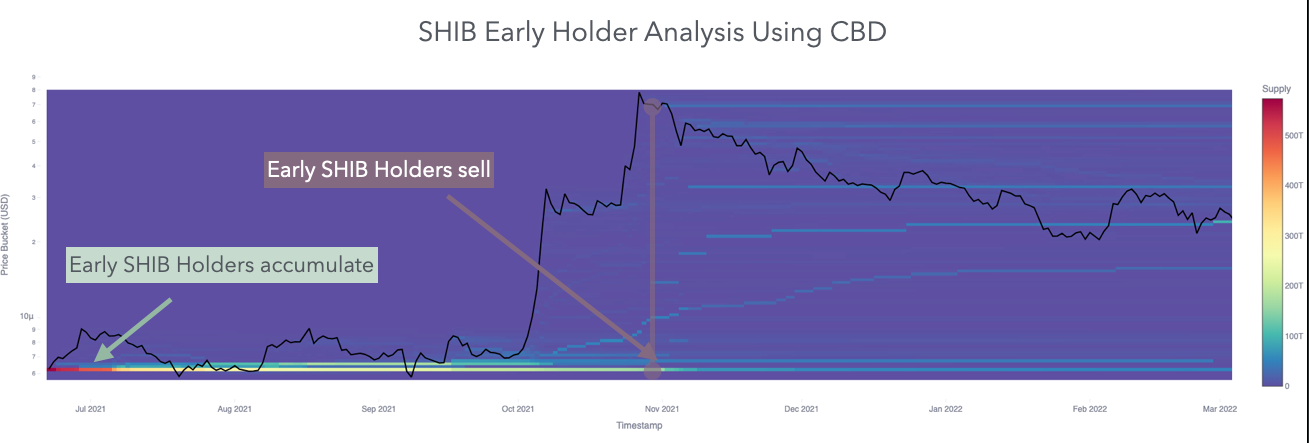
The CBD heatmap visualizes the cost basis—or the average price at which tokens were acquired—over time. By focusing on the early period of the chart, we can identify the cost basis bands accumulated by early holders, providing insights into their initial accumulation zones and how their distribution behavior evolved over time.
How to Read the Heatmap:
Each band on the y-axis represents a specific cost basis level, with its color indicating how much supply was acquired at that average entry price. The color scale ranges from blue (lower concentration) to red (higher concentration), showing how much supply is clustered at each price over time (x-axis).
The black line represents the current price.
- Bands below the black line are in profit, as their cost basis is lower than the current price.
- Bands above the black line are in loss, as their cost basis is higher than the current price.
This visualization helps track how accumulation zones evolve and whether supply is being distributed over time.
How It Works:
- Low Cost Basis: Early holders acquire tokens at very low prices, forming clusters of low-cost basis. This is visible in the chart with red-colored areas during January 2021, highlighting the concentration of early accumulation
- Accumulation vs. Distribution: As the price rises, these holders may begin selling, causing the low-cost segments to thin out. In the chart, this is reflected by the color shifting from red—indicating a high concentration of supply at low-cost bases—to more bluish tones, signaling that the accumulated supply in those low-cost bases is being distributed.
- Timing Tops: If the heatmap shows a substantial portion of low-cost holdings being sold near a price peak, it may indicate the market is reaching its top.
- Anticipating Sell-Offs: The CBD Heatmap doesn’t just show when early holders are selling—it also helps predict when they might be inclined to sell. By visualizing their cost basis, it reveals the price levels at which they accumulated tokens. Comparing the current price to these accumulation zones provides insight into how tempting it might be for them to take profits. If the price rises far above these levels, the likelihood of early holders selling increases, making the heatmap a powerful tool for anticipating potential sell-offs before they happen.
The heatmap in Figure 7 shows early SHIB holders accumulating at low price levels (red and yellow bands) during January-2021, followed by a significant sell-off near market peaks in October-November 2021. This is reflected in the sharp price increase, the fading of early accumulation bands, and the subsequent decline.
Conclusion: Why This Framework Matters and How to Use It
Using these four methods together provides a well-rounded view of early holder behavior, helping traders anticipate potential market tops:
- Early Holder Balance Analysis shows when early investors are reducing their positions, often preceding price drops.
- The Herfindahl Index tracks shifts in market concentration, helping to identify whether large holders are exiting or if ownership is becoming more distributed.
- NUPL (Net Unrealized Profit/Loss) is useful for assessing market sentiment, as high NUPL values indicate that many early holders have substantial unrealized gains, making a sell-off more likely.
- The CBD Heatmap pinpoints when early investors take profits, which could mark the end of a price rally.
Each of these approaches complements the others, offering different angles to understand early holder behavior. When multiple metrics align, the signal becomes much stronger, reducing uncertainty and improving decision-making. By integrating these insights, traders can refine their strategies and better navigate the early stages of a token’s market.