Bubblemaps Price Forecast: BMT Surges 228% with Open Interest Hitting $15 Million

cryptonews.ruPublished on 2026-08-10Last updated on 2026-08-10

Abstract

Bubblemaps (BMT) token has experienced a powerful rally, surging over 228% in the past week and more than 116% in 24 hours to trade around $0.03834. Trading volume spiked to approximately $361.86 million. The price broke above the key Fibonacci level of $0.03664 and is trading above its major EMAs, with the Bollinger Band %B indicating potential overbought conditions at 1.03. Immediate resistance lies at $0.0400-$0.0405, with a decisive close above $0.04365 potentially signaling further upside. A significant development is the surge in open interest to around $15 million on August 10th, up from a typical range of $1.5-$2.5 million, indicating increased leveraged speculation and potential for higher volatility. Spot exchange flows have been inconsistent, recently showing a net inflow of about $90,420, which suggests some holders moved tokens to exchanges during the rally. Key support levels to watch are $0.03664, followed by $0.03113 and $0.02726. The short-term direction hinges on whether buyers can defend the $0.03664 support level. A break and hold above $0.04365 could lead to a new price discovery phase, while a failure to hold support may trigger profit-taking toward lower supports.

Bubblemaps (BMT) has shown a powerful rally, with its price rising over 116% in 24 hours. The token is currently trading around $0.03834 after gaining more than 228% over the past week.

Trading activity has also spiked sharply, with the 24-hour volume reaching approximately $361.86 million. As a result, BMT has attracted significant attention as traders assess whether the rise can continue. However, the rapid surge has also pushed momentum into a potentially overbought zone.

BMT's Breakout Gains Momentum

BMT recently climbed from the $0.02 area and reached roughly $0.0391 on the four-hour chart. This move lifted the price above the Fibonacci retracement level of $0.03664. This level now represents a crucial area for buyers to defend the breakout.

Moreover, BMT is trading confidently above its 20, 50, 100, and 200-period exponential moving averages. This alignment reinforces the strength of the current bullish structure. Additionally, the Bollinger Band %B indicator is at 1.03, indicating the price remains above the upper zone.
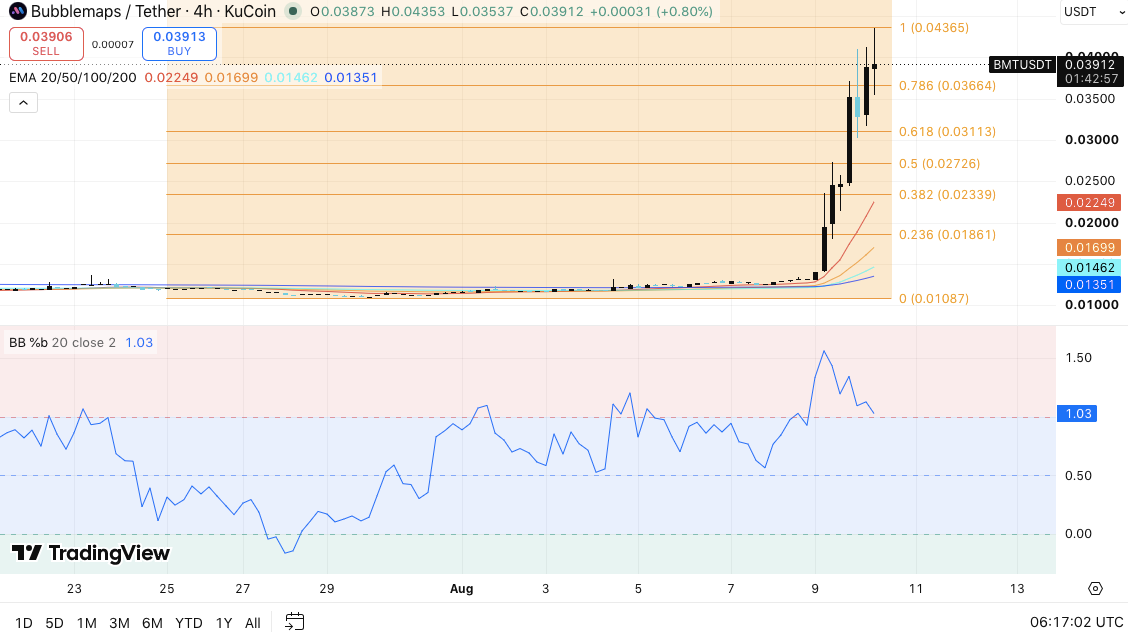
Bubblemaps Price Dynamics (Source: TradingView)

Importantly, such momentum could support further gains if buyers maintain high demand. However, extended moves often increase the likelihood of short-term profit-taking. Therefore, traders may watch the $0.03664 level closely during any pullback.

Related: Pump.fun Price Forecast: Can PUMP Hold the Breakout After an $807M SOL Sale?

BMT faces immediate resistance in the $0.0400–$0.0405 area. A decisive break above this zone could target $0.04365. Consequently, a sustained four-hour close above $0.04365 could strengthen the broader continuation pattern.

Open Interest Signals Rising Speculation

The derivatives market has recently added another significant factor to BMT's outlook. Open interest remained subdued for several months, typically fluctuating between $1.5 and $2.5 million.
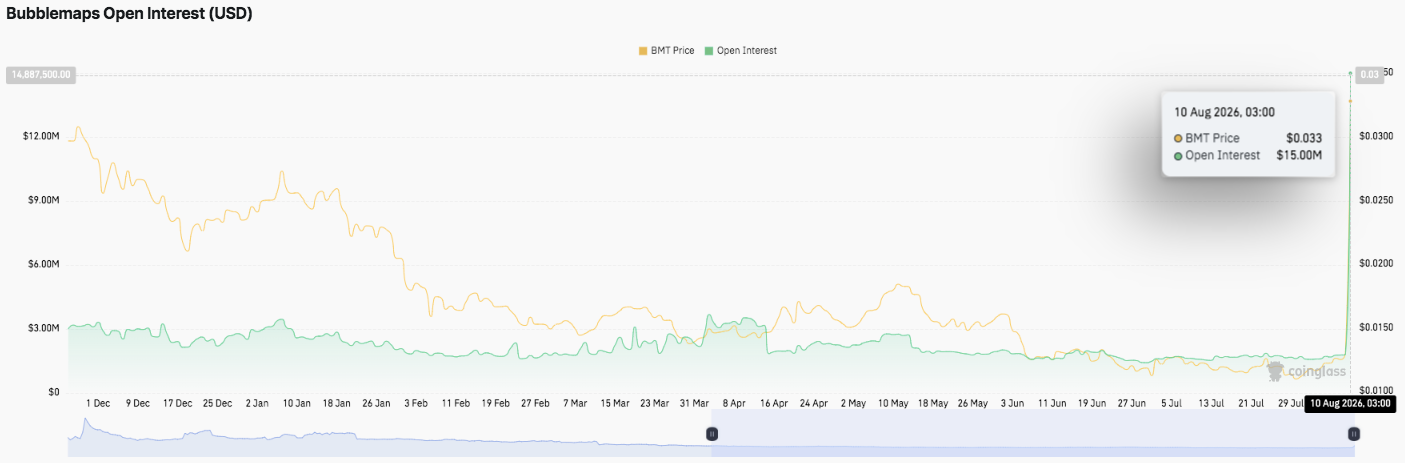
Source: Coinglass

Brief spikes were observed in March and April, but traders failed to maintain these higher positioning levels. However, open interest surged to approximately $15 million on August 10.

This increase represents a significant expansion in leveraged positions surrounding the token. As a result, BMT could experience stronger price swings if traders actively increase or unwind positions.

Furthermore, rising open interest alongside the sharp price increase can amplify both bullish momentum and potential downside volatility.

Exchange Flows Provide a Mixed Signal

Spot exchange flows paint a less decisive picture. The flow data has repeatedly switched between inflow and outflow, showing inconsistent exchange activity.
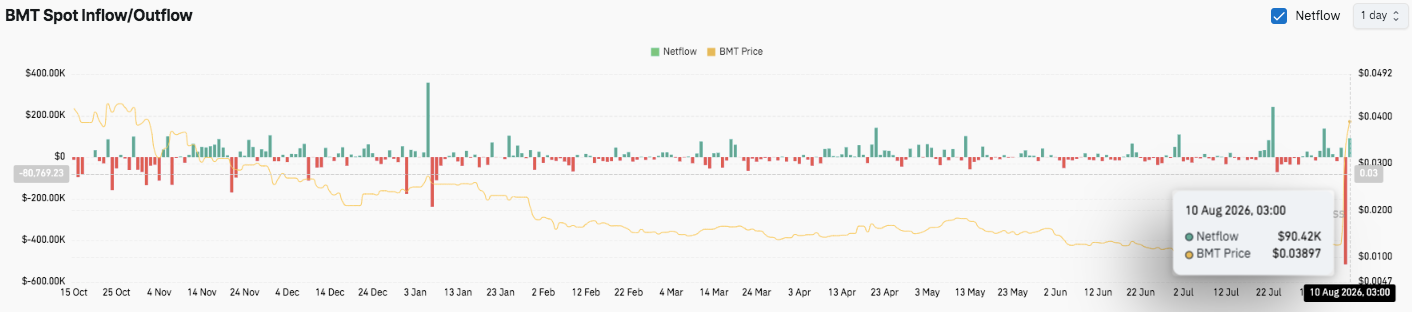
Source: Coinglass

Recently, the token recorded approximately $90,420 in net inflows. This movement suggests some holders may have transferred tokens to exchanges amidst the rally.

However, prior outflows indicate periods of potential accumulation. Therefore, current flows do not yet establish a clear distribution trend.

Bubblemaps Technical Price Forecast

Key levels remain closely watched following BMT's explosive rise:

Upside levels: $0.0400–$0.0405 represents the immediate resistance zone, followed by $0.04365 — a significant Fibonacci hurdle. A decisive breakout above $0.04365 could signal further price discovery.

Downside levels: $0.03664 is the first major support, followed by $0.03113, $0.02726, and $0.02339. The 20-period EMA at $0.02249 provides an additional dynamic support level. The technical picture remains strongly bullish, though BMT's position above the upper Bollinger Band indicates short-term overextension.

Will Bubblemaps Rise Further?

The short-term direction of Bubblemaps largely depends on whether buyers can defend $0.03664 following the recent spike. The surge in open interest to $15 million indicates significantly stronger speculative involvement, which could fuel the next major move.

If BMT breaks through $0.0405 and sustains momentum above $0.04365, the token could enter a new phase of price discovery. However, failure to hold $0.03664 could trigger profit-taking towards $0.03113 and $0.02726. At present, BMT remains in a key breakout zone, where momentum, derivatives positioning, and exchange flows are likely to dictate its next directional move.

end-content

Trending Cryptos

Related Questions

QAccording to the article, what is the current price of Bubblemaps (BMT) and what was its percentage increase over the last week?

AAccording to the article, Bubblemaps (BMT) is currently trading around $0.03834 after rising more than 228% over the last week.

QWhat does the article state is the significance of the $0.03664 Fibonacci level for BMT's price action?

AThe article states that the $0.03664 Fibonacci correction level now represents an important area for buyers to defend the recent breakout. A failure to hold this level could lead to profit-taking and a drop toward lower support levels.

QWhat does the sharp increase in Open Interest for BMT to around $15 million indicate, according to the analysis?

AAccording to the analysis, the sharp increase in Open Interest to around $15 million represents a significant expansion in leveraged positions around the token. This indicates stronger speculative participation, which could amplify both bullish momentum and potential downward volatility as traders adjust their positions.

QWhat are the key resistance levels mentioned for BMT's potential upward price movement?

AThe key resistance levels mentioned are the immediate zone at $0.0400–$0.0405, followed by the more significant Fibonacci obstacle at $0.04365. A decisive and sustained break above $0.04365 could signal a new phase of price discovery for BMT.

QBased on the article's technical analysis, what is the primary factor that will likely determine BMT's short-term direction?

ABased on the article's technical analysis, BMT's short-term direction will largely depend on whether buyers can successfully defend the $0.03664 support level following the recent surge. Momentum, derivatives positioning (Open Interest), and exchange flows are the key factors likely to determine its next move from this critical breakout zone.

Related Reads

Bitcoin Price Drops to $62,470 as Sellers Retest $63,000 Support Level

Bitcoin's price fell below $63,000 for a second consecutive day on Friday, hitting an intraday low of $62,470. The cryptocurrency later recovered to trade just above $63,000, leaving it nearly flat for the past 24 hours and for August overall, with a weekly loss of 2.6%. The volatility triggered significant liquidations, with $26 million of leveraged long Bitcoin positions liquidated over 24 hours. Market sentiment was further dampened by data showing over $131 million in outflows from spot Bitcoin ETFs for a second straight day, signaling a potential pullback by institutional investors. Adding to the negative pressure, index provider MSCI has proposed new criteria for "non-operating companies" in its global indexes, which could lead to the exclusion of firms holding significant digital assets like Bitcoin on their balance sheets. Companies such as Strategy and Metaplanet could be affected, potentially forcing index-tracking funds to sell their shares. Strategy publicly criticized the proposal, arguing digital assets are legitimate assets and index providers should not dictate what companies can own. Public consultations on MSCI's proposal end September 30, with a final decision expected by October 16. If approved, exclusions could begin in November, potentially triggering sustained institutional selling and damaging a key bridge for Bitcoin adoption in the corporate sector.

cryptonews.ru1h ago

Bitcoin Price Drops to $62,470 as Sellers Retest $63,000 Support Level

cryptonews.ru1h ago

Trading

Spot

Hot Articles

How to Buy BMT

Welcome to HTX.com! We've made purchasing Bubblemaps (BMT) simple and convenient. Follow our step-by-step guide to embark on your crypto journey.Step 1: Create Your HTX AccountUse your email or phone number to sign up for a free account on HTX. Experience a hassle-free registration journey and unlock all features.Get My AccountStep 2: Go to Buy Crypto and Choose Your Payment MethodCredit/Debit Card: Use your Visa or Mastercard to buy Bubblemaps (BMT) instantly.Balance: Use funds from your HTX account balance to trade seamlessly.Third Parties: We've added popular payment methods such as Google Pay and Apple Pay to enhance convenience.P2P: Trade directly with other users on HTX.Over-the-Counter (OTC): We offer tailor-made services and competitive exchange rates for traders.Step 3: Store Your Bubblemaps (BMT)After purchasing your Bubblemaps (BMT), store it in your HTX account. Alternatively, you can send it elsewhere via blockchain transfer or use it to trade other cryptocurrencies.Step 4: Trade Bubblemaps (BMT)Easily trade Bubblemaps (BMT) on HTX's spot market. Simply access your account, select your trading pair, execute your trades, and monitor in real-time. We offer a user-friendly experience for both beginners and seasoned traders.

4.7k Total ViewsPublished 2025.04.28Updated 2026.06.02

How to Buy BMT

Discussions

Welcome to the HTX Community. Here, you can stay informed about the latest platform developments and gain access to professional market insights. Users' opinions on the price of BMT (BMT) are presented below.

活动图片