The cryptocurrency markets and the United States equities markets witnessed profit-booking this week as the macroeconomic data hinted toward continued rate hikes by the Federal Reserve. Bitcoin (BTC) is down more than 4% and the S&P 500 fell 2.7% to record its worst week of the year.
The CME FedWatch Tool shows a 73% probability of a 25 basis points rate hike by the Fed in the March meeting but after the hotter-than-expected inflation readings in two weeks, the probability of a 50 basis point rate hike has started to slowly gain traction.

Crypto market data daily view. Source: Coin360
During periods of uncertainty, some coins enter a deeper correction while a few buck the trend and continue to outperform. Hence, it becomes important to select the right coins to trade.
A few coins that have witnessed a shallow correction or have bounced sharply off the support have been selected in this list. Let’s see their charts and determine the levels to watch out for.
BTC/USDT
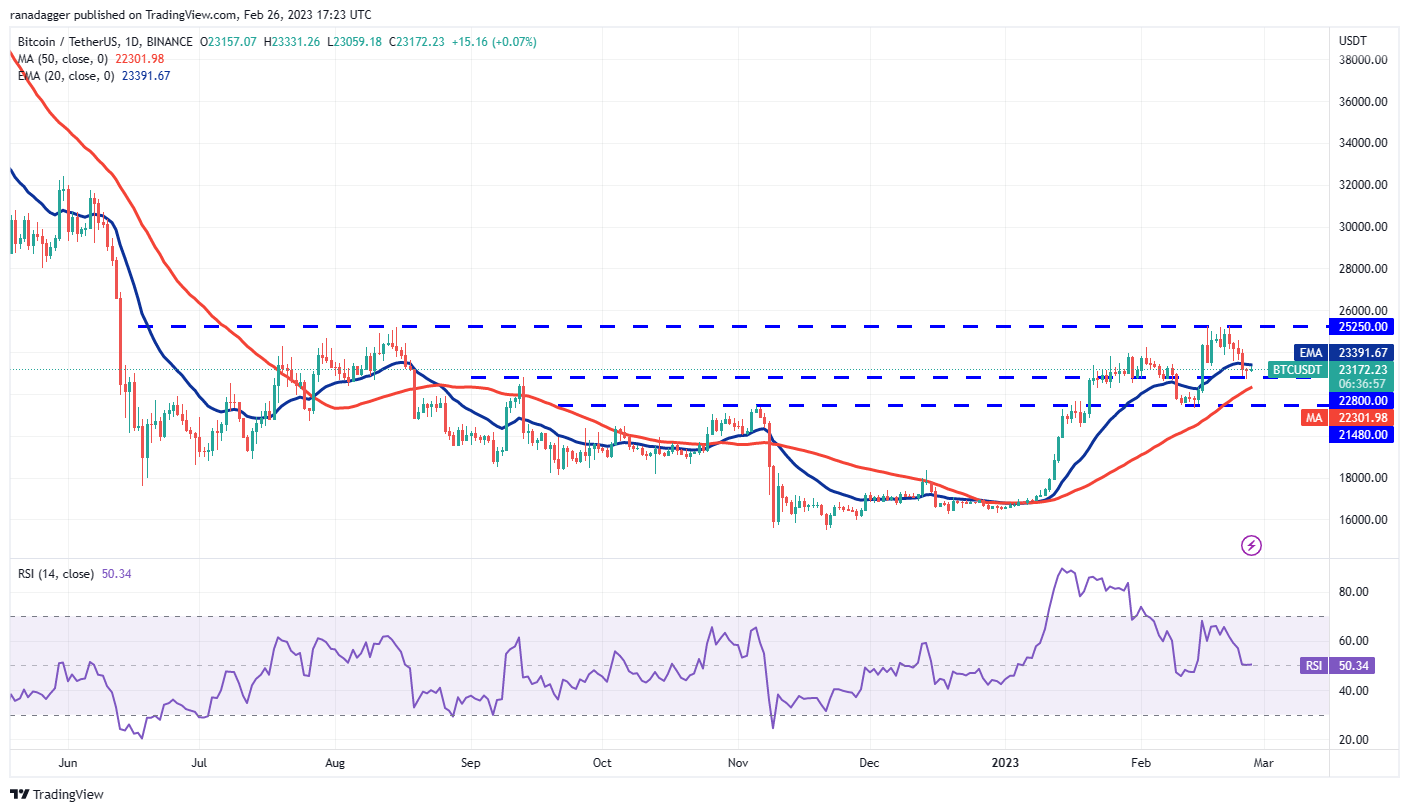
Bitcoin plunged below the 20-day exponential moving average ($23,391) on Feb. 24 but the bears could not build upon this advantage and sustain the price below the strong support at $22,800.
BTC/USDT daily chart. Source: TradingView
The price bounced off $22,800 on Feb. 25 and the bulls are trying to push the price above the 20-day EMA. If they manage to do that, it will indicate that the BTC/USDT pair may consolidate between $25,250 and $22,800 for a few days.
The flattening 20-day EMA and the relative strength index (RSI) near the midpoint also suggest a range-bound action in the near term.
Alternatively, if the price slips below $22,700, the selling could intensify and the pair may plummet to the next strong support at $21,480.
BTC/USDT 4-hour chart. Source: TradingView
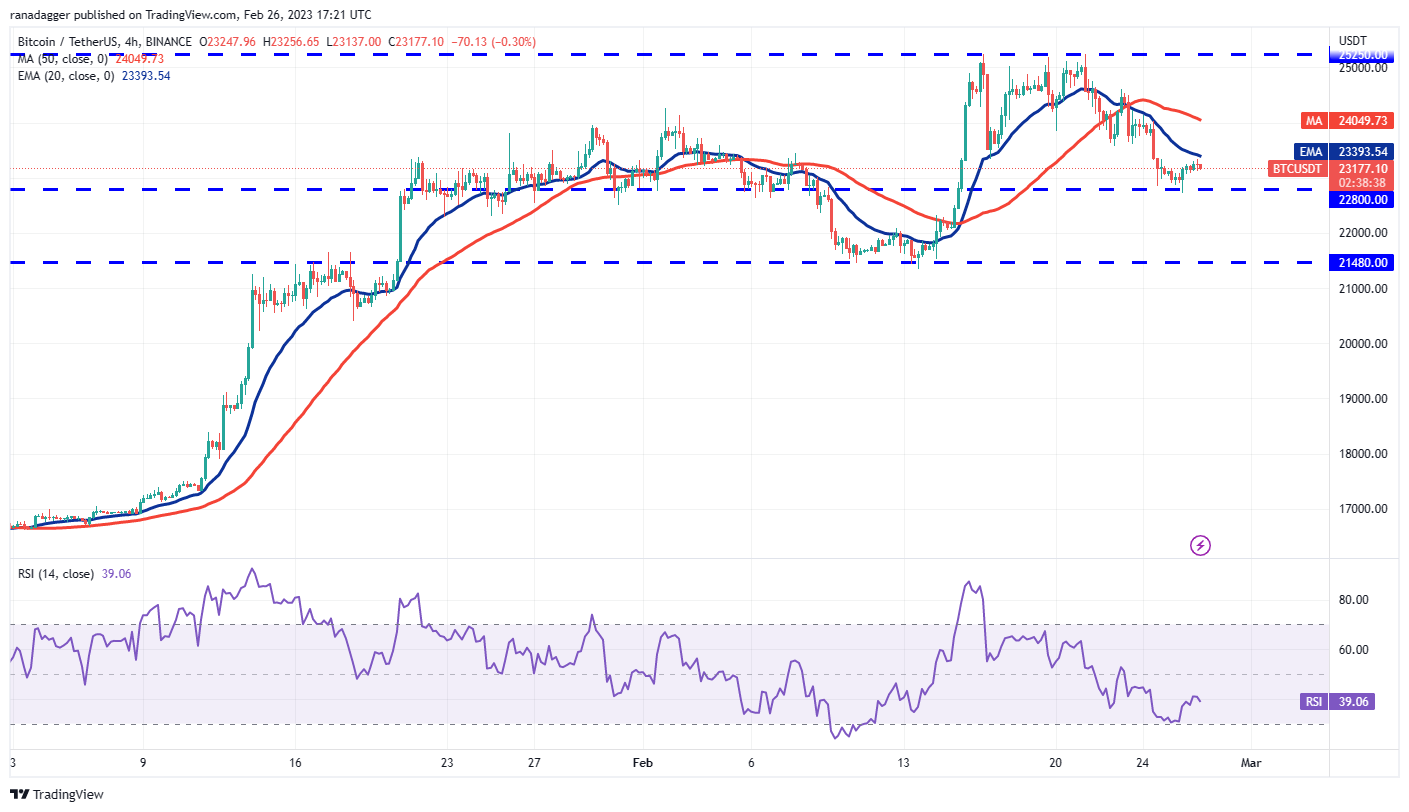
The 20-EMA has turned down on the four-hour chart and the RSI is in the negative territory. This indicates an advantage to the bears. Sellers will try to protect the 20-EMA, and if the price turns down from this level, the likelihood of a break below $22,800 increases. If that happens, the selling may intensify and the pair may slide to $21,480.
On the contrary, if the price breaks above the 20-EMA, it will suggest that bulls are buying on dips. That could push the pair to the 50-simple moving average and keep the price stuck inside the range for some more time.
LDO/USDT
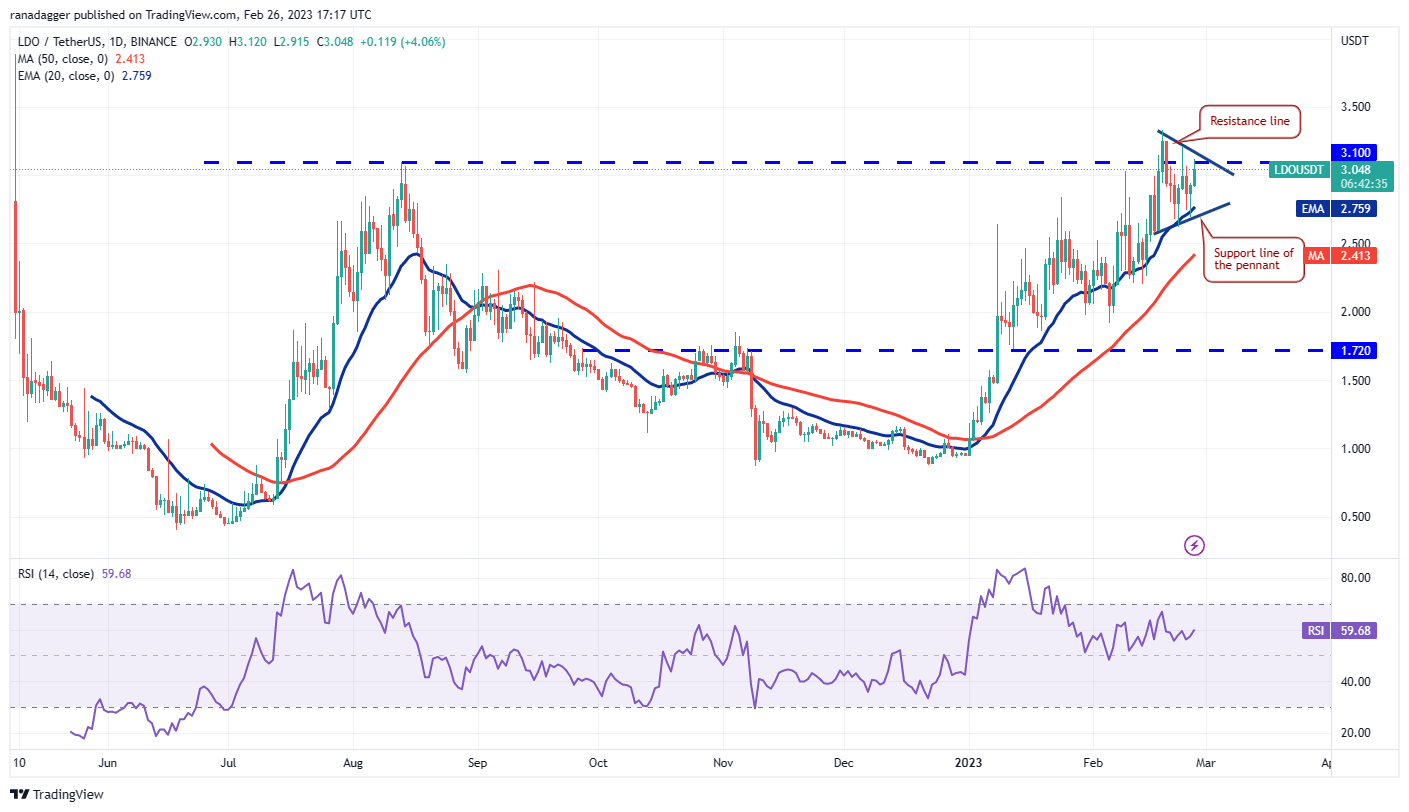
Lido DAO (LDO) did not sustain below the 20-day EMA ($2.75) during the recent correction, which is a positive sign. Another bullish sign is the formation of the pennant near the local highs.
LDO/USDT daily chart. Source: TradingView
The bulls will try to propel the price above the resistance line of the pennant. If they succeed, the LDO/USDT pair could start the next leg of the up-move. The pair may first rise to $3.90 and thereafter attempt a rally to $4.24.
Conversely, if the price turns down from the resistance line, it will suggest that bears are selling on rallies. That could keep the price inside the pennant for a while longer. The bears will have to sink the price below the pennant if they want to signal a short-term trend reversal.
LDO/USDT 4-hour chart. Source: TradingView
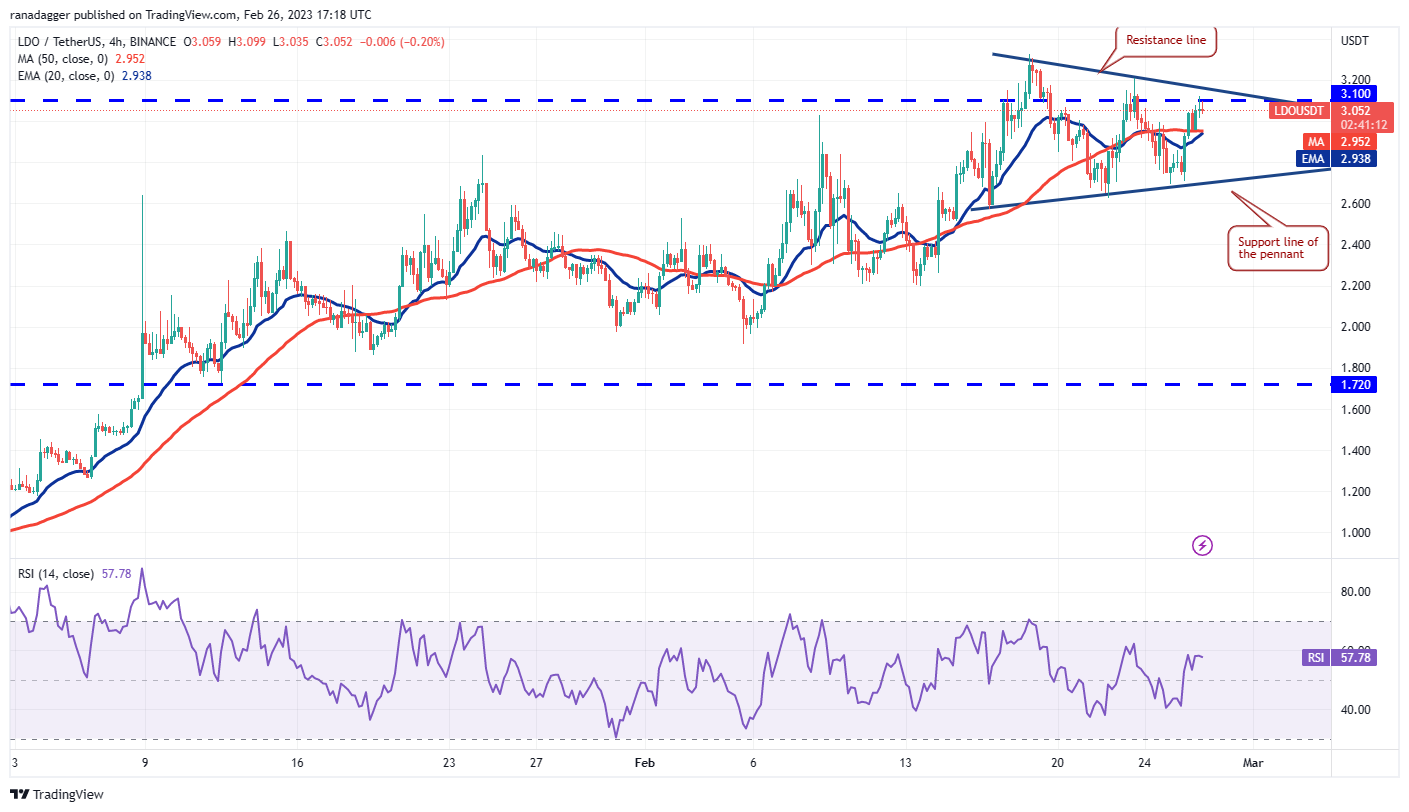
The strong bounce off the support line of the pennant indicates aggressive buying on dips. Buyers will have to overcome the obstacle at the resistance line to regain control. If they do that, the pair may resume its uptrend.
However, the bears are likely to have other plans as they will try to protect the resistance line. If the price turns down from this level, the state of equilibrium may continue for some more time.
A break below the pennant could attract profit-booking by short-term traders. That may tug the price to $2.20 and later to $2.
EGLD/USDT
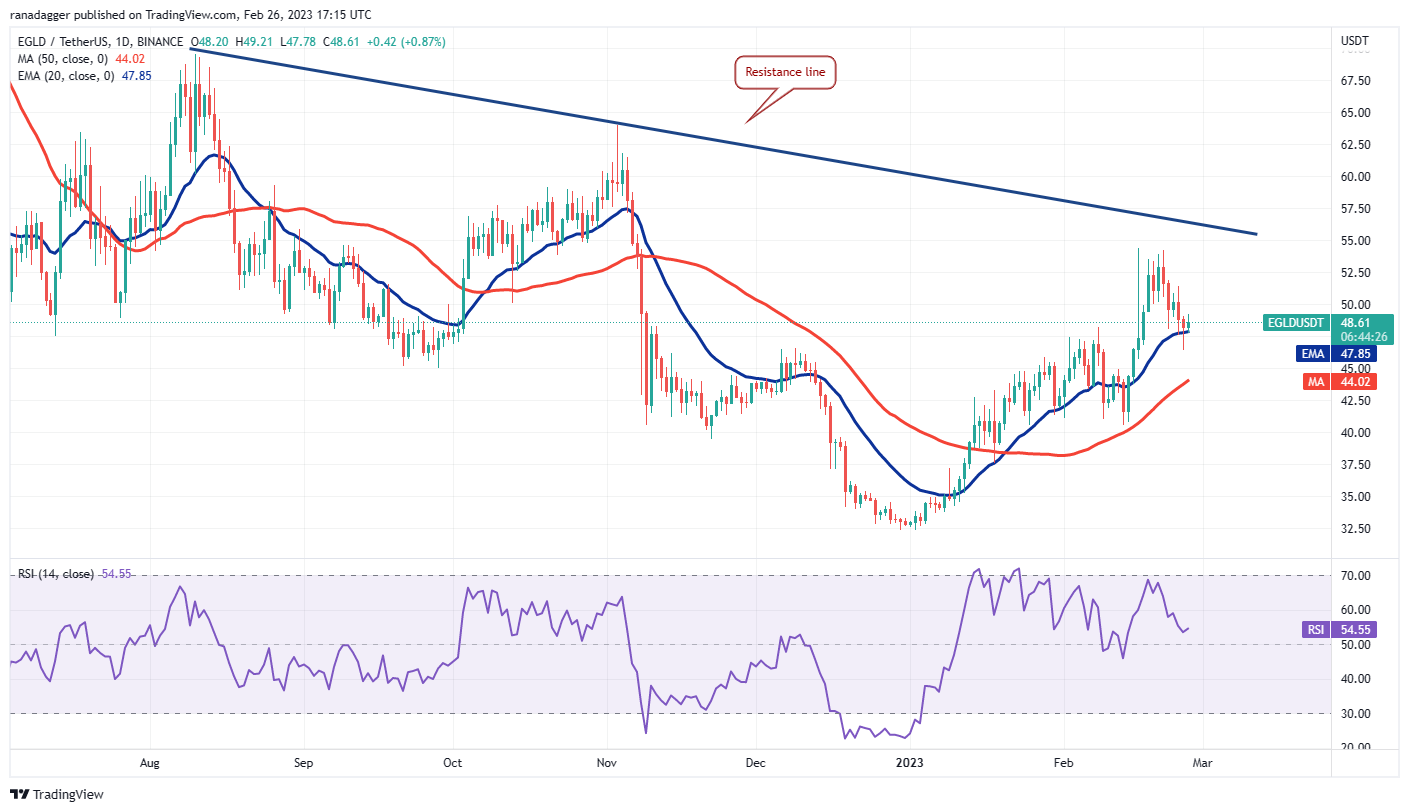
MultiversX turned down from the resistance line but an encouraging sign is that the bulls are trying to defend the 20-day EMA ($47).
EGLD/USDT daily chart. Source: TradingView
Both moving averages are sloping up and the RSI is above 54, indicating that buyers have a slight edge. The bulls will try to push the price toward the resistance line where they are again likely to face strong opposition from the bears.
This bullish view could invalidate in the near term if the price turns down and plummets below the 20-day EMA. That will indicate selling by the bears on every minor rally. The EGLD/USDT pair could then tumble to the 50-day SMA ($44) and later to $40.
EGLD/USDT 4-hour chart. Source: TradingView
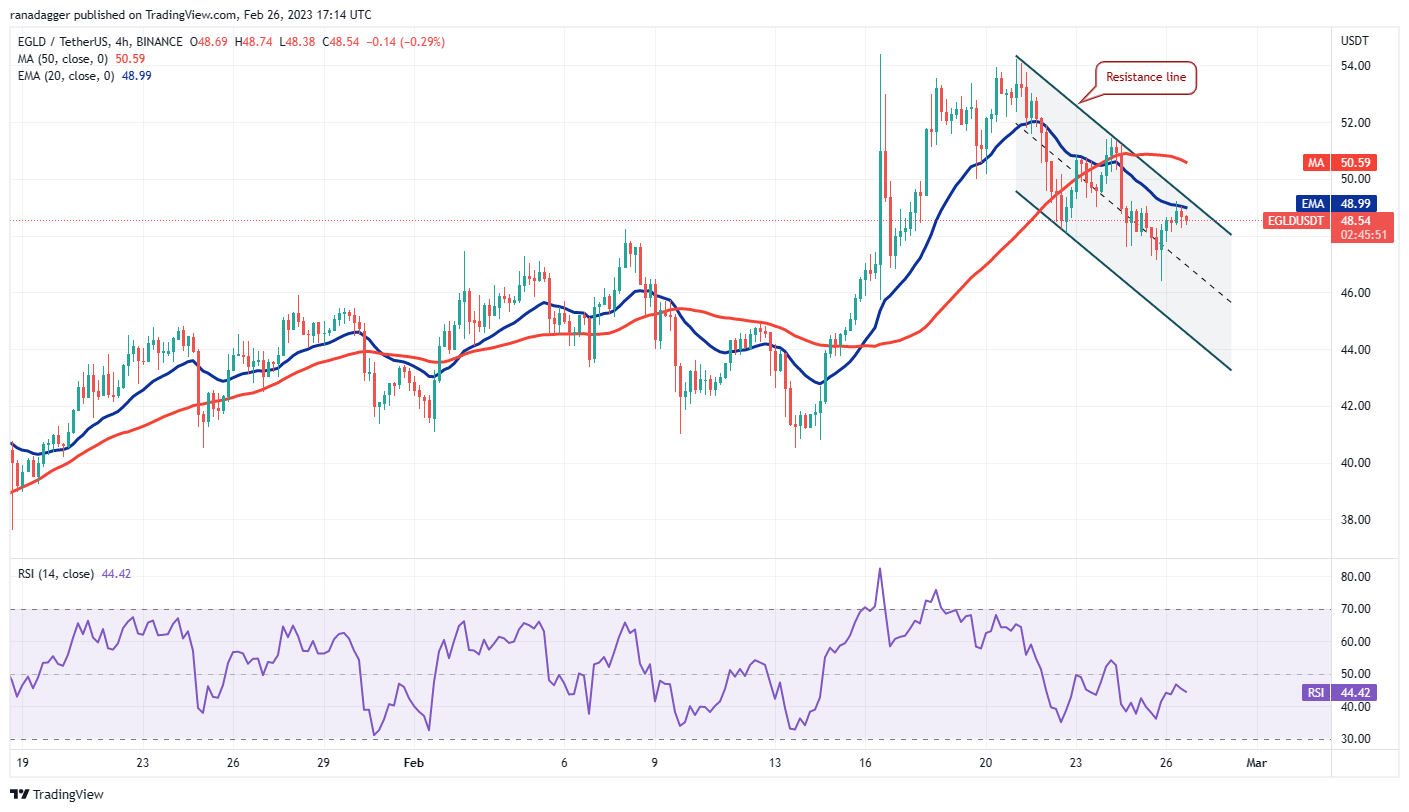
The four-hour chart shows that the price is falling inside a descending channel pattern. Buyers purchased at lower levels and have pushed the price to the resistance line of the channel. If this resistance gives way, the pair could rise to the 50-SMA and thereafter attempt a retest of the strong barrier at $54.
Contrarily, if the price turns down from the resistance line, it will suggest that the bears have not given up. That could result in a drop toward the support line of the channel.
THETA/USDT
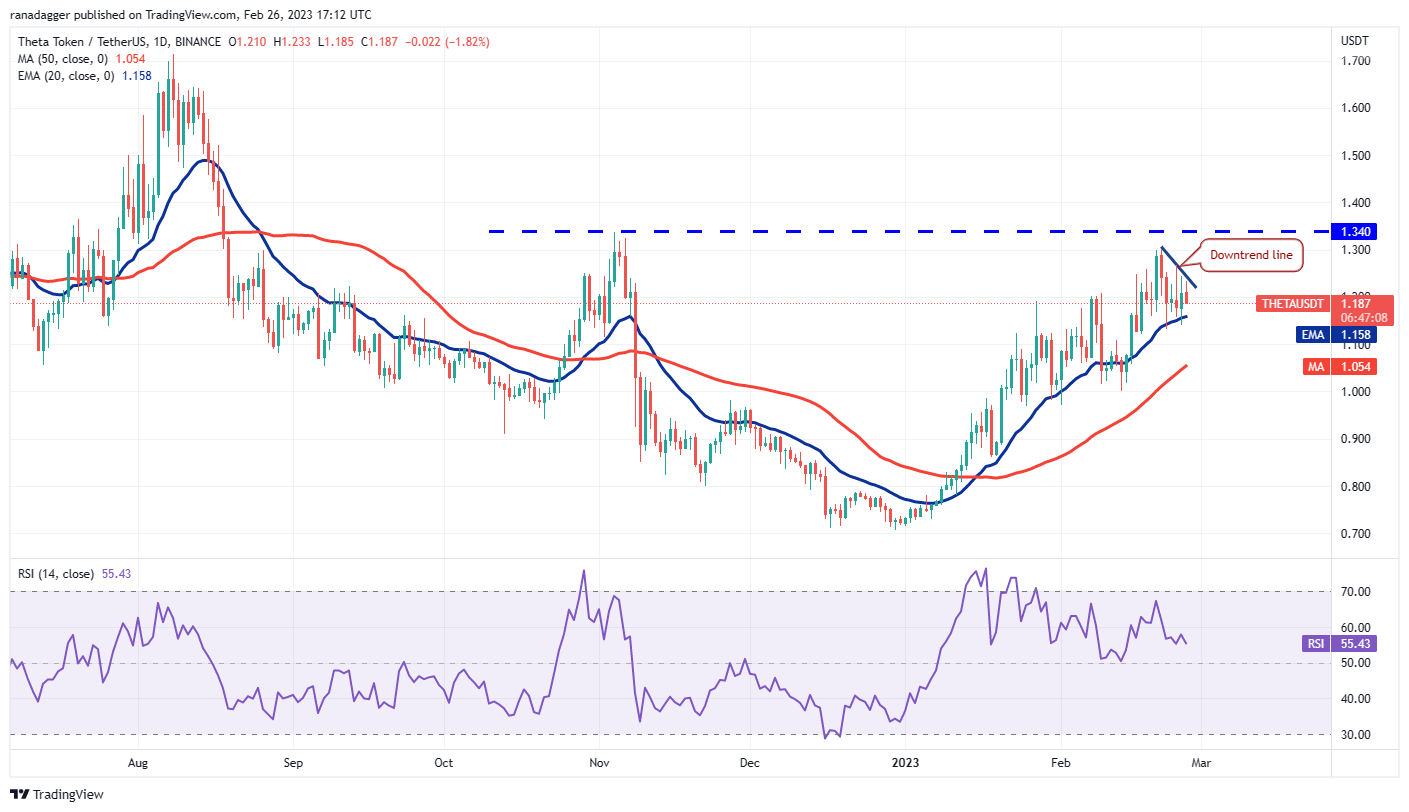
The bulls are trying to arrest Theta Network’s pullback at the 20-day EMA ($1.15). Both moving averages are sloping up and the RSI is in the positive territory, indicating advantage to the bulls.
THETA/USDT daily chart. Source: TradingView
If buyers thrust the price above the downtrend line, the THETA/USDT pair could climb to the overhead resistance at $1.34. This is a formidable resistance and a break above it could open the gates for a possible surge to $1.70.
Instead, if the price turns down and plunges below the 20-day EMA, it will suggest that the short-term bulls may be rushing to the exit. That may start a deeper correction to the 50-day SMA ($1.05) and then to the psychological support at $1.
THETA/USDT 4-hour chart. Source: TradingView
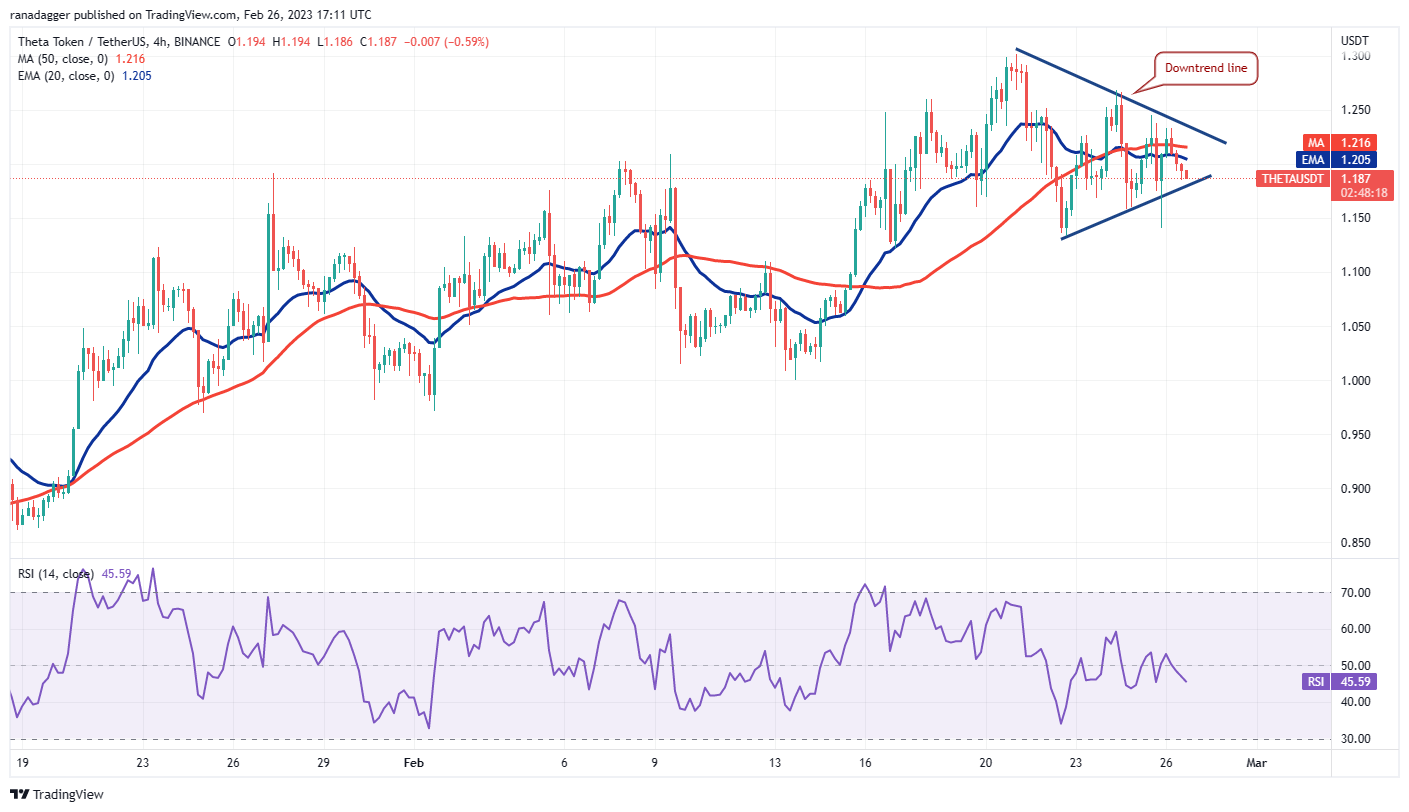
The four-hour chart shows the formation of a symmetrical triangle pattern. Both moving averages have flattened out and the RSI is oscillating near the center, indicating a balance between supply and demand.
A break below the triangle could tilt the short-term advantage in favor of the bears. The pair could first fall to $1.12 and then to $1.
If bulls want to prevent the decline, they will have to quickly propel the price above the triangle. That could start a journey to $1.27 and later to $1.30.
KLAY/USDT
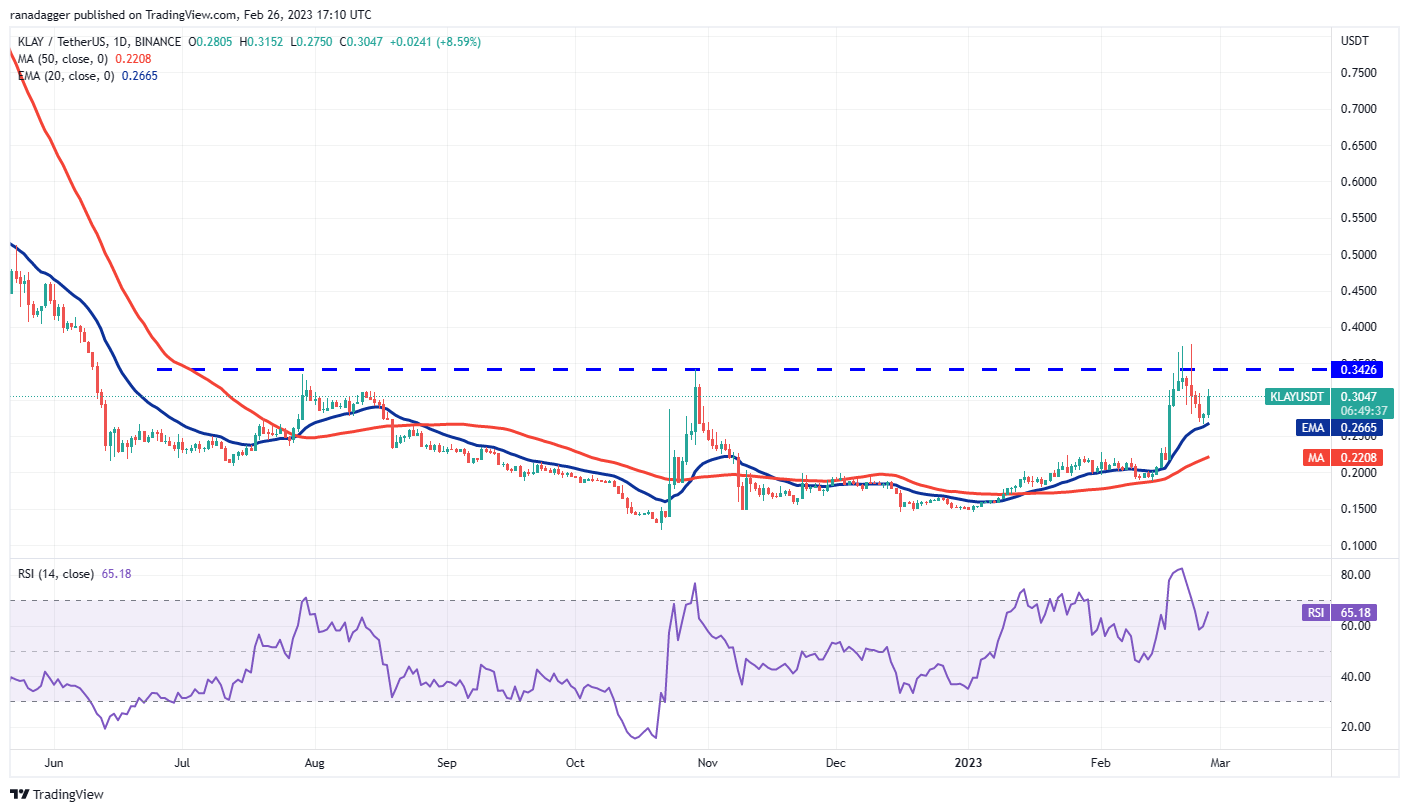
Klaytn (KLAY) is attempting to break out from a basing pattern. The price rebounded off the 20-day EMA ($0.26) on Feb. 25, indicating solid buying on dips.
KLAY/USDT daily chart. Source: TradingView
The bulls will try to pierce the overhead resistance at $0.34. If they do that, the KLAY/USDT pair could pick up momentum and soar to the psychological resistance at $0.50. Such a move will signal a potential trend change.
If the price turns down from $0.34, it will indicate that bears are fiercely protecting the level. That could again pull the price down to the 20-day EMA. A break below this level could indicate that the pair may spend some more time in the basing pattern.
KLAY/USDT 4-hour chart. Source: TradingView
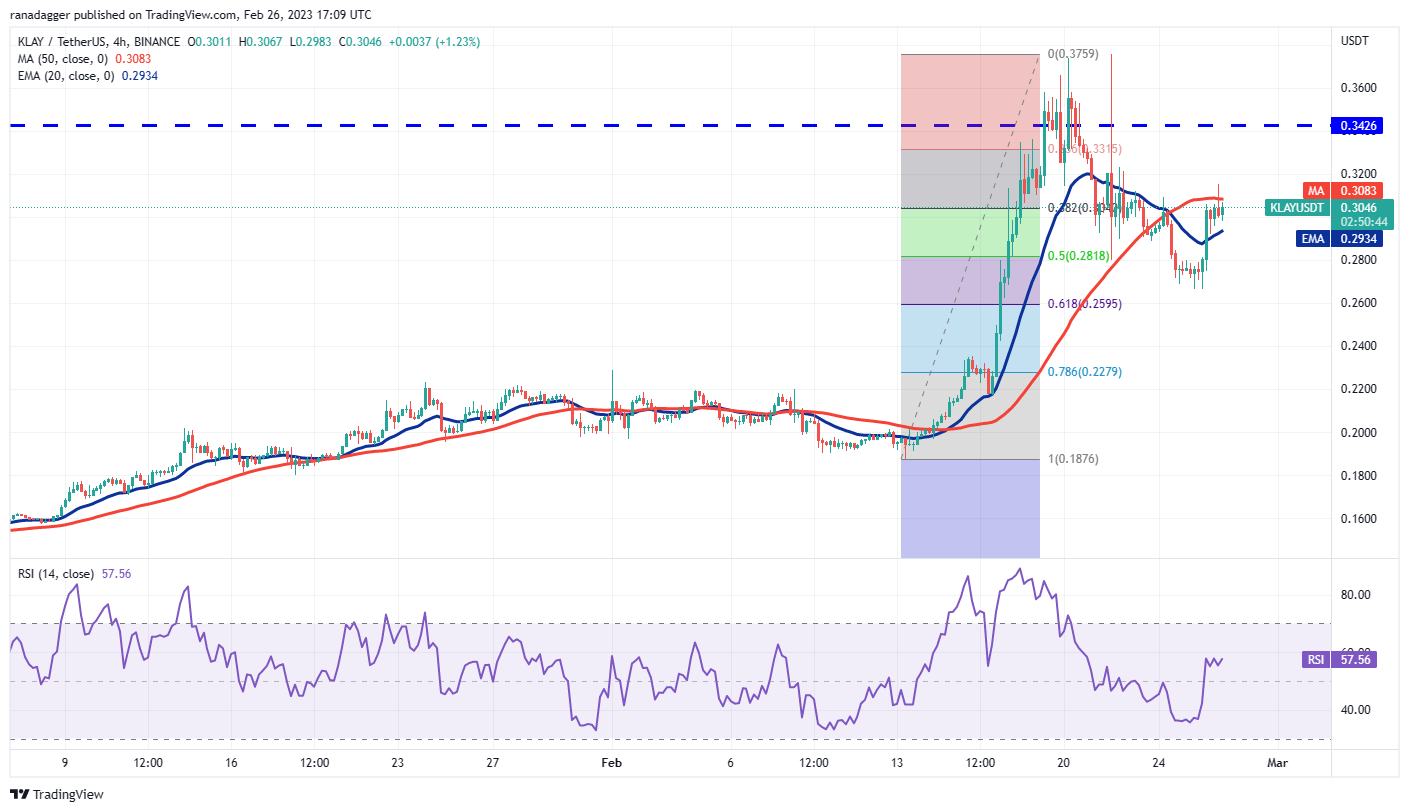
The bulls arrested the pullback near the 61.8% Fibonacci retracement of $0.26 and started a recovery. There is a minor resistance at $0.32 but if this level is crossed, the pair could attempt a rally to $0.34 and thereafter to $0.37.
On the other hand, if the price turns down from the overhead resistance, it will suggest that bears are selling on rallies. That may enhance the prospects of a break below $0.26. If that happens, the pair may slide to $0.22.