U.S. crypto trading nearly doubles to 15% in one year: Here’s how

ambcryptoPublished on 2026-03-18Last updated on 2026-03-18

Abstract

U.S. crypto trading activity has surged, with its share of global spot trading nearly doubling from 8% to 15% within a year. This growth reflects a shift toward platforms offering deeper liquidity and reduced price impact for large trades. While offshore exchanges still lead in volume, U.S. platforms are gaining ground, especially after regulatory approvals for derivatives market entrants like Coinbase. On-chain data shows negative Bitcoin exchange flows, indicating accumulation and reduced sell-side pressure. Institutional demand via U.S. Spot Bitcoin ETFs continues to support the market with consistent inflows. However, derivatives market analysis reveals significant liquidation clusters between $80K–$90K and $55K–$60K, which may dictate Bitcoin’s near-term price movement. Market sentiment, though still in “Fear” territory, is improving from earlier extremes. Long-term holder activity is near a four-year high, suggesting growing confidence. These signals collectively point to a potential sustained market recovery with buyers gradually taking control.

The United States has recently emerged as a more significant player in the digital asset economy.

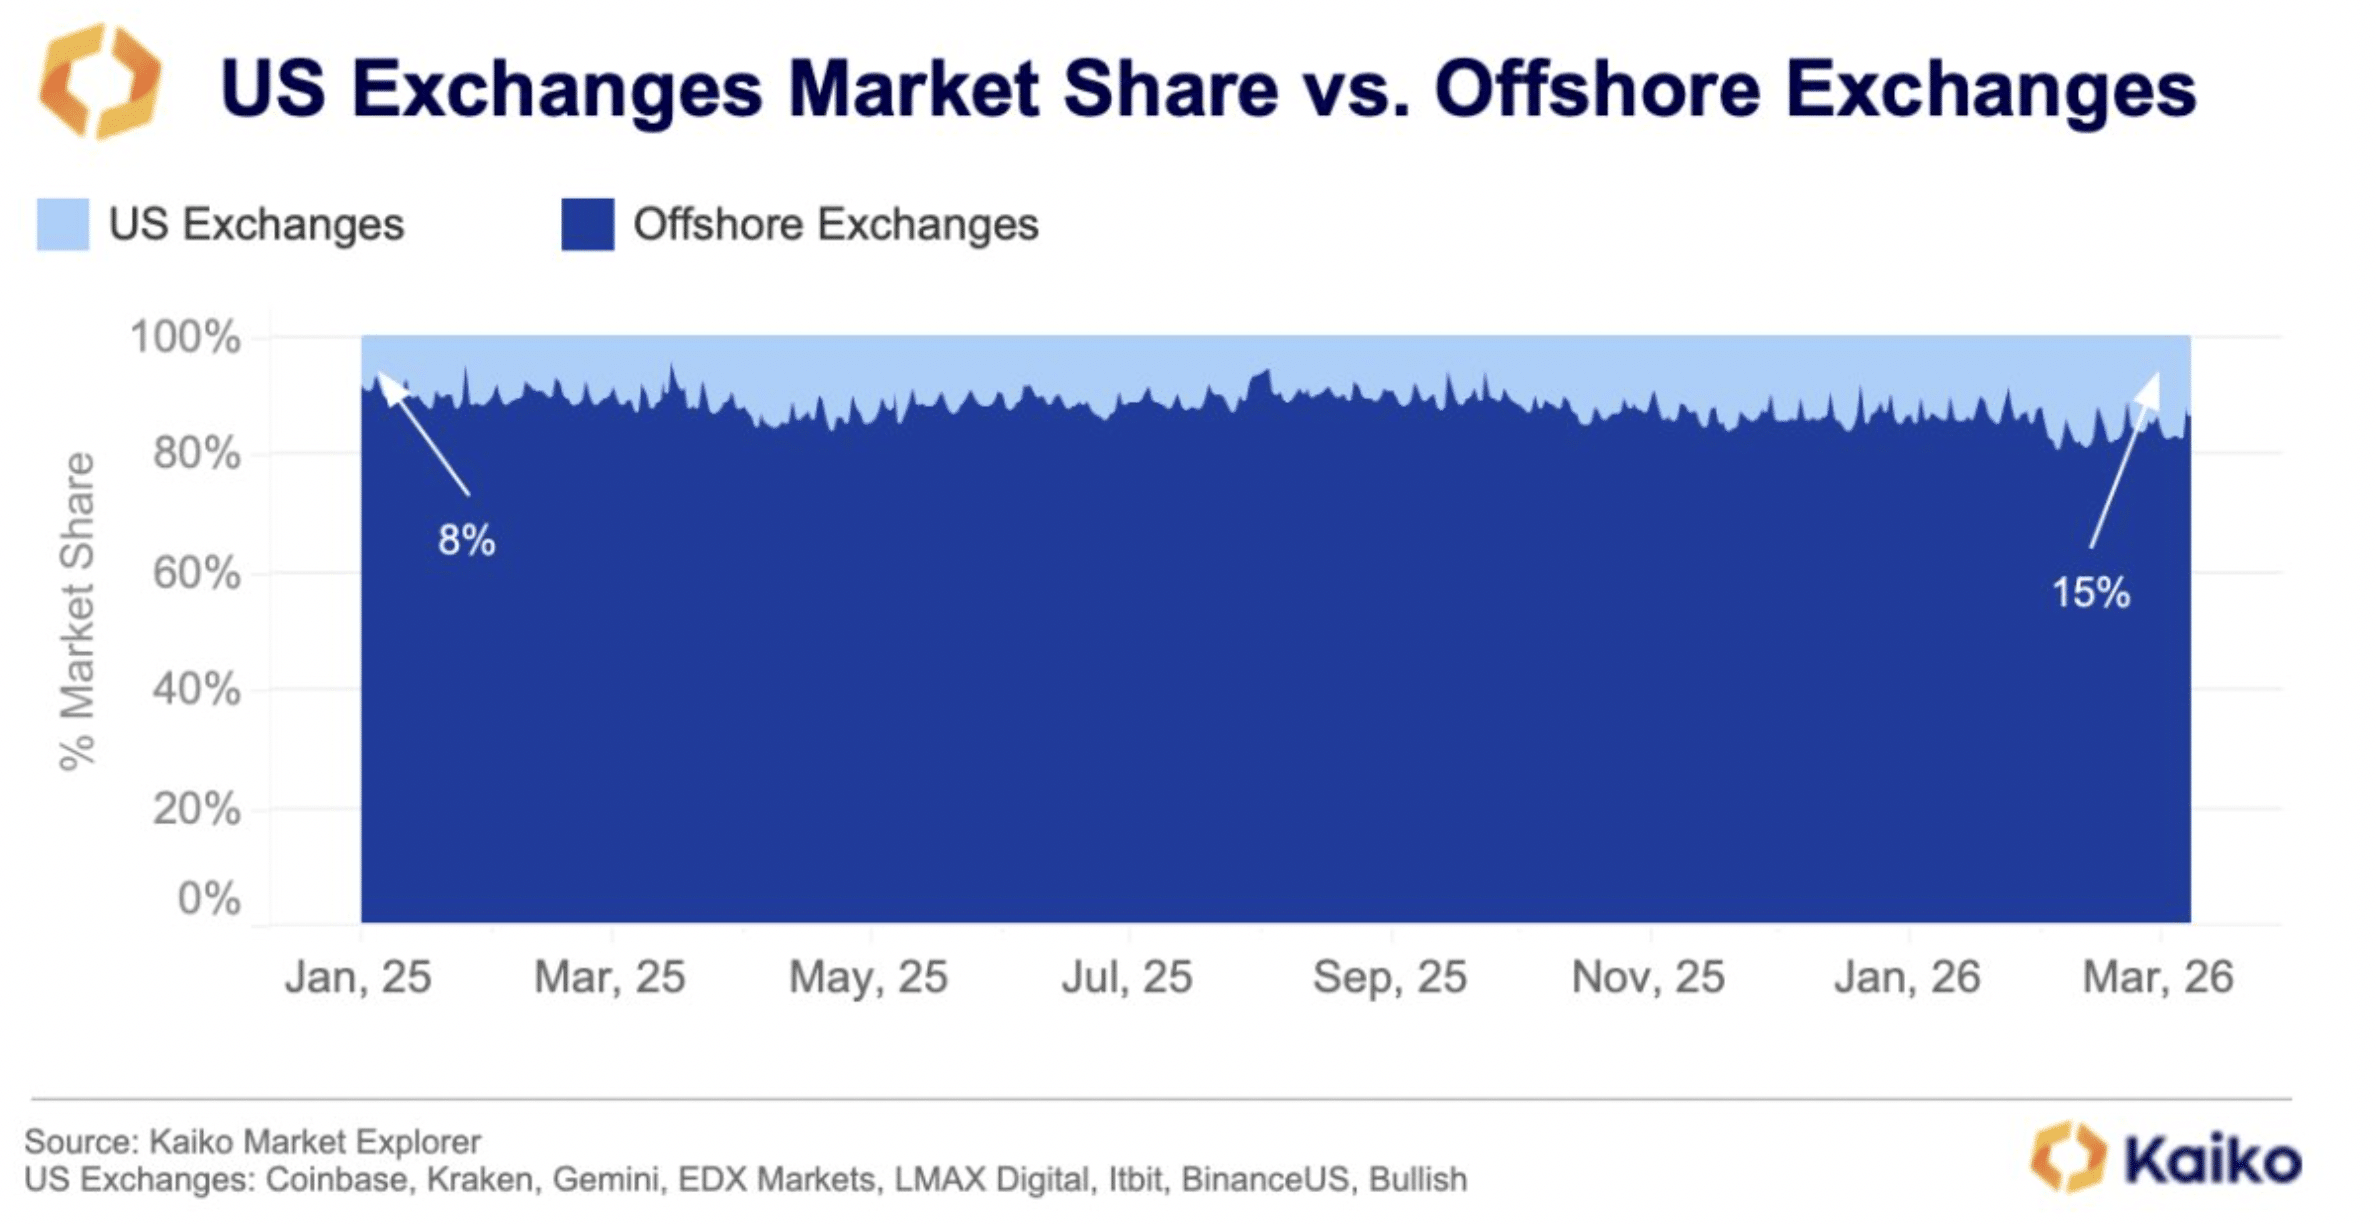
Data from Kaiko Research shows that the share of global spot trading on U.S. exchanges nearly doubled in a year, climbing from 8% to 15%. This growth reflects more than just higher trading volumes.
Source: Kaiko/X

It indicates that traders are increasingly moving toward platforms that offer deeper liquidity, meaning large trades can be executed with less impact on prices.

While offshore exchanges still handle the largest overall trading volumes, market depth is now improving faster on U.S. platforms. Notably, this shift is increasing competition between offshore exchanges and the growing U.S. crypto infrastructure.

With the Commodity Futures Trading Commission (CFTC) approving perpetual futures markets for firms like Coinbase in 2025, the U.S. is now challenging offshore dominance in derivatives trading.

On-chain metrics and ETF analysis

While headlines highlight Bitcoin [BTC] trading near $74,000, the bigger story lies in what’s happening behind the scenes.

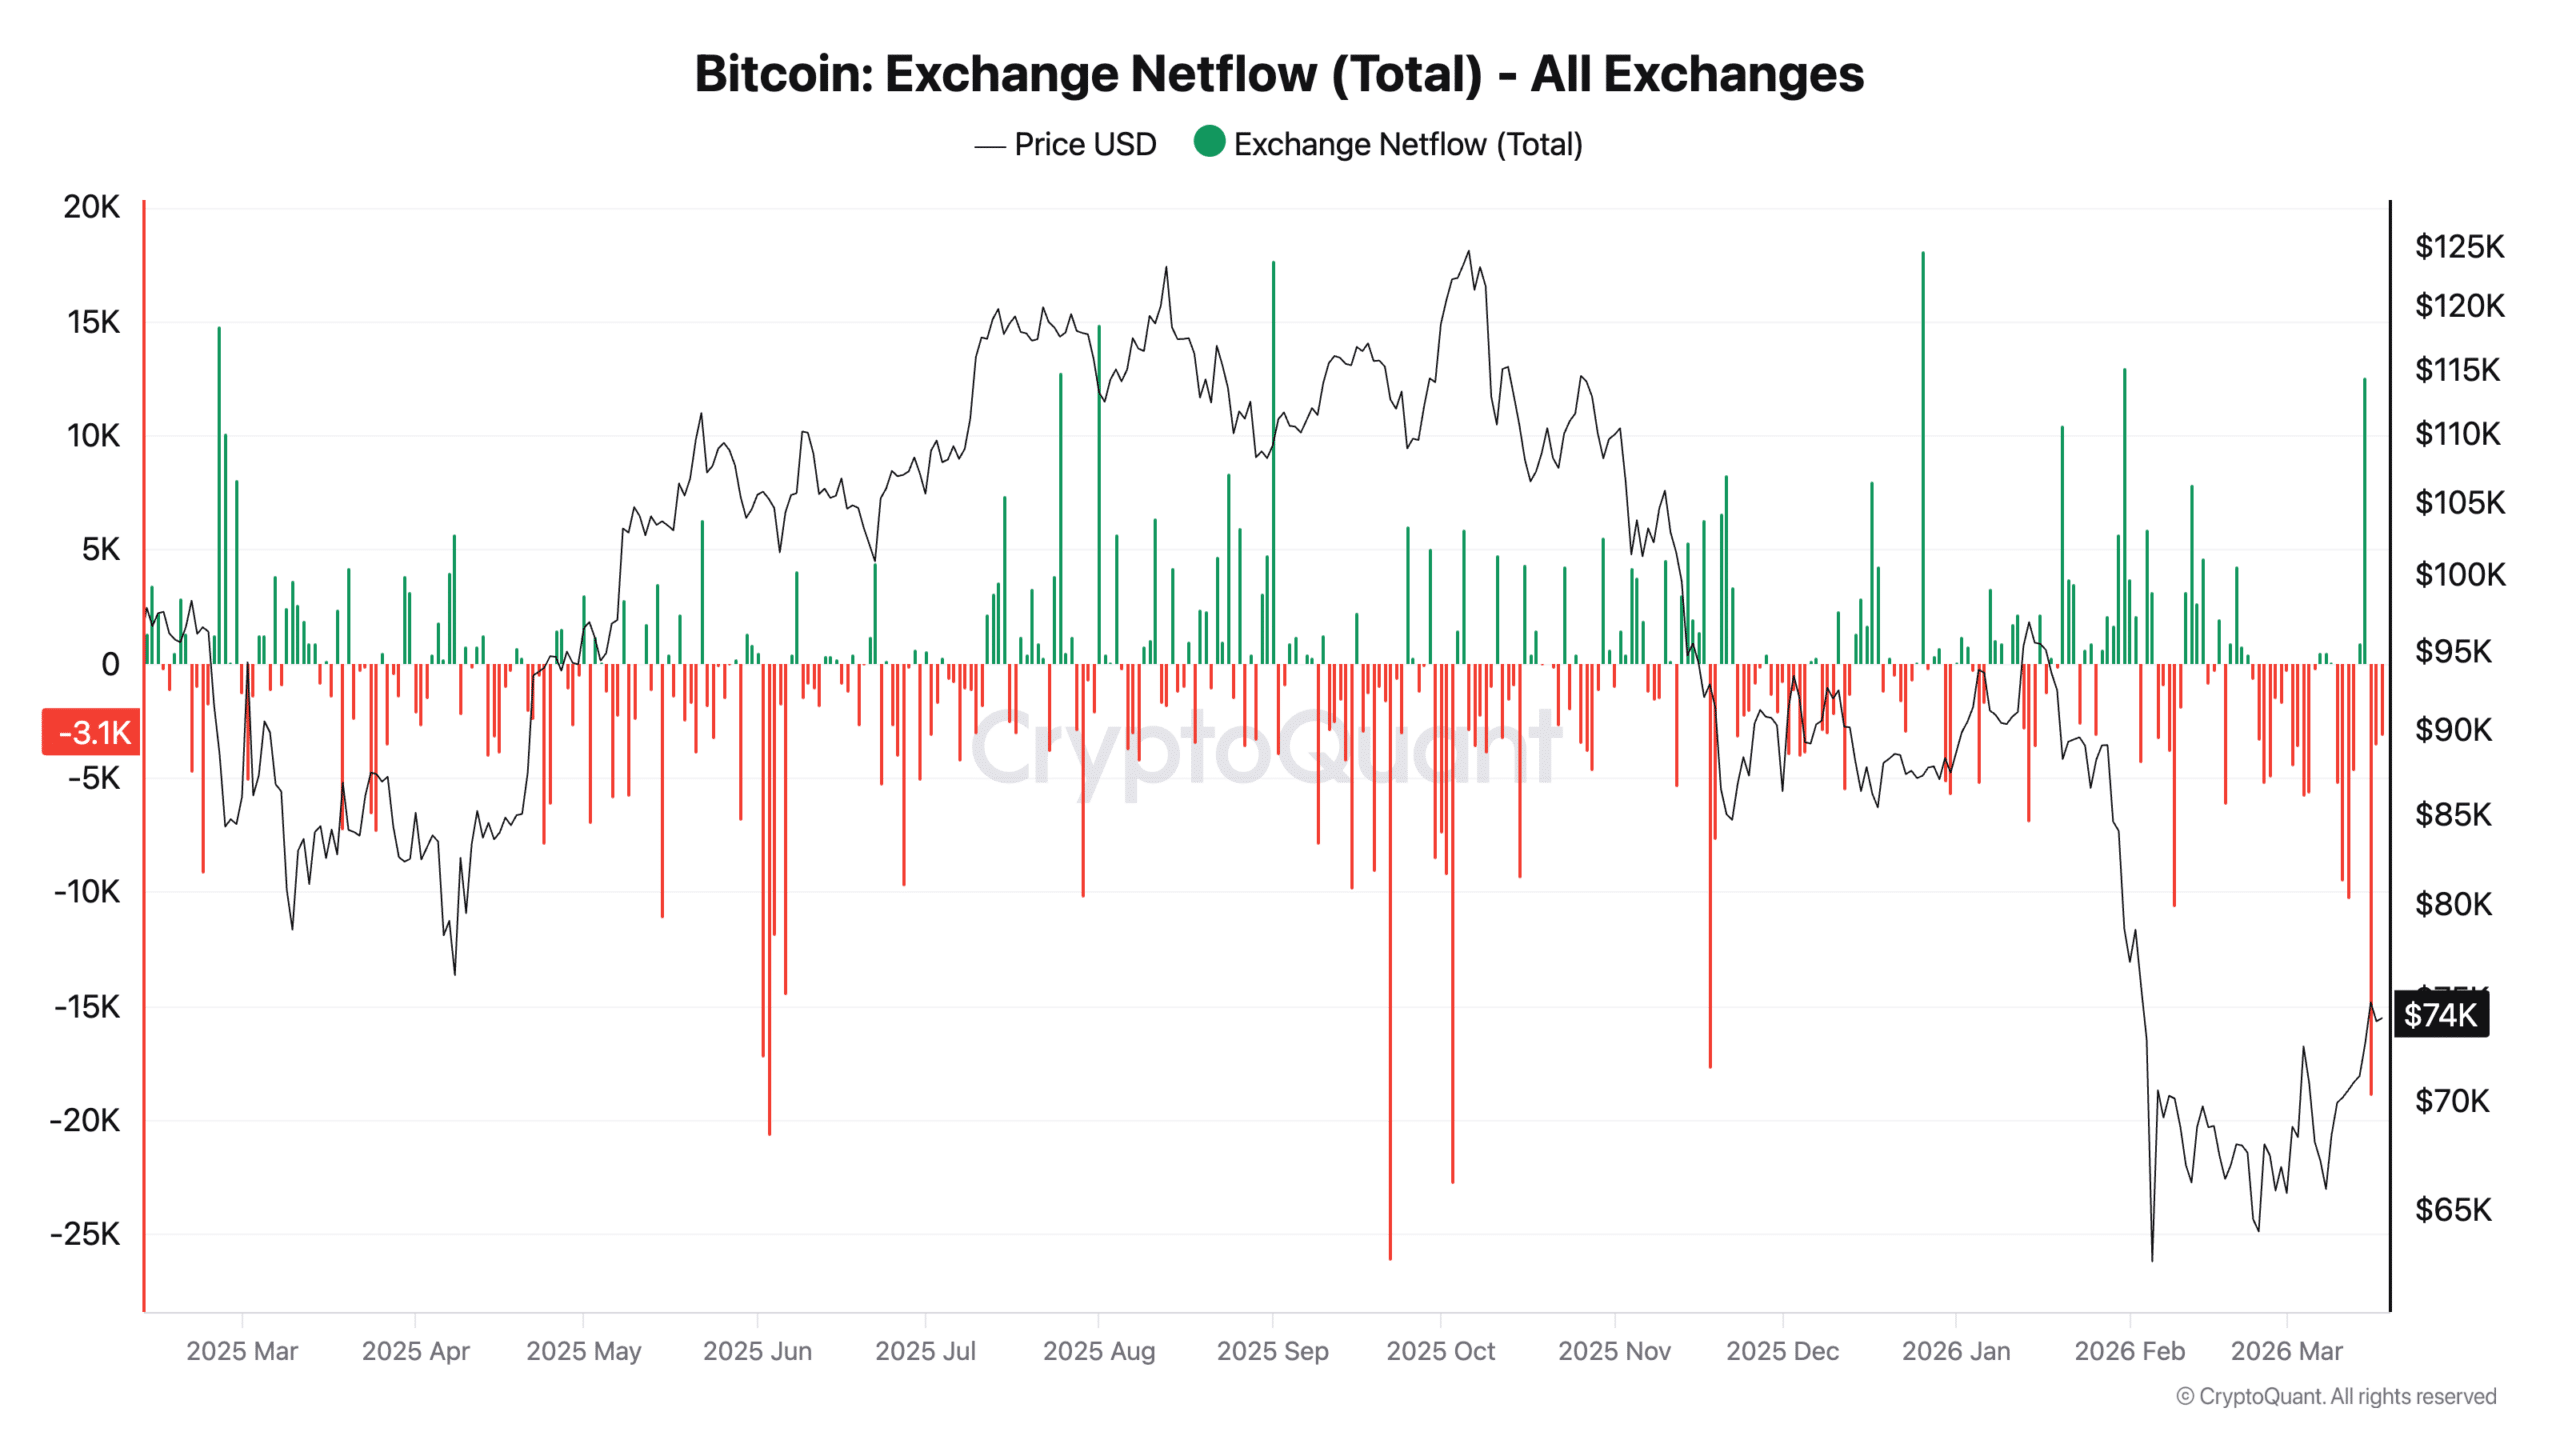
Recent data from CryptoQuant shows that Bitcoin exchange netflows are around –3.1K BTC, meaning more coins are leaving exchanges than entering them.
Source: CryptoQuant

When investors move Bitcoin off exchanges and into private wallets or cold storage, it usually signals long-term holding rather than short-term trading. This also reduces the amount of Bitcoin available for immediate selling, which can tighten supply and make prices react more strongly when new buyers enter the market.

Institutional demand has been a key driver of this trend. Since the 9th of March, U.S. Spot Bitcoin ETFs have consistently recorded inflows, including about $199.4 million on the 17th of March alone. This steady demand supports the market by absorbing selling pressure that cautious retail traders, still wary after recent volatility, are unwilling to take on.

Liquidation clusters would decide Bitcoin’s next move

However, the derivatives market tells a more complicated story.
Source: Glassnode

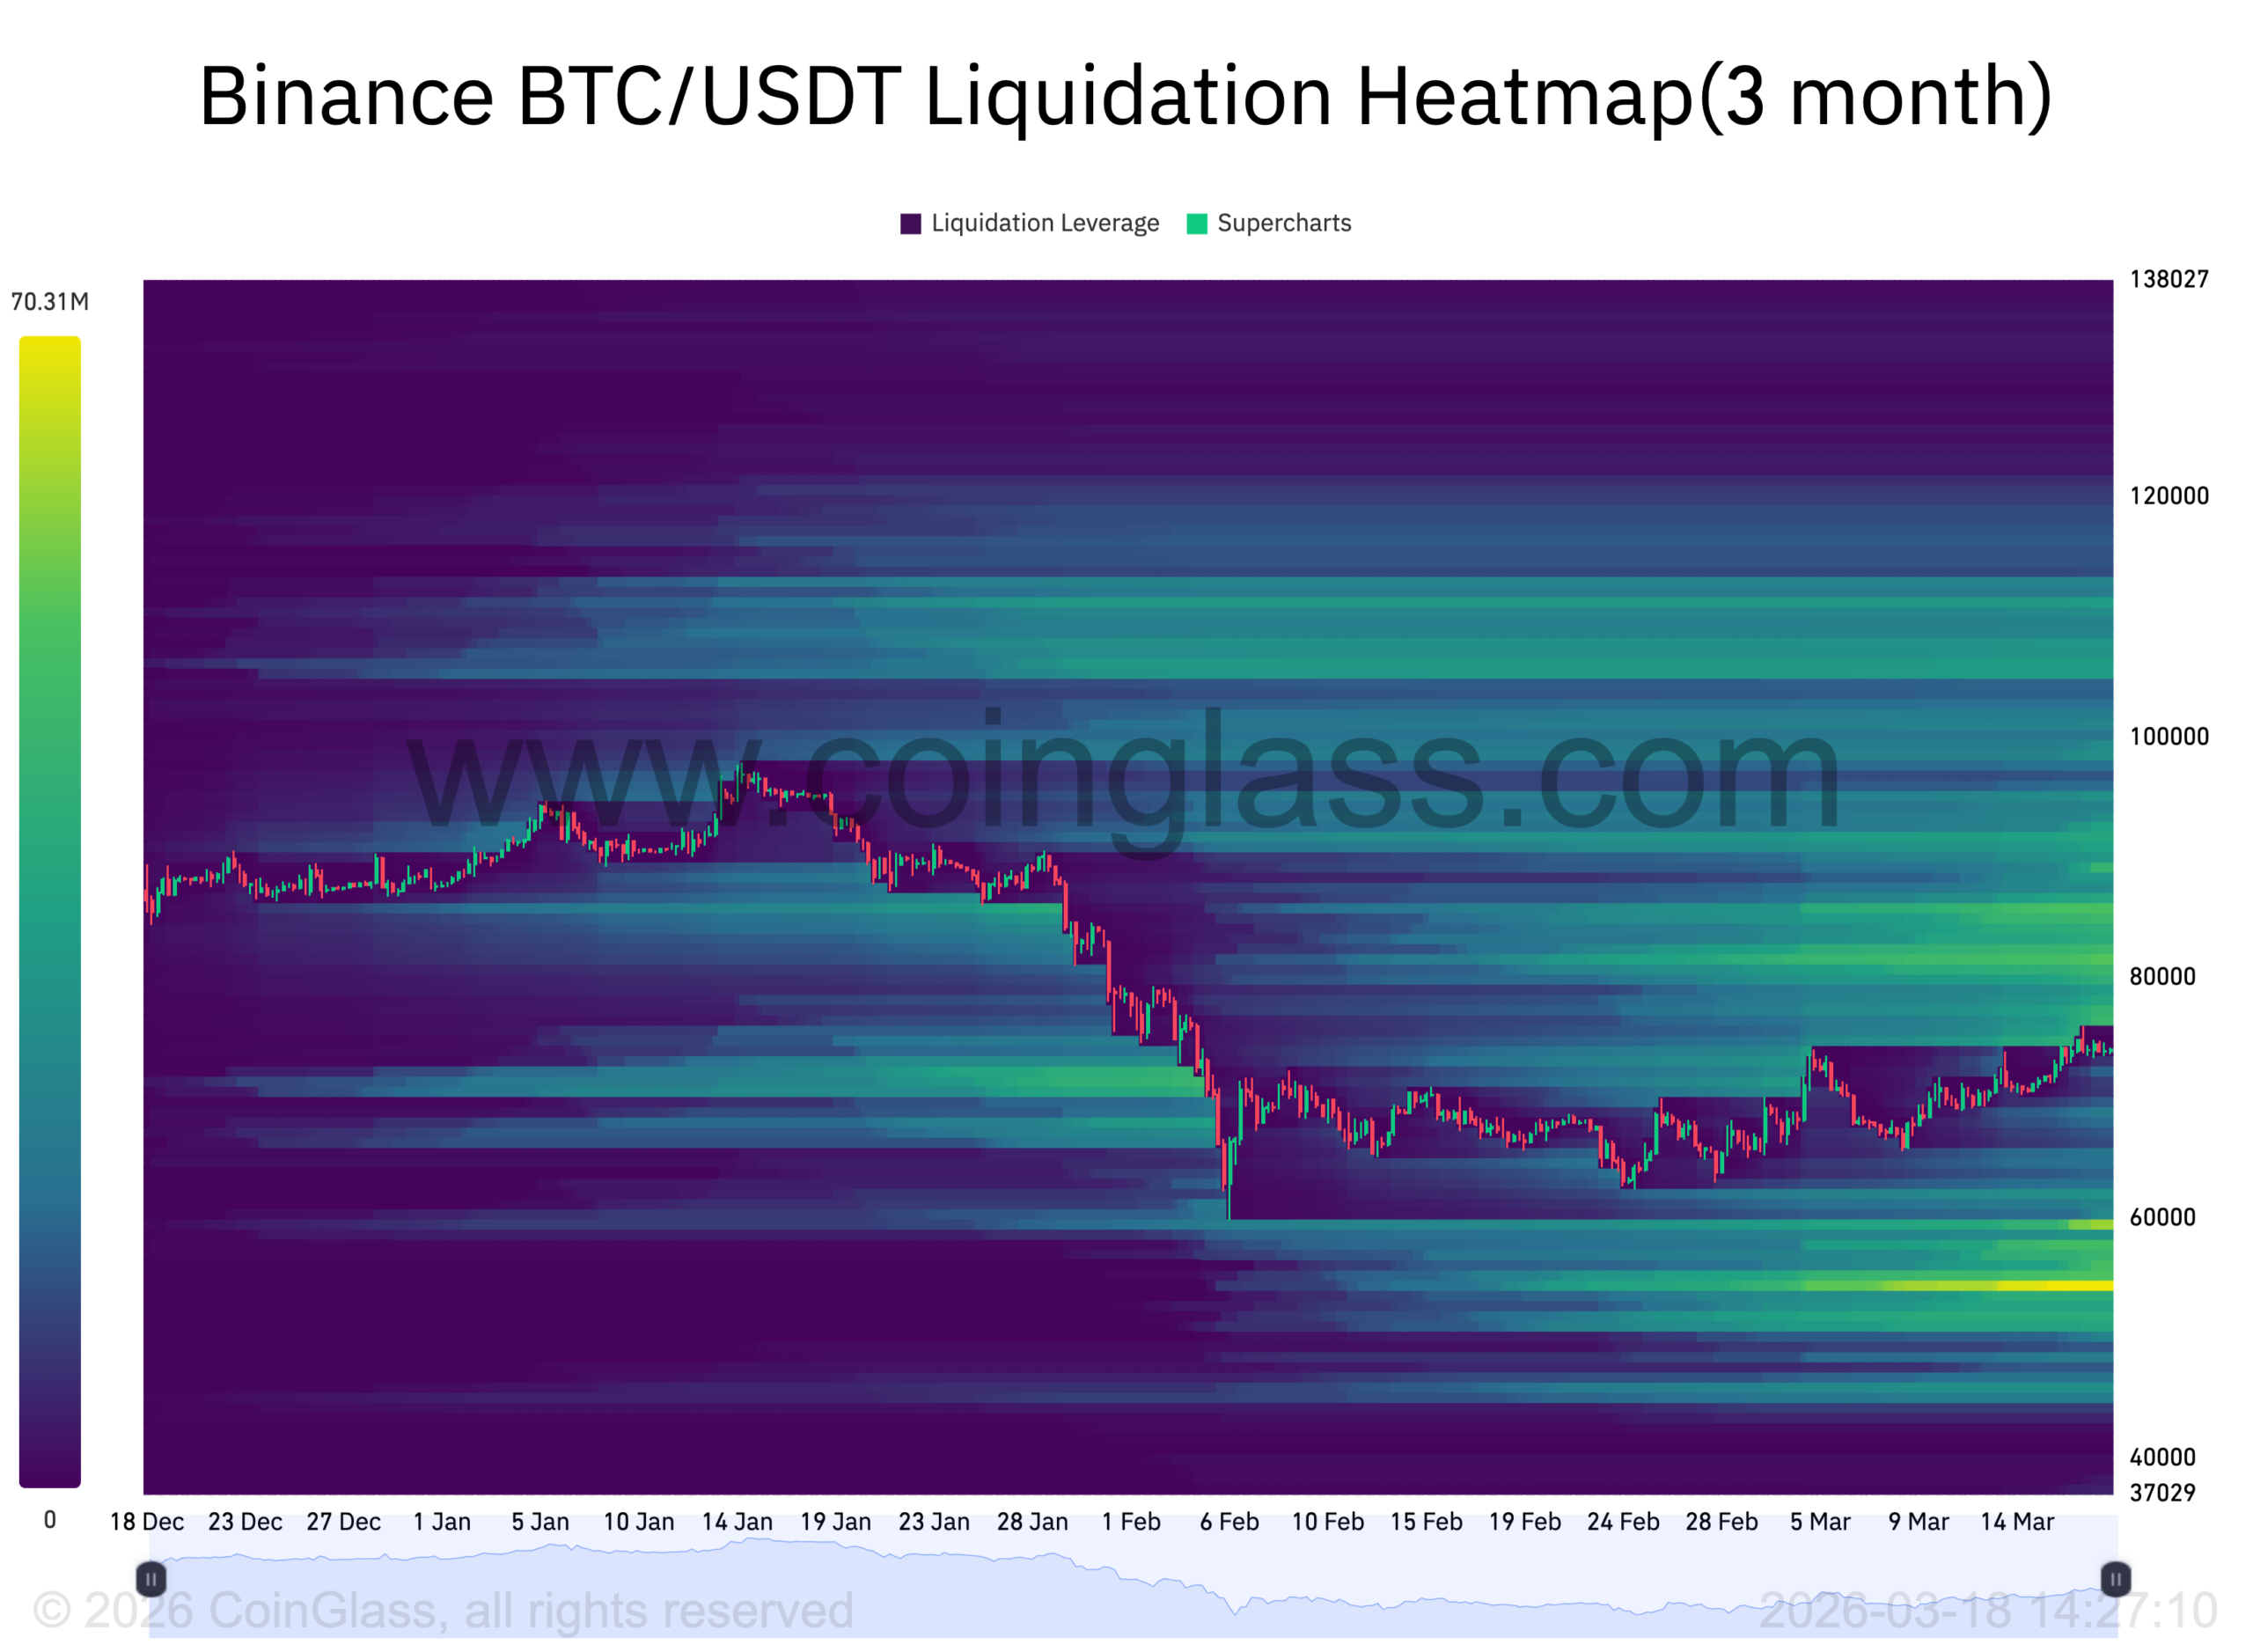
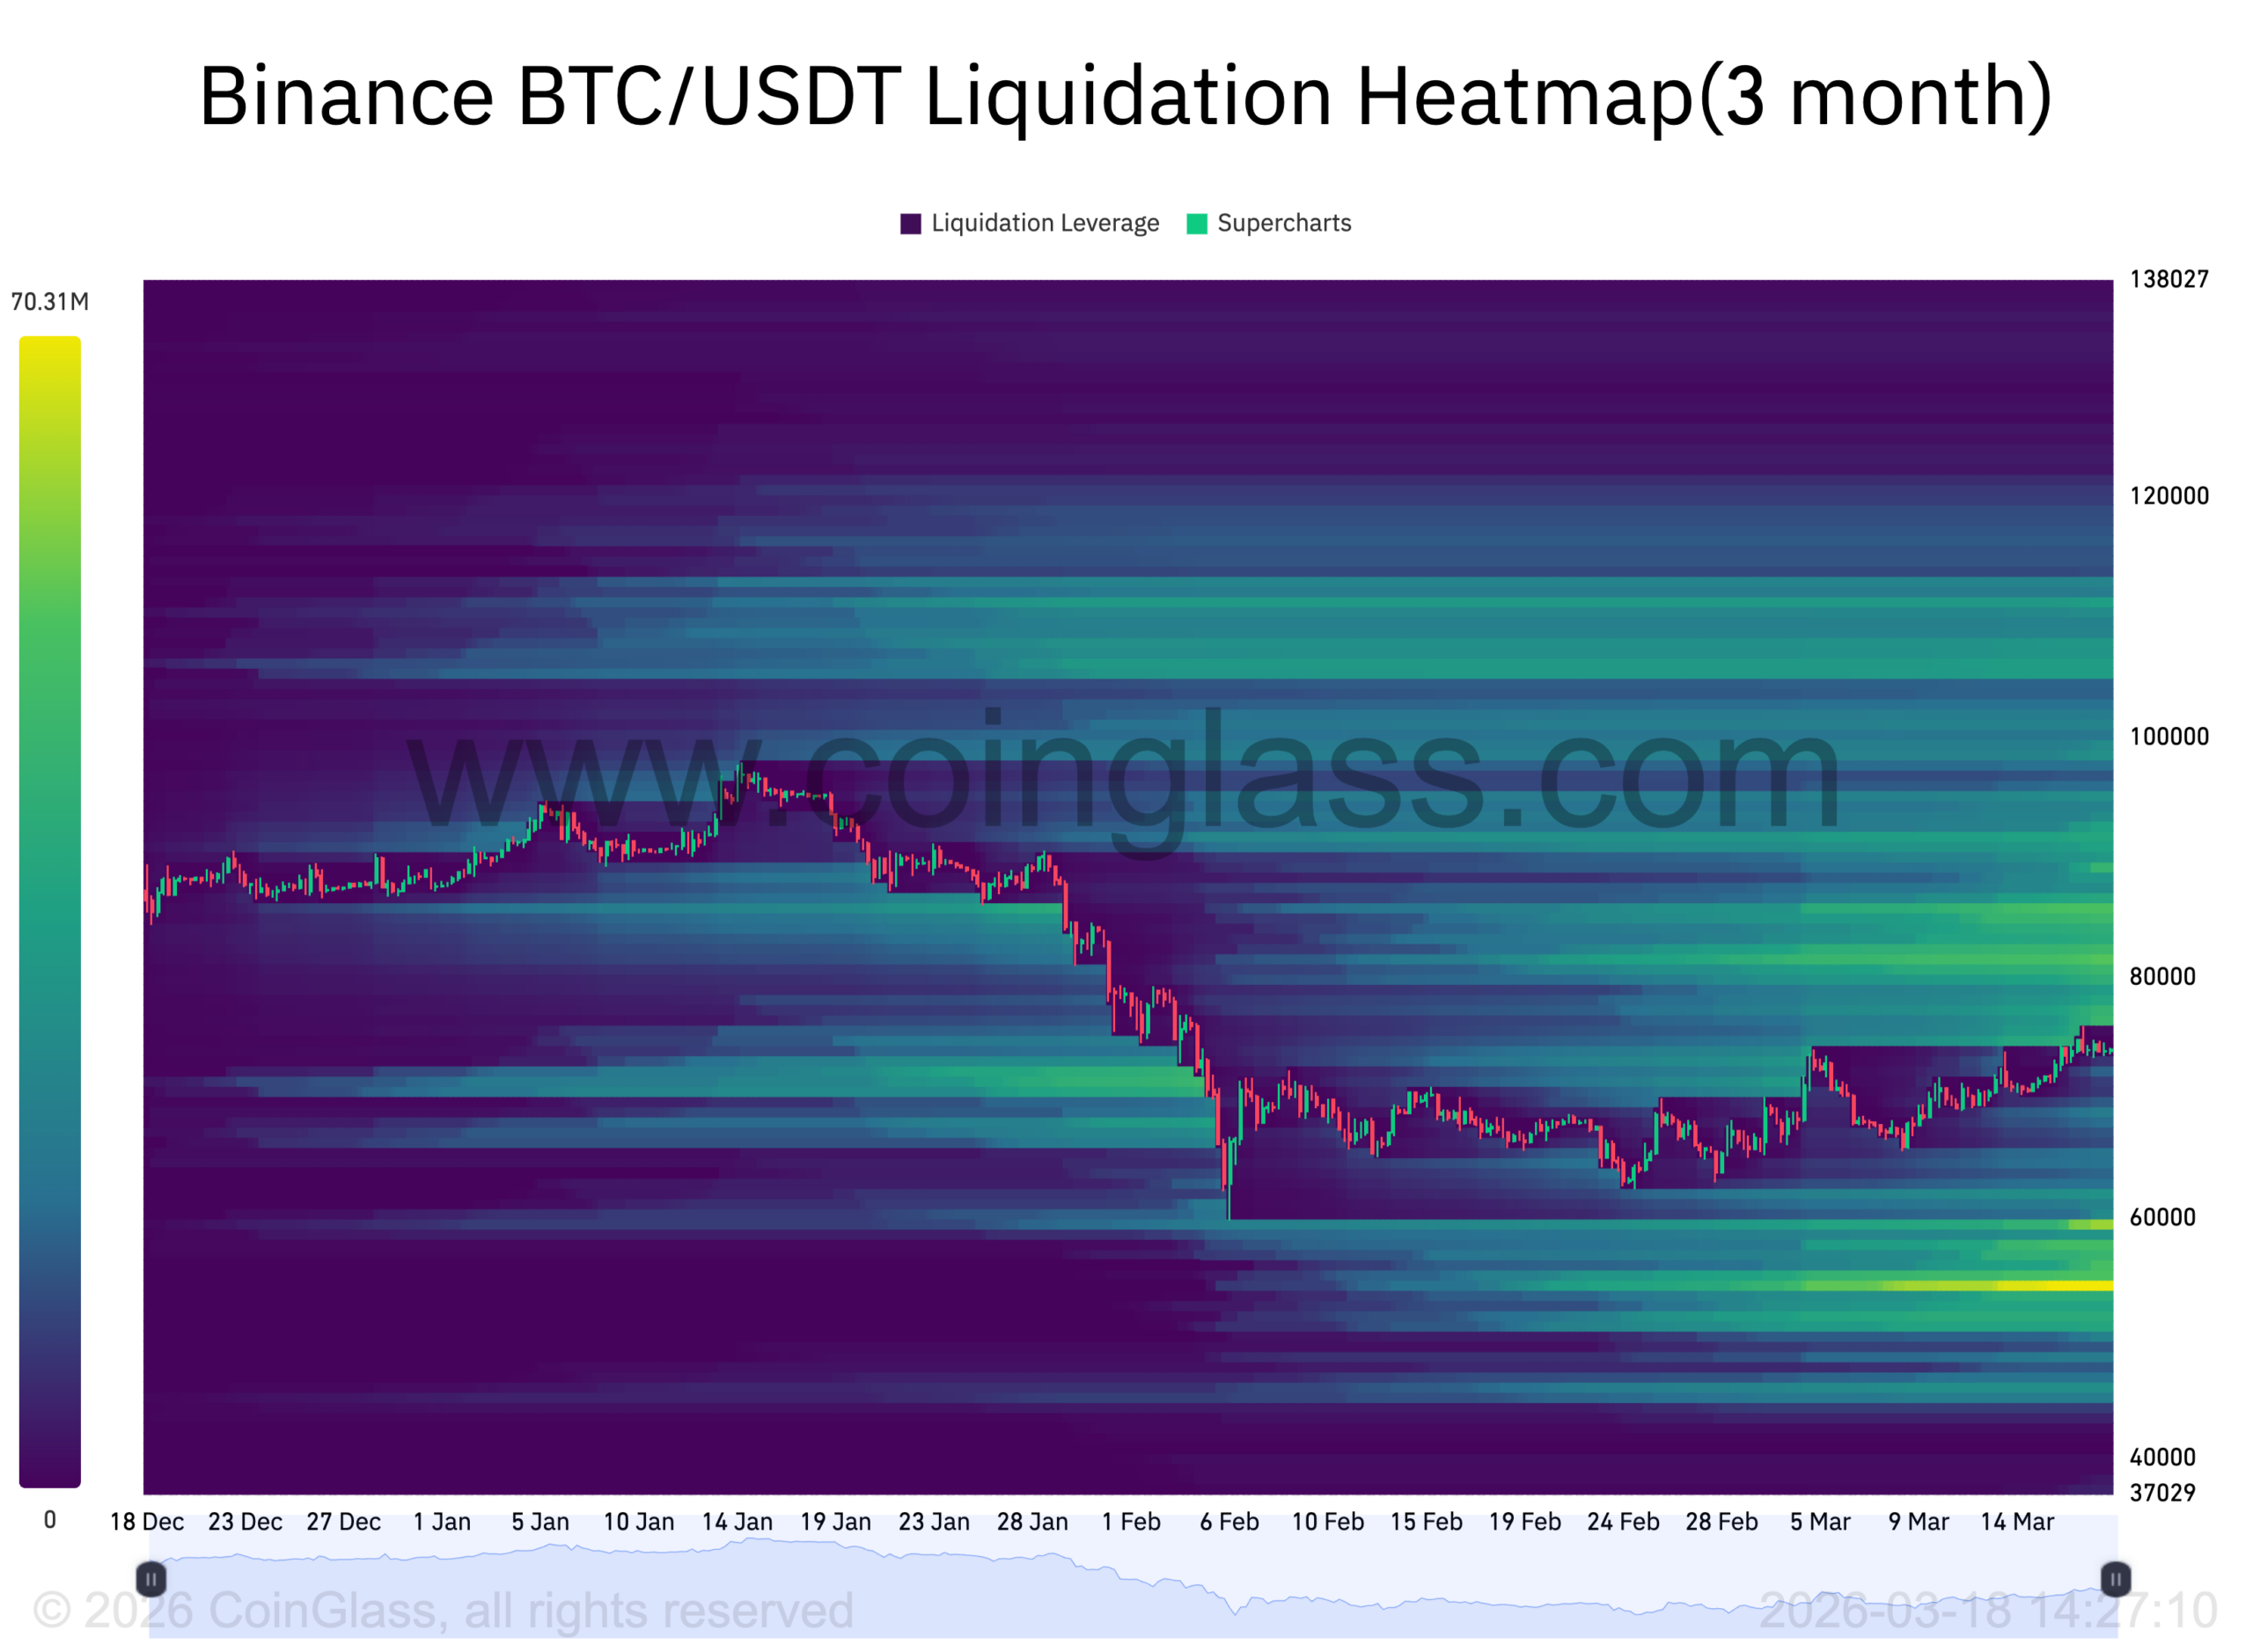
Glassnode’s liquidation heatmap for the Binance BTC/USDT pair reveals large clusters of leveraged positions between $80,000 and $90,000, which could act as liquidity magnets and trigger a short squeeze if Bitcoin moves higher.

This could force traders who bet against the price to buy back Bitcoin and potentially push the price higher. However, it’s important to note that a major liquidation zone around $55,000–$60,000 could provide support if the market declines.

Market in fear or greed?

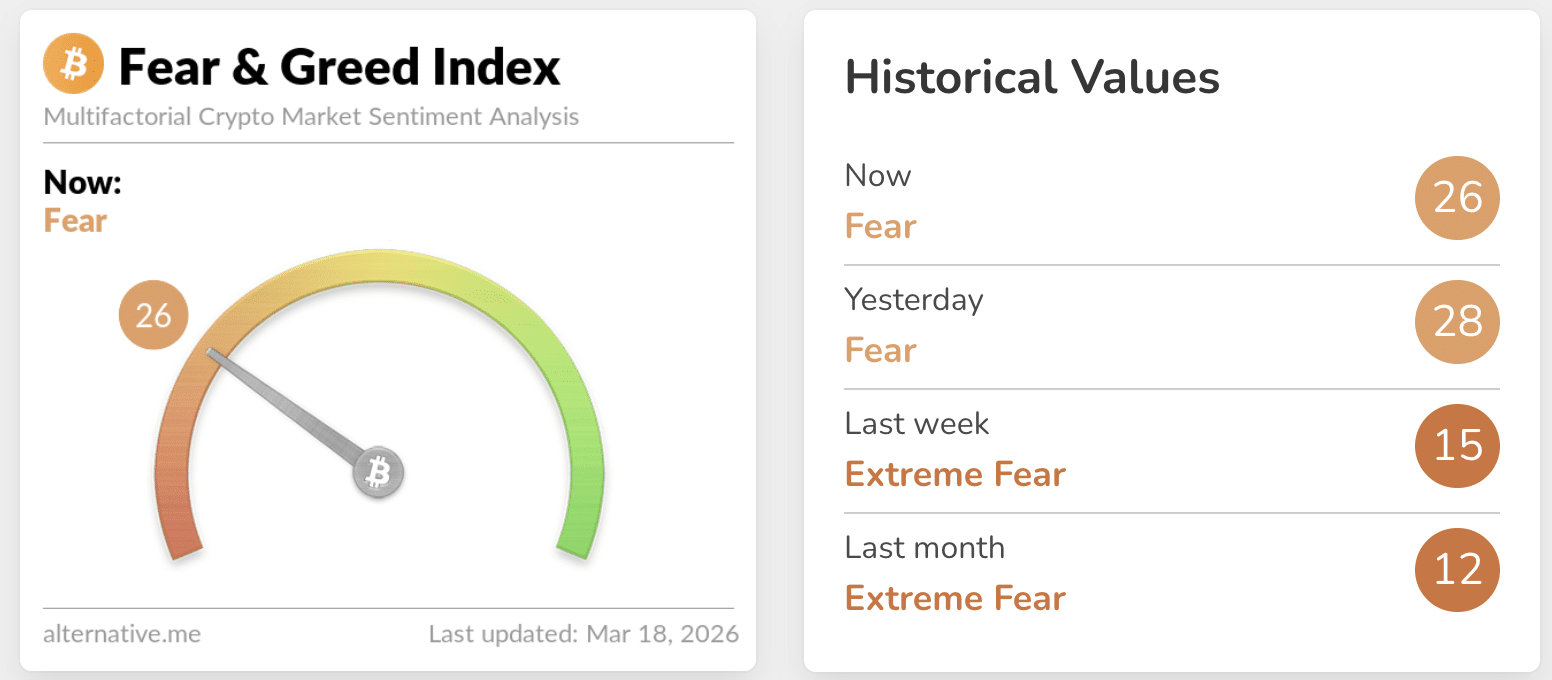
At the same time, market sentiment is slowly improving. The Crypto Fear & Greed Index has moved out of the “Extreme Fear” level and sat in the Fear zone at 26 at press time.
Source: Alternative

While investors are still cautious, this marks a recovery from the deep market anxiety seen in February.

Confirming the sentiment, recent analysis by AMBCrypto shows that long-term Bitcoin holders are once again playing a major role in shaping the market. In fact, the current level of long-term holding is close to a four-year high, similar to the accumulation phase seen in late 2022.

Several market signals also aligned on the 17th of March when Bitcoin traded around $74,057, suggesting that bearish pressure may be weakening.

Taken together, these signals suggest that the current market move may be more than just a temporary rebound. After months of uncertainty, the market balance may finally be shifting, with buyers slowly gaining control.


Final Summary

  • Traders are increasingly moving to platforms with deeper liquidity, where large trades can happen with less price impact.
  • Large liquidation clusters between $80K–$90K and $55K–$60K could influence Bitcoin’s next major move.


Trending Cryptos

Related Questions

QWhat was the increase in the U.S. share of global crypto spot trading volume in one year, according to Kaiko Research?

AThe U.S. share of global spot trading on crypto exchanges nearly doubled, climbing from 8% to 15% in one year.

QWhat does a negative Bitcoin exchange flow of -3.1K BTC indicate about investor behavior?

AA negative netflow of -3.1K BTC indicates that more coins are being withdrawn from exchanges than deposited, which typically signals long-term holding and reduces the immediate selling supply.

QHow are U.S. Spot Bitcoin ETFs influencing the market, based on the data from March?

AU.S. Spot Bitcoin ETFs have been a key driver of institutional demand, recording consistent inflows since March 9th, including approximately $199.4 million on March 17th alone, which helps absorb selling pressure.

QAccording to Glassnode's liquidation heatmap, what are the two key price ranges that could significantly impact Bitcoin's price movement?

AThe two key liquidation clusters are between $80,000–$90,000, which could trigger a short squeeze, and $55,000–$60,000, which could provide support if the market declines.

QWhat does the Crypto Fear & Greed Index reading of 26 indicate about current market sentiment?

AA reading of 26 places the market in the 'Fear' zone, indicating that investors are still cautious but that sentiment has improved from the 'Extreme Fear' levels seen in February.

Related Reads

Within Strategy's Framework, STRC's Dividend Yield Remains at 12% as Share Price Stays Below Par Value

Michael Saylor, Executive Chairman of Strategy (MSTR), confirmed that the dividend rate for its STRC perpetual preferred shares will remain at 12.00% through August 2026. The rate has increased from 9% at its July 2025 launch to the current high via a "ratchet" mechanism, which permanently raises the rate by 0.5% whenever the share price falls below $95. This mechanism is intended to push the price back toward its $100 par value and support Strategy's "at-the-market" (ATM) program for issuing new shares to fund Bitcoin purchases. However, the mechanism has not worked as intended. STRC shares closed at $89.46 on July 31, remaining about 10-11% below par value despite the record-high dividend. Competition from rival Strive's higher-yielding SATA securities has pressured demand. The persistent discount has forced Strategy to suspend new STRC issuances via its ATM program, limiting this funding channel for Bitcoin acquisitions. STRC's struggles reflect Bitcoin's own volatility, as the preferred shares historically move in tandem. Analysts have warned the ratchet structure carries long-term, one-way risk. A law firm is investigating Strategy's ability to maintain dividend payments if Bitcoin's price stays low. Retail investors own roughly 83% of outstanding STRC shares, a group seen as prone to panic selling during downturns. In response, Strategy has established financial reserves, including a liquidity cushion covering about 26 months of dividend/interest obligations, and a $2 billion share buyback program alongside a Bitcoin monetization framework, though the company emphasized it is not obligated to sell any Bitcoin.

cryptonews.ru30m ago

Within Strategy's Framework, STRC's Dividend Yield Remains at 12% as Share Price Stays Below Par Value

cryptonews.ru30m ago

Analyst: Bitcoin's Price Will Drop to $60k in August, Then Rebound to $70k

Financial analyst Andrey Poroshin has provided a new forecast for Bitcoin's price dynamics in August. Poroshin, an analyst at the Bitbanker exchange, expects the cryptocurrency market to experience a downturn this month, with prices retesting the $60,000 level due to a lack of supportive macroeconomic catalysts. He noted that the recent US Federal Reserve decision to hold interest rates did not significantly impact the market, while inflation remains above the 2% target. Poroshin stated that Bitcoin is ending July under pressure from moderate volatility and a lack of new macroeconomic stimuli, leading to continued market caution. According to his base scenario, Bitcoin will drop to a range of $60,000 to $62,000 before recovering to $70,000. He pointed out that even $70,000 remains below the cost of mining in the US, which has prompted some miners to shift towards AI data center operations. Poroshin cited the winding down of BitMEX's operations as a potential catalyst for a price rebound, suggesting the exit of weaker players often coincides with market reversals and reduced short-term selling pressure. He believes Bitcoin is currently less susceptible to geopolitical shocks, such as the Iran-US conflict, and does not expect significant market changes in August related to the pending CLARITY Act. Looking ahead, Poroshin forecasts that September will bring more active price fluctuations driven by potential Fed rate decisions and possible discussions or approval of the CLARITY Act.

cryptonews.ru30m ago

Analyst: Bitcoin's Price Will Drop to $60k in August, Then Rebound to $70k

cryptonews.ru30m ago

Trading

Spot

Hot Articles

How to Buy ONE

Welcome to HTX.com! We've made purchasing Harmony (ONE) simple and convenient. Follow our step-by-step guide to embark on your crypto journey.Step 1: Create Your HTX AccountUse your email or phone number to sign up for a free account on HTX. Experience a hassle-free registration journey and unlock all features.Get My AccountStep 2: Go to Buy Crypto and Choose Your Payment MethodCredit/Debit Card: Use your Visa or Mastercard to buy Harmony (ONE) instantly.Balance: Use funds from your HTX account balance to trade seamlessly.Third Parties: We've added popular payment methods such as Google Pay and Apple Pay to enhance convenience.P2P: Trade directly with other users on HTX.Over-the-Counter (OTC): We offer tailor-made services and competitive exchange rates for traders.Step 3: Store Your Harmony (ONE)After purchasing your Harmony (ONE), store it in your HTX account. Alternatively, you can send it elsewhere via blockchain transfer or use it to trade other cryptocurrencies.Step 4: Trade Harmony (ONE)Easily trade Harmony (ONE) on HTX's spot market. Simply access your account, select your trading pair, execute your trades, and monitor in real-time. We offer a user-friendly experience for both beginners and seasoned traders.

4.7k Total ViewsPublished 2024.03.29Updated 2026.06.02

How to Buy ONE

Discussions

Welcome to the HTX Community. Here, you can stay informed about the latest platform developments and gain access to professional market insights. Users' opinions on the price of ONE (ONE) are presented below.

活动图片