The Most Important Variable For Bitcoin That Investors Should Know About

bitcoinistPublished on 2026-02-28Last updated on 2026-02-28

Abstract

Analyst @ArdiNSC argues that time, not just price, is a critical yet overlooked variable for Bitcoin investors. The duration of consolidation within a downtrend reveals the underlying strength of market forces. A prolonged sideways range, like the 55-day structure after a sharp decline, indicates buyers actively absorbing supply, creating sustained contention. In contrast, the current 22-day consolidation has reached a 20% range in less than half the time. A swift breakdown would signal weakening buyer demand and stronger selling pressure at similar price levels. Conversely, holding the range longer or breaking upward would suggest renewed accumulation and potential support. Time inside a range offers clearer insight into market conviction than price movement alone.

While Bitcoin investors often prioritize price targets, support zones, and percentage moves, a recent breakdown by analyst @ArdiNSC shifts attention toward a different and often overlooked metric: time. He argues that the duration of consolidation within a downtrend can reveal more about the strength of underlying market forces than price movement alone. In other words, the clock inside each range can be just as important as the candles that form it.

Why Time Inside A Bitcoin Range Matters

The analyst explained on X that the length of time Bitcoin spends trading sideways reflects how supply and demand interact at that level. Instead of focusing only on distance traveled, he emphasized that the market’s ability—or inability—to resolve a range quickly can signal the underlying strength of buyers or the pressure applied by sellers.

To illustrate this approach, he highlighted two consolidation phases on the daily BTC/USD chart. The first structure formed after a sharp decline, lasted 55 days, and covered about 21% before breaking lower. The second, active as of February 26, 2026, spans roughly 20% but has developed in only 22 days. Although their percentage width is almost identical, their timelines differ dramatically.

Source: X

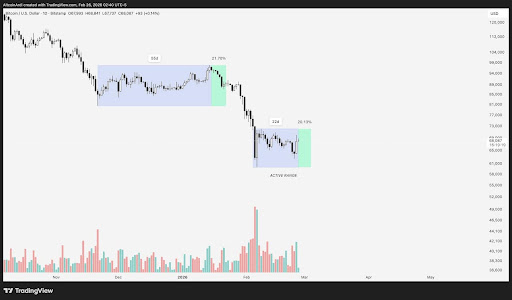
The prolonged 55-day range shows buyers actively absorbing supply for nearly two months, slowing the decline and forcing the market to work through significant demand before sellers finally regained control. In this framework, a range’s vertical height reflects the price distance required for redistribution, while its horizontal duration captures how long that redistribution takes. A long-lasting structure implies sustained contention between both sides; a short-lived one points to imbalance.

This makes the current 22-day range especially important. It has already reached a similar depth in less than half the time. If it breaks lower soon, it would signal that sellers now overpower buyers much more quickly at comparable price levels—an indication of fading demand during the broader downtrend.

What The Current Structure Suggests

The chart reinforces this time-driven interpretation. The initial consolidation expanded gradually before its decisive breakdown, reflecting a slow and steady absorption of buying pressure. The current formation emerged after another sharp decline but is unfolding far more rapidly within a similar percentage band.

Duration becomes the deciding factor from here. A swift downward resolution would confirm that buyer resistance has weakened relative to the earlier range. Achieving a similar structural outcome in fewer days would show reduced demand at this stage of the decline. Alternatively, if Bitcoin holds the range longer than expected or breaks upward with conviction, it would indicate renewed buyer engagement and potential accumulation. In that case, the zone could develop into meaningful support on future retests.

This perspective reframes common market-structure analysis. Price levels attract attention, but the time spent within them often reveals more about shifting conviction. In the current downtrend, the duration of Bitcoin’s consolidation may offer the clearest insight into which side is preparing to take control next.

BTC fails to reclaim 70,000 | Source: BTCUSD on Tradingview.com

Related Questions

QAccording to analyst @ArdiNSC, what is the most important but often overlooked metric for Bitcoin investors, and why is it significant?

AThe most important but often overlooked metric is time. It is significant because the duration of consolidation within a downtrend can reveal more about the strength of underlying market forces, such as supply and demand interaction, than price movement alone.

QHow does the length of time Bitcoin spends in a trading range reflect the market's dynamics?

AThe length of time reflects how supply and demand interact at that price level. A prolonged range indicates sustained contention between buyers and sellers, while a short-lived one points to an imbalance, showing the market's ability or inability to resolve the range quickly.

QWhat was the key difference between the two consolidation phases highlighted on the daily BTC/USD chart?

AThe key difference was their duration. The first consolidation lasted 55 days and covered about 21% before breaking lower, while the second, active as of the article's date, spanned a similar 20% but had developed in only 22 days.

QWhat would a swift downward resolution of the current 22-day range signal about the market?

AA swift downward resolution would signal that sellers now overpower buyers much more quickly at comparable price levels, indicating fading demand and weakened buyer resistance during the broader downtrend.

QWhat alternative outcome for the current range would indicate renewed buyer strength and potential accumulation?

AIf Bitcoin holds the range longer than expected or breaks upward with conviction, it would indicate renewed buyer engagement and potential accumulation, suggesting the zone could develop into meaningful support on future retests.

Related Reads

Trading

Spot
Futures

Hot Articles

What is $BITCOIN

DIGITAL GOLD ($BITCOIN): A Comprehensive Analysis Introduction to DIGITAL GOLD ($BITCOIN) DIGITAL GOLD ($BITCOIN) is a blockchain-based project operating on the Solana network, which aims to combine the characteristics of traditional precious metals with the innovation of decentralized technologies. While it shares a name with Bitcoin, often referred to as “digital gold” due to its perception as a store of value, DIGITAL GOLD is a separate token designed to create a unique ecosystem within the Web3 landscape. Its goal is to position itself as a viable alternative digital asset, although specifics regarding its applications and functionalities are still developing. What is DIGITAL GOLD ($BITCOIN)? DIGITAL GOLD ($BITCOIN) is a cryptocurrency token explicitly designed for use on the Solana blockchain. In contrast to Bitcoin, which provides a widely recognized value storage role, this token appears to focus on broader applications and characteristics. Notable aspects include: Blockchain Infrastructure: The token is built on the Solana blockchain, known for its capacity to handle high-speed and low-cost transactions. Supply Dynamics: DIGITAL GOLD has a maximum supply capped at 100 quadrillion tokens (100P $BITCOIN), although details regarding its circulating supply are currently undisclosed. Utility: While precise functionalities are not explicitly outlined, there are indications that the token could be utilized for various applications, potentially involving decentralized applications (dApps) or asset tokenization strategies. Who is the Creator of DIGITAL GOLD ($BITCOIN)? At present, the identity of the creators and development team behind DIGITAL GOLD ($BITCOIN) remains unknown. This situation is typical among many innovative projects within the blockchain space, particularly those aligning with decentralized finance and meme coin phenomena. While such anonymity may foster a community-driven culture, it intensifies concerns about governance and accountability. Who are the Investors of DIGITAL GOLD ($BITCOIN)? The available information indicates that DIGITAL GOLD ($BITCOIN) does not have any known institutional backers or prominent venture capital investments. The project seems to operate on a peer-to-peer model focused on community support and adoption rather than traditional funding routes. Its activity and liquidity are primarily situated on decentralized exchanges (DEXs), such as PumpSwap, rather than established centralized trading platforms, further highlighting its grassroots approach. How DIGITAL GOLD ($BITCOIN) Works The operational mechanics of DIGITAL GOLD ($BITCOIN) can be elaborated on based on its blockchain design and network attributes: Consensus Mechanism: By leveraging Solana’s unique proof-of-history (PoH) combined with a proof-of-stake (PoS) model, the project ensures efficient transaction validation contributing to the network's high performance. Tokenomics: While specific deflationary mechanisms have not been extensively detailed, the vast maximum token supply implies that it may cater to microtransactions or niche use cases that are still to be defined. Interoperability: There exists the potential for integration with Solana’s broader ecosystem, including various decentralized finance (DeFi) platforms. However, the details regarding specific integrations remain unspecified. Timeline of Key Events Here is a timeline that highlights significant milestones concerning DIGITAL GOLD ($BITCOIN): 2023: The initial deployment of the token occurs on the Solana blockchain, marked by its contract address. 2024: DIGITAL GOLD gains visibility as it becomes available for trading on decentralized exchanges like PumpSwap, allowing users to trade it against SOL. 2025: The project witnesses sporadic trading activity and potential interest in community-led engagements, although no noteworthy partnerships or technical advancements have been documented as of yet. Critical Analysis Strengths Scalability: The underlying Solana infrastructure supports high transaction volumes, which could enhance the utility of $BITCOIN in various transaction scenarios. Accessibility: The potential low trading price per token could attract retail investors, facilitating wider participation due to fractional ownership opportunities. Risks Lack of Transparency: The absence of publicly known backers, developers, or an audit process may yield skepticism regarding the project's sustainability and trustworthiness. Market Volatility: The trading activity is heavily reliant on speculative behavior, which can result in significant price volatility and uncertainty for investors. Conclusion DIGITAL GOLD ($BITCOIN) emerges as an intriguing yet ambiguous project within the rapidly evolving Solana ecosystem. While it attempts to leverage the “digital gold” narrative, its departure from Bitcoin's established role as a store of value underscores the need for a clearer differentiation of its intended utility and governance structure. Future acceptance and adoption will likely depend on addressing the current opacity and defining its operational and economic strategies more explicitly. Note: This report encompasses synthesised information available as of October 2023, and developments may have transpired beyond the research period.

363 Total ViewsPublished 2025.05.13Updated 2025.05.13

What is $BITCOIN

Discussions

Welcome to the HTX Community. Here, you can stay informed about the latest platform developments and gain access to professional market insights. Users' opinions on the price of BTC (BTC) are presented below.

活动图片