Rented Faith: How Much of the Bitcoin ETF Inflows Is Real Money?

marsbitPublished on 2026-06-23Last updated on 2026-06-23

Abstract

"Rented Conviction: How Much of Bitcoin ETF Flows Is Real Money" The weekly inflows into Bitcoin ETFs are often interpreted as a gauge of institutional belief. However, a significant portion of this activity is driven by a hidden arbitrage trade, not directional conviction. The core mechanism is a cash-and-carry arbitrage: traders buy spot Bitcoin (often via ETFs) while simultaneously shorting CME futures to lock in the price difference, or "basis." This delta-neutral trade is essentially an interest rate play. In weekly data, about half the fluctuation in ETF flows can be explained by new short positions added by leveraged funds (hedge funds), with a correlation of 0.70. Bitcoin's price movement in a given week shows no statistical power in predicting these flows. While this arbitrage trade drives weekly *volatility*, it is not the main component of the cumulative *stock*. Of the total ~$55 billion in net ETF inflows, the current net arbitrage position is only about $1 billion. The remainder is steady, directional buying averaging ~$400 million per week, which constitutes the vast majority of the accumulated "mountain" over two years. Thus, ETF flow data overstates the *volatility* of conviction, not its *level*. This arbitrage trade has been unwinding for nearly two years. Leveraged fund short positions peaked at ~$14 billion in late 2024 and have since declined to ~$4.5 billion. When the basis compresses to unprofitable levels, ETF inflows and short positions retreat t...

Original Author: Darko, IOSG

ETF inflows are often seen as a thermometer of institutional money's confidence in Bitcoin. But week after week, it measures something else more: a hidden interest rate trade that's repeatedly switched on and off. This article explains how to identify it, how big this trade actually is, and why it's quietly winding down.

TL;DR

  1. Week to week, ETF flows are primarily driven by a hidden arbitrage trade, not faith. Cash-and-carry traders buy the ETF while shorting futures on the CME, hedging out price risk, but are indistinguishable from genuine bulls in the data. About half of the weekly flow volatility can be explained by hedge funds' new short futures positions alone, with a correlation as high as 0.70.
  2. Bitcoin's weekly price change explains almost none of the flows. Using price returns to predict ETF flows yields a result statistically indistinguishable from zero. Weekly flows are not chasing price performance; they move in lockstep with a hedged interest rate trade.
  3. Arbitrage dominates weekly "volatility," but has never been the main component of the "stock." Of the approximately $55 billion in cumulative ETF inflows, the arbitrage trade's net position currently accounts for only about $1 billion. The rest is stable, directional buying—around $400 million per week—compounded over two years to form nearly the entire "mountain."
  4. The accurate statement is: ETF flows overestimate the "volatility" of faith, not its "level." The weekly ebbs and flows are largely "rented"—arbitrage capital comes and goes; the assets that truly settle are mostly "owned."
  5. This trade is winding down, and has been for two years. Leveraged funds' short positions grew from around $3 billion at launch to about $14 billion by late 2024, before steadily declining to roughly $4.5 billion. Once the basis compresses to unprofitability, inflows and shorts retreat in sync—don't misinterpret the resulting outflows as the market passing judgment on Bitcoin.

I. The Number Everyone Watches

Every week, Bitcoin ETFs announce how much money flowed in or out, and this number is often taken as a verdict. Large inflows mean institutions are piling in; outflows signal shaken confidence. Flow data has quietly become the headline metric for measuring market faith.

The problem is that not everyone buying an ETF is betting on Bitcoin. Some of the biggest buyers don't care which way the price goes—and once you account for them, the weekly flow number measures their activity more than anyone's belief. To understand why, you first need to meet a different kind of buyer.
A Buyer Who Doesn't Care About Price

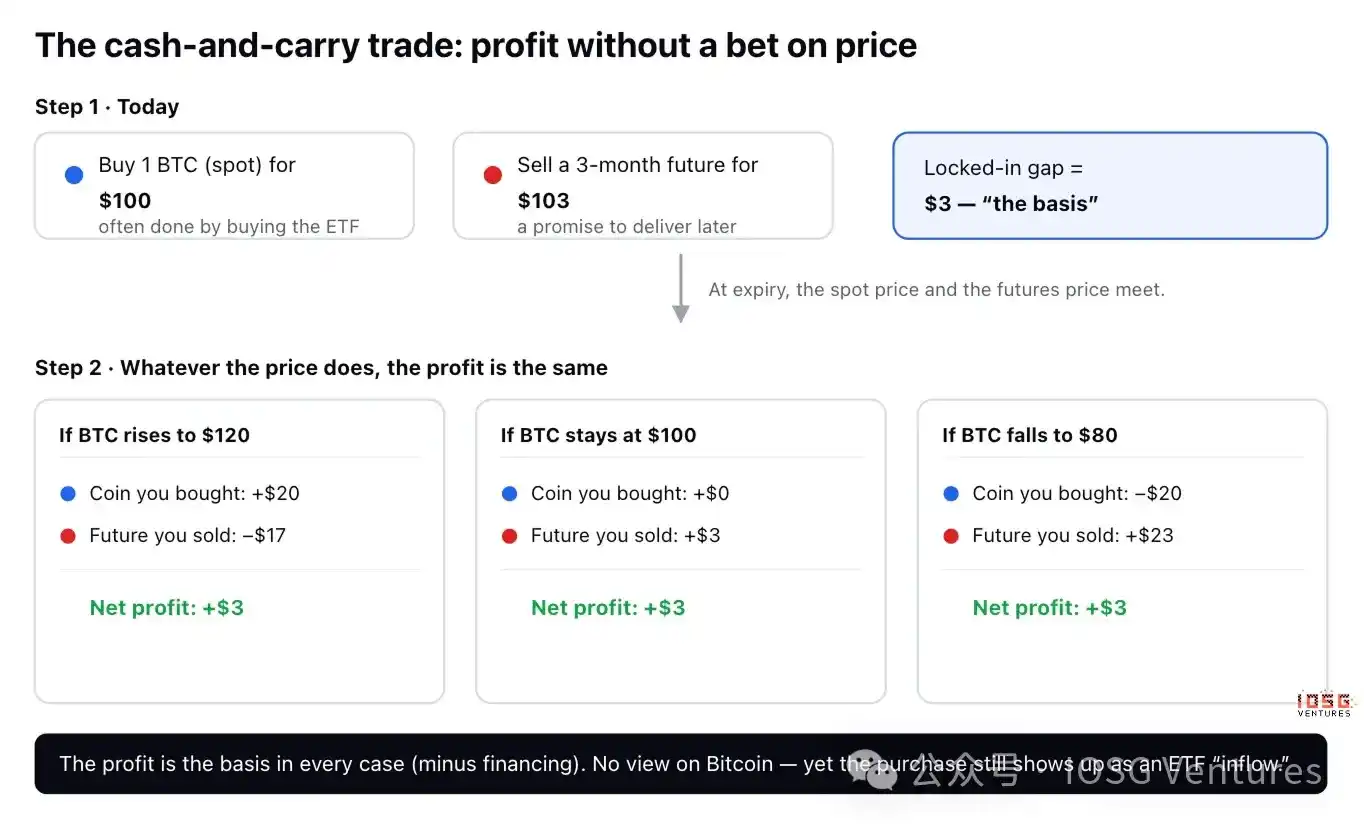
There is a classic, boring trade called cash-and-carry arbitrage. A Bitcoin "future" is simply a contract to buy or sell Bitcoin at a set price on a future date, and most of the time, the futures price is slightly higher than the current spot price—say Bitcoin is $100 now, but a contract expiring in three months sells for $103.

A trader can pocket that $3 difference without having any view on price:

  • Buy 1 Bitcoin today for $100 (often achieved by buying the ETF).
  • Sell a future for $103, promising delivery in three months.

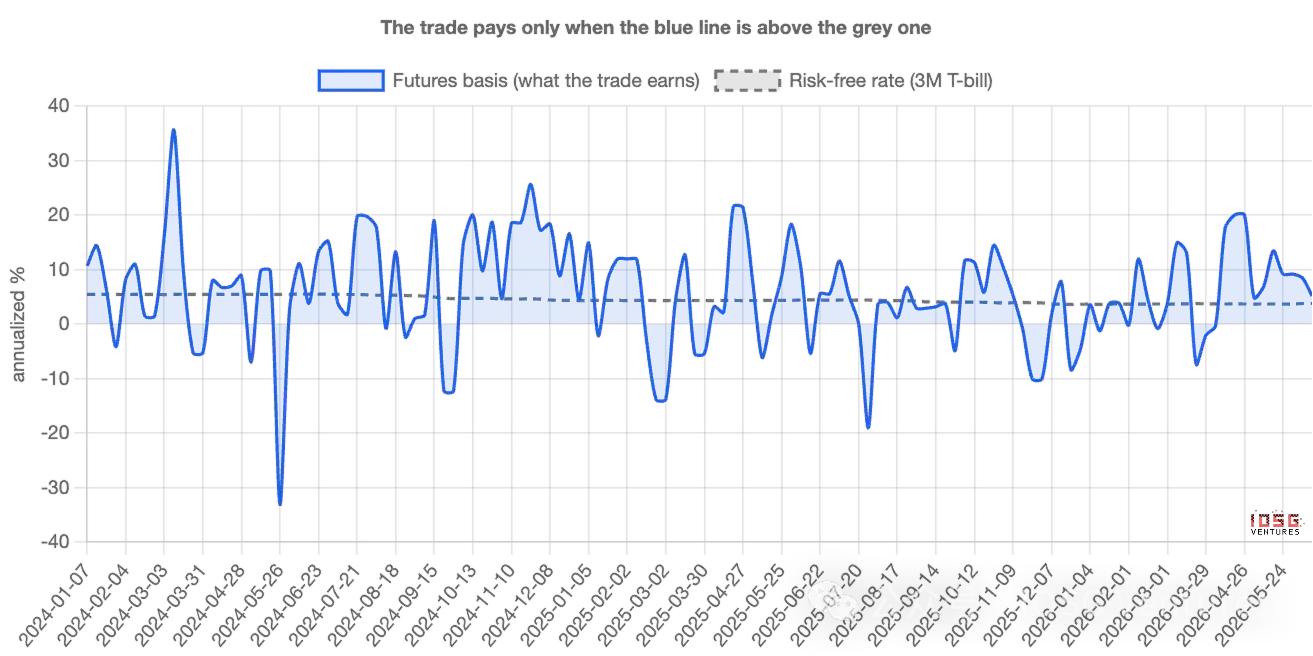
Look at what happens at expiration. If Bitcoin surges to $120, the trader makes $20 on the coin but loses $17 on the contract—net $3. If it crashes to $80, the trader loses $20 on the coin but gains $23 on the contract—still net $3. If it stays flat, still $3. The profit is the same in every scenario. The direction is hedged out; traders call this "delta neutral." This $3 spread, expressed as an annualized rate, is the basis—essentially, it's the interest a trader earns for parking capital in this trade; as long as it's higher than the risk-free yield available from US Treasuries (T-bills), the trade is worth doing.
Why This Pollutes the Headline Number

Here's the key. The first leg—buy 1 Bitcoin—is very commonly done by buying the ETF. Thus, a delta-neutral trader with no view on Bitcoin appears in the data as an ETF inflow, indistinguishable on the surface from a true believer.

When a lot of cash-and-carry arbitrage is set up, inflows look strong, and the narrative that "institutions are adding" naturally follows—even though these funds are hedged and will reverse the moment the trade is no longer profitable. In other words, the flow number measures not just faith, it measures the activity of arbitrage desks. The challenge is separating the two—and how big each one really is.

How to Tell Them Apart

Cash-and-carry arbitrageurs leave a second footprint. For every $1 of Bitcoin they buy, they go short $1 of futures on the CME (the regulated US exchange where institutions trade Bitcoin futures). The true believer leaves only the first footprint; the arbitrageur leaves both.

And the second footprint is public. US derivatives regulators publish a weekly report detailing the size of long and short positions held by different trader types on the CME. One category—leveraged funds, essentially hedge funds—is where these arbitrageurs congregate. So you can line up, week by week, the money flowing into ETFs and the new short positions these funds establish. If the "demand" were truly faith, the two shouldn't correlate much; if a large portion of it is that hidden trade, they should move together.

II. What the Data Says: Week-to-Week, Flows Follow Futures, Not Price

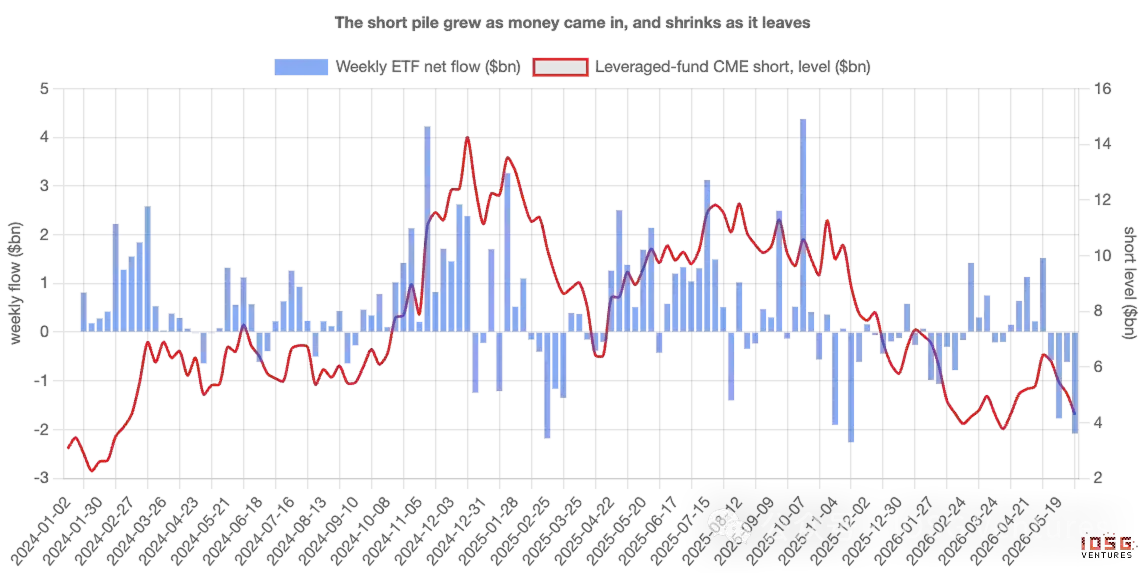
They move tightly together. In every week since the ETF launch, the more new futures shorts were added that week, the more ETF money flowed in—almost one-for-one. About half of all weekly flow volatility can be explained by just this one thing: how much shorting the funds did. The correlation is 0.70, the kind of strength you'd see between two things clearly related, not coincidental.
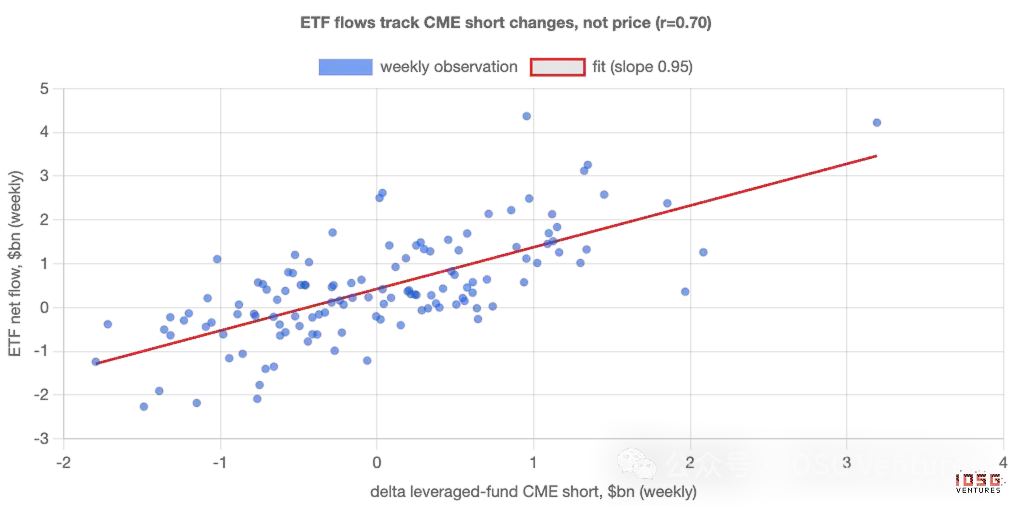
The most sobering point for believers: price itself explains almost nothing. Testing whether Bitcoin's weekly return can predict ETF flows yields an answer statistically indistinguishable from zero. Weekly money isn't chasing performance; it's moving in lockstep with a hedged interest rate trade.

So, as a week-to-week signal, ETF "demand" is mostly arbitrage. The flow number is a poor thermometer for faith because its ups and downs are the result of a basis trade being switched on and off, not anyone changing their mind about Bitcoin.

But How Much of the Money Is Actually This Trade?

This is where the simplistic claim—"it's all fake"—falls apart, and the real story is more interesting. The basis trade dominates weekly volatility, but was never the main component of the stock of money.

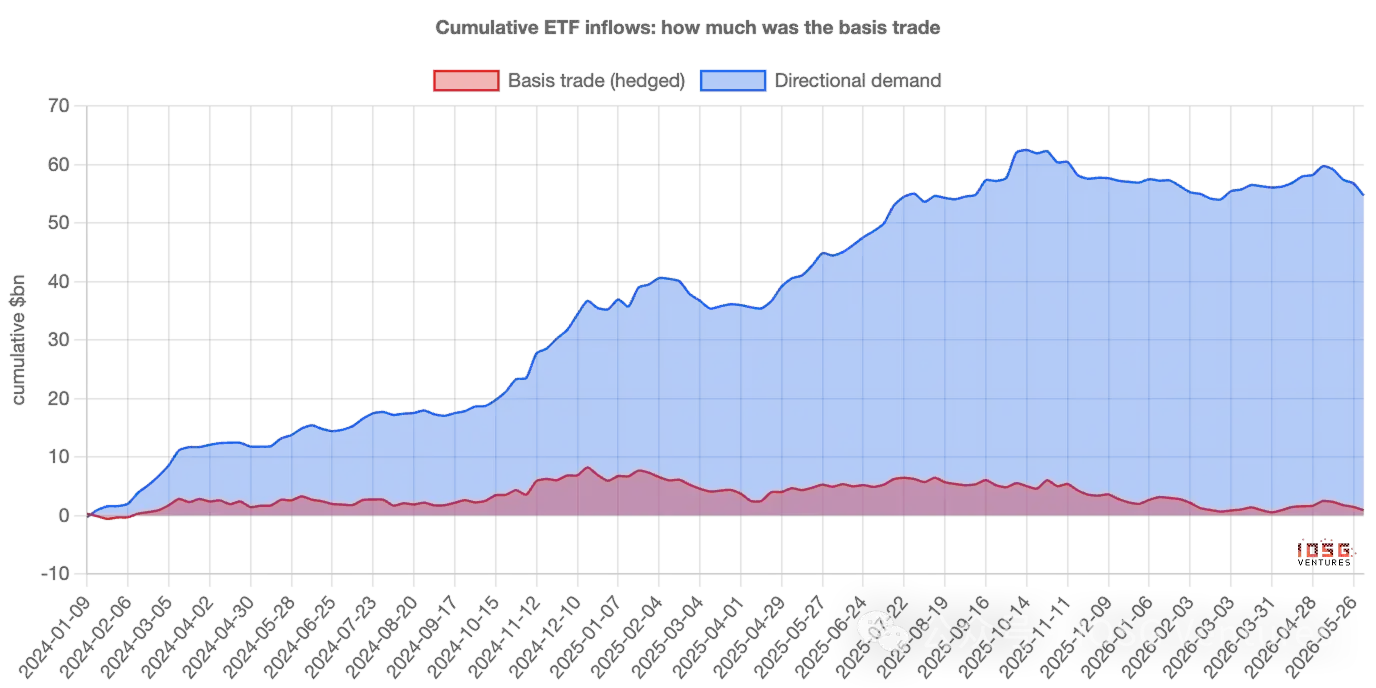
Break weekly inflows into the part explained by futures shorts (hedged) and the remainder (directional), then accumulate from launch. Of the roughly $55 billion in cumulative ETF inflows, the basis trade's current net position is only about $1 billion—the rest is stable, directional buying. That buying is about $400 million per week, week after week, regardless of basis or price, compounding over two years to form almost the entire mountain.
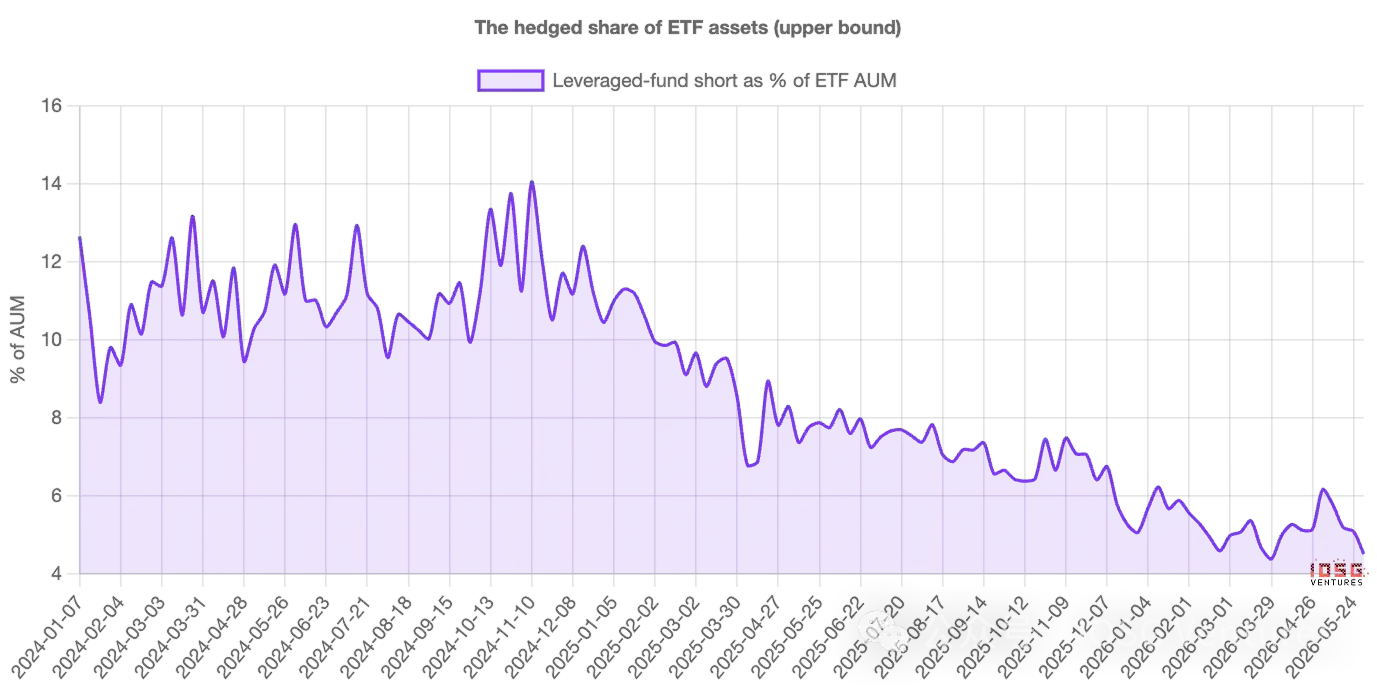
Looking at asset share rather than flows paints the same picture: the hedged portion approached 14% of ETF assets at its peak in 2024, and is now about 4%–5%. It was a non-negligible minority at its peak; now it's a small slice.
So, a more precise statement is: ETF flows overestimate the volatility of faith, not its level. The weekly ebbs and flows are largely "rented"—arbitrage capital comes and goes; but the assets that truly settle are mostly "owned." This trade stirs up the flow data but was never the majority of the balance.

And This Trade Is Winding Down

The hedged portion isn't just small—it's been shrinking for two years. Leveraged funds' short positions grew from around $3 billion at launch, peaked at about $14 billion by late 2024, and have steadily declined to around $4.5 billion. This arbitrage trade has been unwinding throughout the entire period, not just recently.

This matters for interpreting the present. Heading into June, the hedged position roughly halved again—funds' shorts shrunk from about $6.4 billion to $4.3 billion—while ETFs saw daily outflows of $300–500 million. Viewed superficially, that looks like panicked capitulation. But with futures data, it's just the routine cleanup of an interest rate trade that's no longer profitable. The same outflow numbers, two starkly different stories.

When the Basis Compresses, Demand Retreats

The cleanest proof is what happens when the trade stops being profitable. When that $3 spread narrows to almost match what traders can earn risk-free, the trade isn't worth doing. If a large chunk of weekly demand truly is this trade, then weekly demand should weaken exactly when the spread compresses—and it does. Detrend each series and observe moments around a compression: ETF inflows drop below their normal rhythm, and funds simultaneously cover shorts, both happening in sync. Demand and the trade breathe together.
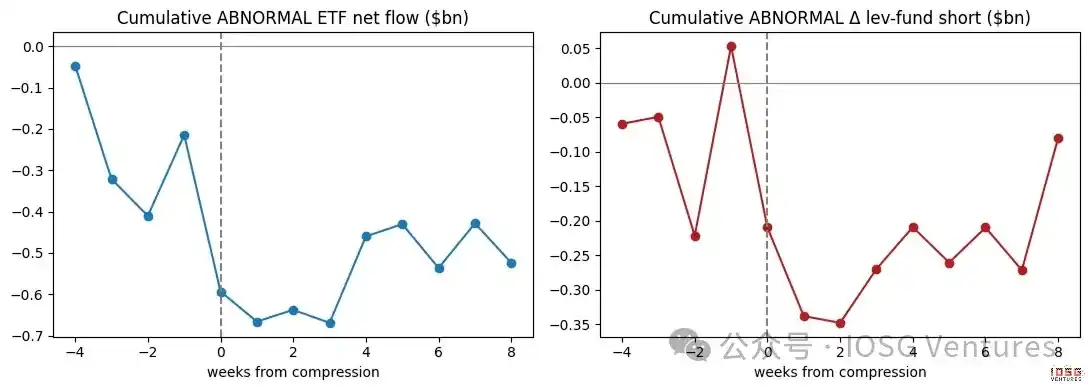
True believers wouldn't care about the futures basis. And this weekly "demand" clearly does.

III. What Comes First, and Who's Really Doing It

First, the relationship is contemporaneous—tightest within the same week, with no clear lead or lag; and what little directional evidence exists actually points the opposite way: ETF flows appear to drive shorts, not the other way around. This fits the logic of a paired trade: buy the ETF first, then follow with the futures hedge, rather than shorting magically "creating" an inflow. Second, the arbitrage crowd isn't the sole driver. Flows track leveraged fund shorts most closely, but they also resonate with directional institutional positions—both types of buyers are active. The argument here is not that every inflow is hedged; it's that the hedged trade is the tightest, most reliable driver of week-to-week volatility.

Ethereum: The Same Trade, But the Math Barely Works

Applying the same test to Ethereum ETFs, the signature is still there but weaker—the link to futures shorts is looser, and the underlying stable directional buying is almost non-existent. The reason is clear. Holding spot Ethereum instead of a future means forgoing the staking yield Ethereum offers, roughly 3%–4% annually. After deducting that, Ethereum's basis is often negative—the arbitrage trade often can't even clear its hurdle rate. So Ethereum ETFs have neither strong conviction buying nor robust arbitrage positions underpinning them; they are just smaller and noisier than their Bitcoin counterparts.

IV. How to Read ETF Flows from Now On

The point isn't a judgment on price, but a method for reading flows. When the basis is rich, expect "institutional demand" to appear strong and largely hedged—don't mistake that strength for faith. When the basis compresses, expect inflows and shorts to retreat together—don't misinterpret the resulting outflows as the market passing judgment on Bitcoin. The two numbers worth watching are: the level of the annualized basis yield relative to the T-bill rate, and the net short position of leveraged funds in the weekly CME report. They will tell you how much of the next "demand" headline is real.

How We Measured It

A few honest limitations. The basis is constructed from the front-month CME futures contract against spot, excluding the final few days before each expiration (where the extremely short time-to-expiry can amplify rounding errors into spurious spikes). Building the series contract-by-contract would sharpen the exact numbers but wouldn't change the conclusion. The relationship between flows and shorts is a strong co-movement, not proof of one causing the other—the key point is they are two halves of the same trade. The futures short number is an upper bound on how much ETF buying is hedged, because some shorting hedges coins held elsewhere.

None of this changes the main narrative. Week-to-week, Bitcoin ETF "demand" is mostly a hidden interest rate trade, not faith—flows measure the activity of arbitrage participation far more accurately than they measure conviction. And that real buying is genuine, patient, and now constitutes almost all that's left, because the "rented" portion has spent two years quietly heading home.


Trending Cryptos

Related Reads

Conversation with Co-founder of Hyperdash: Why is Hyperliquid Still Severely Undervalued?

Interview Summary with Hanson Birringer, Co-founder of Hyperdash: Why Hyperliquid Remains Undervalued In an interview on *The Rollup*, Hanson Birringer, Co-founder and Chief Revenue Officer of Hyperdash—a trading data analytics platform for Hyperliquid—shared his investment thesis on the Hyperliquid ecosystem. He described Hyperliquid as a pure play on three key crypto super-trends: perpetual contracts, real-world assets (RWAs), and stablecoins. The platform is an open-source, decentralized, and high-performance financial system uniquely positioned to bridge traditional institutional capital with decentralized finance. Birringer highlighted Hyperliquid's leadership in perpetual DEX trading and its recent innovation of RWA perpetual contracts. He emphasized the significance of USDC becoming a core quoting asset, which, by allocating 90% of its backend yield from assets like US treasuries to a protocol buyback fund, creates substantial, programmatic buy pressure for the Hype token. He addressed regulatory challenges, noting that Hyperliquid's policy team is actively engaging with US regulators like the CFTC to establish clear rules for decentralized venues. Once achieved, regulated brokers could route orders directly to Hyperliquid's backend, tapping into its low-cost liquidity layer. Regarding revenue, Birringer was optimistic, citing the immense size of traditional financial markets. Even capturing a small fraction of global trading volume in products like RWA perpetuals could lead to exponential growth for the protocol. The recently launched Grayscale Hyperliquid ETF, seeded by their SPV (Hyper Holdings Global), provides a compliant on-ramp for institutional investors drawn to the clear "cash flow + token buyback" model. Finally, he discussed Hyperdash's acquisition of Imperator, enhancing its data and node infrastructure to serve both retail traders and traditional asset managers. His bullish case rests on Hyperliquid's potential to provide unprecedented global access to dollar-based capital markets. He struggled to articulate a bear case, seeing the long-term trends of internet adoption and financial inclusion as powerful tailwinds.

marsbit1h ago

Conversation with Co-founder of Hyperdash: Why is Hyperliquid Still Severely Undervalued?

marsbit1h ago

DeepSeek V4 'Full-Blooded Edition' Leaked, Could Be Released As Early As Tomorrow

The highly anticipated full release of DeepSeek V4 is imminent, expected to launch as early as tomorrow after nearly three months of waiting. A select group has already received access to the GA (General Availability) beta, which includes two versions: DeepSeek V4 Flash and DeepSeek V4 Pro. Early testers report that V4's overall performance is close to the level of Opus 4.8, with coding capabilities rivaling GPT-5.6 Sol. Its agent abilities are significantly enhanced, and 3D/SVG generation has improved notably. While it may not surpass the recently released Kimi K3 in performance, its expected price point is significantly lower. The official release will introduce a new "peak/off-peak" pricing model for its API. For example, deepseek-v4-pro will cost $0.87 per million output tokens during standard times and $1.74 during peak hours. The flash version is even more aggressive at $0.28/$0.56 per million tokens, with cached input tokens priced extremely low at $0.0028. This makes V4 a strong contender in terms of cost-effectiveness, potentially offering Opus-level capabilities at a fraction of the cost, continuing DeepSeek's reputation as a "price disruptor" in the AI market. Initial demos showcasing V4's capabilities have begun circulating, including generated 3D simulation games, HTML games blending elements of Minecraft and No Man's Sky, and classic games like a "Cut the Rope" clone. The final GA version is set to replace the older deepseek-chat and deepseek-reasoner models, which will be retired on July 24th.

marsbit1h ago

DeepSeek V4 'Full-Blooded Edition' Leaked, Could Be Released As Early As Tomorrow

marsbit1h ago

WEEX Labs Weekly Observation: The 'Power Restructuring' of AI Infrastructure and the 'Deep Dive Movement' into the Real Economy

WEEX Labs Weekly Review: AI Infrastructure's "Power Restructuring" and the "Deep Dive" into the Real Economy Mid-July 2026 marks a pivotal shift in the global AI industry. The allocation of computing power is transferring from cloud giants to compute resource owners, while the core value of AI is solidifying around its penetration into physical industry, moving beyond the race for model parameters. The era of fragmented model development is over, replaced by a capital-intensive, integrated chain driven by hard tech. Key developments this week include Meta's planned entry into the cloud computing market with "MetaCompute." This move by social media giants with massive GPU clusters challenges traditional cloud providers like AWS, integrating compute, models, and data into one-stop services, which will squeeze smaller rental providers and shift enterprise focus towards underlying model ecosystems. Chinese foundational models like DeepSeek-V4 and Tencent's Hy-3 are pushing towards "utility" status through open-source releases and extreme cost reductions via MoE architectures. This lowers entry barriers for enterprises, allowing them to focus resources on private deployment and deep business integration. Embodied intelligence, particularly humanoid robots, is transitioning from lab demos to real-world factory applications, driven by policies promoting large-scale, practical deployment in logistics and manufacturing. The value focus is shifting from spectacle to stable industrial data and real operational efficiency. Global governance, through forums like WAIC, is evolving from theoretical ethics to practical operational frameworks for "Sovereign AI," raising geopolitical compliance barriers and making auditability and data sovereignty core design requirements from the outset. WEEX Labs Insights: The current transformation shows AI's prosperity is deeply embedding into the fabric of global manufacturing. Strategic recommendations include: 1) leveraging open-source models for private, proprietary knowledge bases; 2) maintaining cloud provider diversity to avoid vendor lock-in from integrated model ecosystems; and 3) seeking opportunities in the "embodied infrastructure" supporting robots, such as data collection, industrial simulation, and factory AI adaptation services.

marsbit2h ago

WEEX Labs Weekly Observation: The 'Power Restructuring' of AI Infrastructure and the 'Deep Dive Movement' into the Real Economy

marsbit2h ago

Is WEEX TradFi Reliable? What You Should Know Before Your First Trade of U.S. Stock Tokens

In recent years, cryptocurrency users have expanded their focus beyond Bitcoin and Ethereum to include popular traditional financial (TradFi) assets like Nvidia, Apple, and Tesla stocks. This shift raises key questions: What do these TradFi assets represent on crypto trading platforms? How do they differ from traditional stock ownership? And how can users assess the reliability of platforms offering such products? TradFi products, such as those offered by WEEX TradFi (including NVDA, MSFT, AAPL, TSLA, and QQQ tokens), are blurring the lines between crypto and traditional markets. They allow users to trade based on the price movements of traditional assets within a familiar digital asset trading environment. However, it's crucial to understand that trading a "stock token" is not equivalent to owning the actual stock. Users are participating in price speculation, not gaining shareholder rights like dividends or voting. A key feature of these products is 7x24 trading, offering flexibility beyond traditional market hours. While convenient, this also introduces unique risks, such as potential liquidity gaps and volatility when underlying markets are closed. For users evaluating TradFi products, reliability hinges on transparency and risk management. Critical factors include understanding the product mechanism, how prices track the underlying assets, and the associated risks—especially when using leverage. Popular stocks and indices are still subject to company performance, macroeconomic shifts, and sector trends. Ultimately, TradFi represents a new gateway connecting crypto users to global markets. The future points toward integrated trading environments where the distinction between "crypto investor" and "traditional investor" fades. For newcomers, a platform's reliability stems not from promises, but from a clear understanding of the product, a comprehensive view of risks, and informed judgment of the platform's capabilities.

marsbit2h ago

Is WEEX TradFi Reliable? What You Should Know Before Your First Trade of U.S. Stock Tokens

marsbit2h ago

Trading

Spot

Hot Articles

What is $BITCOIN

DIGITAL GOLD ($BITCOIN): A Comprehensive Analysis Introduction to DIGITAL GOLD ($BITCOIN) DIGITAL GOLD ($BITCOIN) is a blockchain-based project operating on the Solana network, which aims to combine the characteristics of traditional precious metals with the innovation of decentralized technologies. While it shares a name with Bitcoin, often referred to as “digital gold” due to its perception as a store of value, DIGITAL GOLD is a separate token designed to create a unique ecosystem within the Web3 landscape. Its goal is to position itself as a viable alternative digital asset, although specifics regarding its applications and functionalities are still developing. What is DIGITAL GOLD ($BITCOIN)? DIGITAL GOLD ($BITCOIN) is a cryptocurrency token explicitly designed for use on the Solana blockchain. In contrast to Bitcoin, which provides a widely recognized value storage role, this token appears to focus on broader applications and characteristics. Notable aspects include: Blockchain Infrastructure: The token is built on the Solana blockchain, known for its capacity to handle high-speed and low-cost transactions. Supply Dynamics: DIGITAL GOLD has a maximum supply capped at 100 quadrillion tokens (100P $BITCOIN), although details regarding its circulating supply are currently undisclosed. Utility: While precise functionalities are not explicitly outlined, there are indications that the token could be utilized for various applications, potentially involving decentralized applications (dApps) or asset tokenization strategies. Who is the Creator of DIGITAL GOLD ($BITCOIN)? At present, the identity of the creators and development team behind DIGITAL GOLD ($BITCOIN) remains unknown. This situation is typical among many innovative projects within the blockchain space, particularly those aligning with decentralized finance and meme coin phenomena. While such anonymity may foster a community-driven culture, it intensifies concerns about governance and accountability. Who are the Investors of DIGITAL GOLD ($BITCOIN)? The available information indicates that DIGITAL GOLD ($BITCOIN) does not have any known institutional backers or prominent venture capital investments. The project seems to operate on a peer-to-peer model focused on community support and adoption rather than traditional funding routes. Its activity and liquidity are primarily situated on decentralized exchanges (DEXs), such as PumpSwap, rather than established centralized trading platforms, further highlighting its grassroots approach. How DIGITAL GOLD ($BITCOIN) Works The operational mechanics of DIGITAL GOLD ($BITCOIN) can be elaborated on based on its blockchain design and network attributes: Consensus Mechanism: By leveraging Solana’s unique proof-of-history (PoH) combined with a proof-of-stake (PoS) model, the project ensures efficient transaction validation contributing to the network's high performance. Tokenomics: While specific deflationary mechanisms have not been extensively detailed, the vast maximum token supply implies that it may cater to microtransactions or niche use cases that are still to be defined. Interoperability: There exists the potential for integration with Solana’s broader ecosystem, including various decentralized finance (DeFi) platforms. However, the details regarding specific integrations remain unspecified. Timeline of Key Events Here is a timeline that highlights significant milestones concerning DIGITAL GOLD ($BITCOIN): 2023: The initial deployment of the token occurs on the Solana blockchain, marked by its contract address. 2024: DIGITAL GOLD gains visibility as it becomes available for trading on decentralized exchanges like PumpSwap, allowing users to trade it against SOL. 2025: The project witnesses sporadic trading activity and potential interest in community-led engagements, although no noteworthy partnerships or technical advancements have been documented as of yet. Critical Analysis Strengths Scalability: The underlying Solana infrastructure supports high transaction volumes, which could enhance the utility of $BITCOIN in various transaction scenarios. Accessibility: The potential low trading price per token could attract retail investors, facilitating wider participation due to fractional ownership opportunities. Risks Lack of Transparency: The absence of publicly known backers, developers, or an audit process may yield skepticism regarding the project's sustainability and trustworthiness. Market Volatility: The trading activity is heavily reliant on speculative behavior, which can result in significant price volatility and uncertainty for investors. Conclusion DIGITAL GOLD ($BITCOIN) emerges as an intriguing yet ambiguous project within the rapidly evolving Solana ecosystem. While it attempts to leverage the “digital gold” narrative, its departure from Bitcoin's established role as a store of value underscores the need for a clearer differentiation of its intended utility and governance structure. Future acceptance and adoption will likely depend on addressing the current opacity and defining its operational and economic strategies more explicitly. Note: This report encompasses synthesised information available as of October 2023, and developments may have transpired beyond the research period.

906 Total ViewsPublished 2025.05.13Updated 2025.05.13

What is $BITCOIN

Discussions

Welcome to the HTX Community. Here, you can stay informed about the latest platform developments and gain access to professional market insights. Users' opinions on the price of BTC (BTC) are presented below.

活动图片