Rare monthly buy signal flashes for Ethereum—but the bullish case isn’t clear-cut

ambcryptoPublished on 2026-07-02Last updated on 2026-07-02

Abstract

Ethereum (ETH) has seen recent price gains of 8.05% in the past week and 4.9% in the past day. However, the overall sentiment remains bearish, evidenced by significant outflows of $358.3 million from its spot ETFs since mid-June 2026 and the loss of key support levels at $3.2k and $2.0k. Despite the downtrend, market data shows a potential short-term squeeze. The taker buy-sell ratio and Open Interest have risen, indicating aggressive buyer orders and renewed speculative interest in perpetual swap markets. This activity could fuel a short squeeze, though a slowdown in Open Interest would suggest the bounce is merely due to short covering, not sustained demand. A critical long-term support level is the -1.0σ MVRV band at $1,549. Meanwhile, a rare monthly TD Sequential buy signal has flashed for July—similar signals in the past preceded major rallies of 235% and 182%. However, the persistent negative ETF flows and weak market sentiment cast doubt on whether a major bottom is forming. The bullish case is not clear-cut, and time will tell if further decline is ahead.

The Ethereum [ETH] price action was in a longer-term downtrend, but has rallied 8.05% in the past week and 4.9% in the past 24 hours alone. Yet, according to data from Farside Investors, the Ethereum spot ETF flows since June 17, 2026, measured a negative $358.3 million.

These persistent outflows underlined the bearish market sentiment behind the leading crypto altcoin. It has lost two major support levels in 2026: the $3.2k and $2.0k levels.

AMBCrypto reported that Ethereum, trading at $1.5k, witnessed strong bearish positioning, but also warned of a possible short squeeze.

Source: CryptoQuant

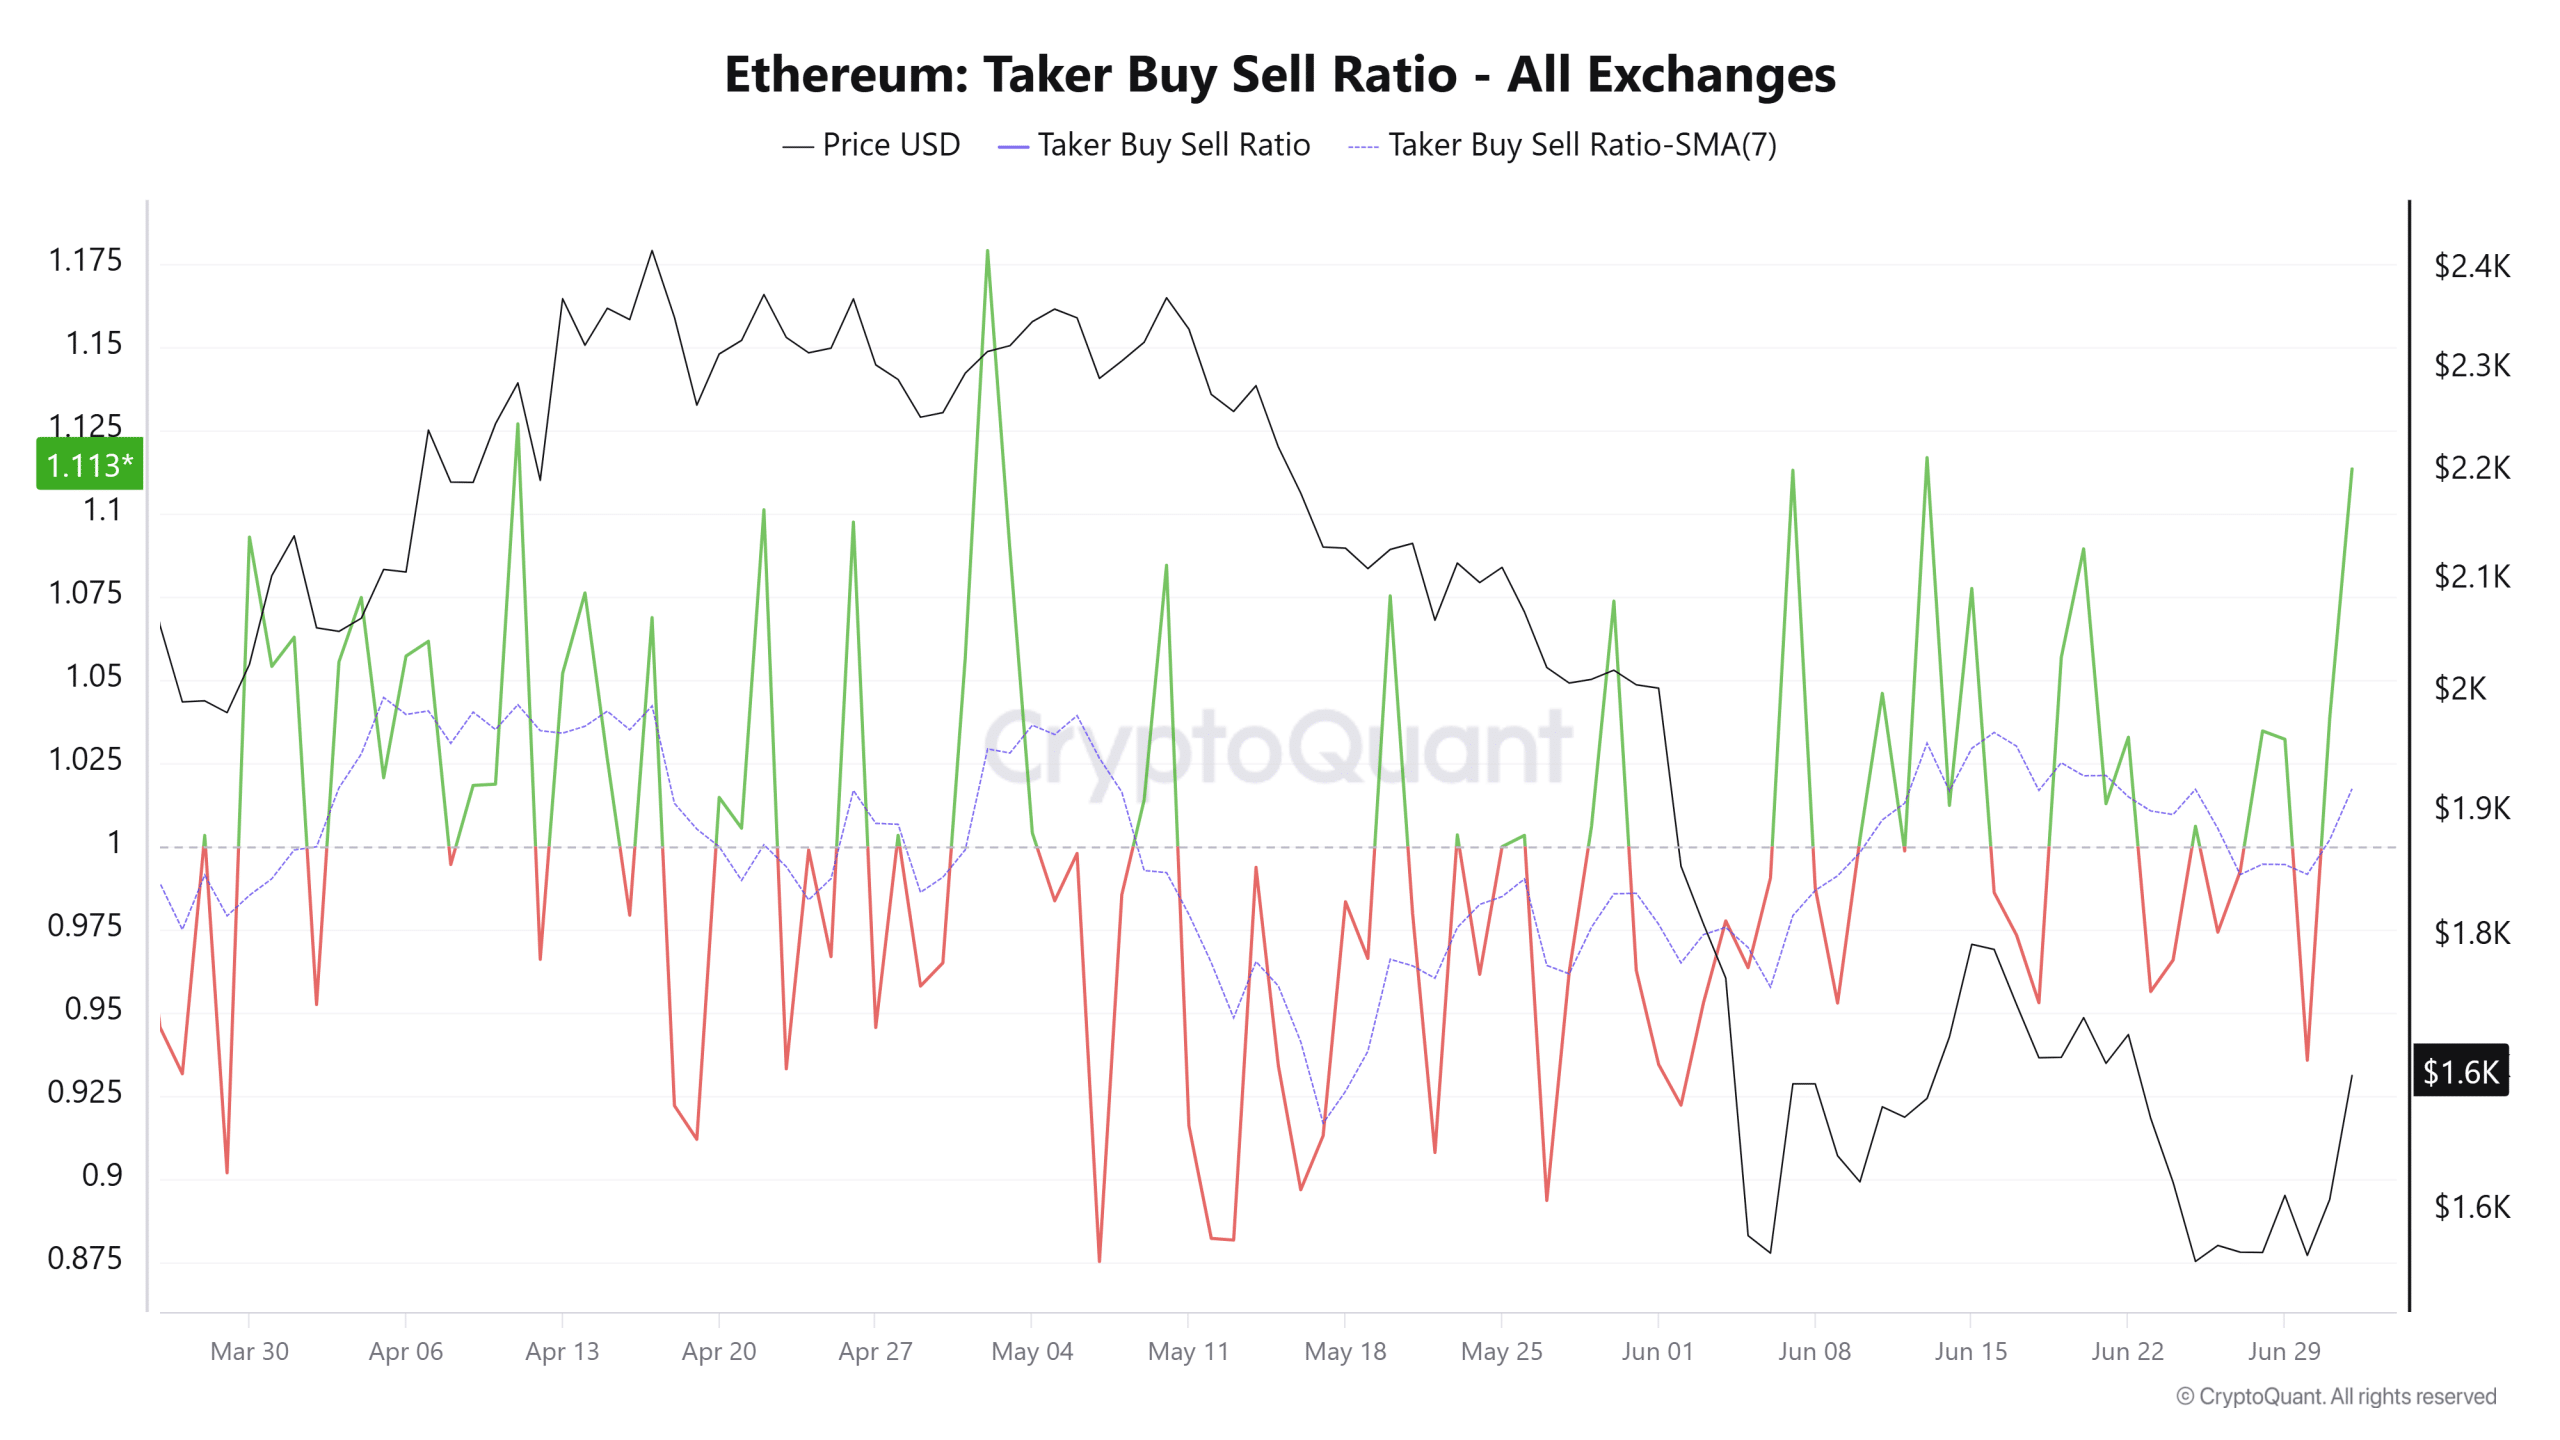
The taker buy-sell ratio jumped back above 1 in the past couple of days of trading. The metric’s 7-day moving average also rose back above 1. This showed that the recent gains were partially driven by aggressive buyer orders in the perpetual swap markets.

Source: CryptoQuant

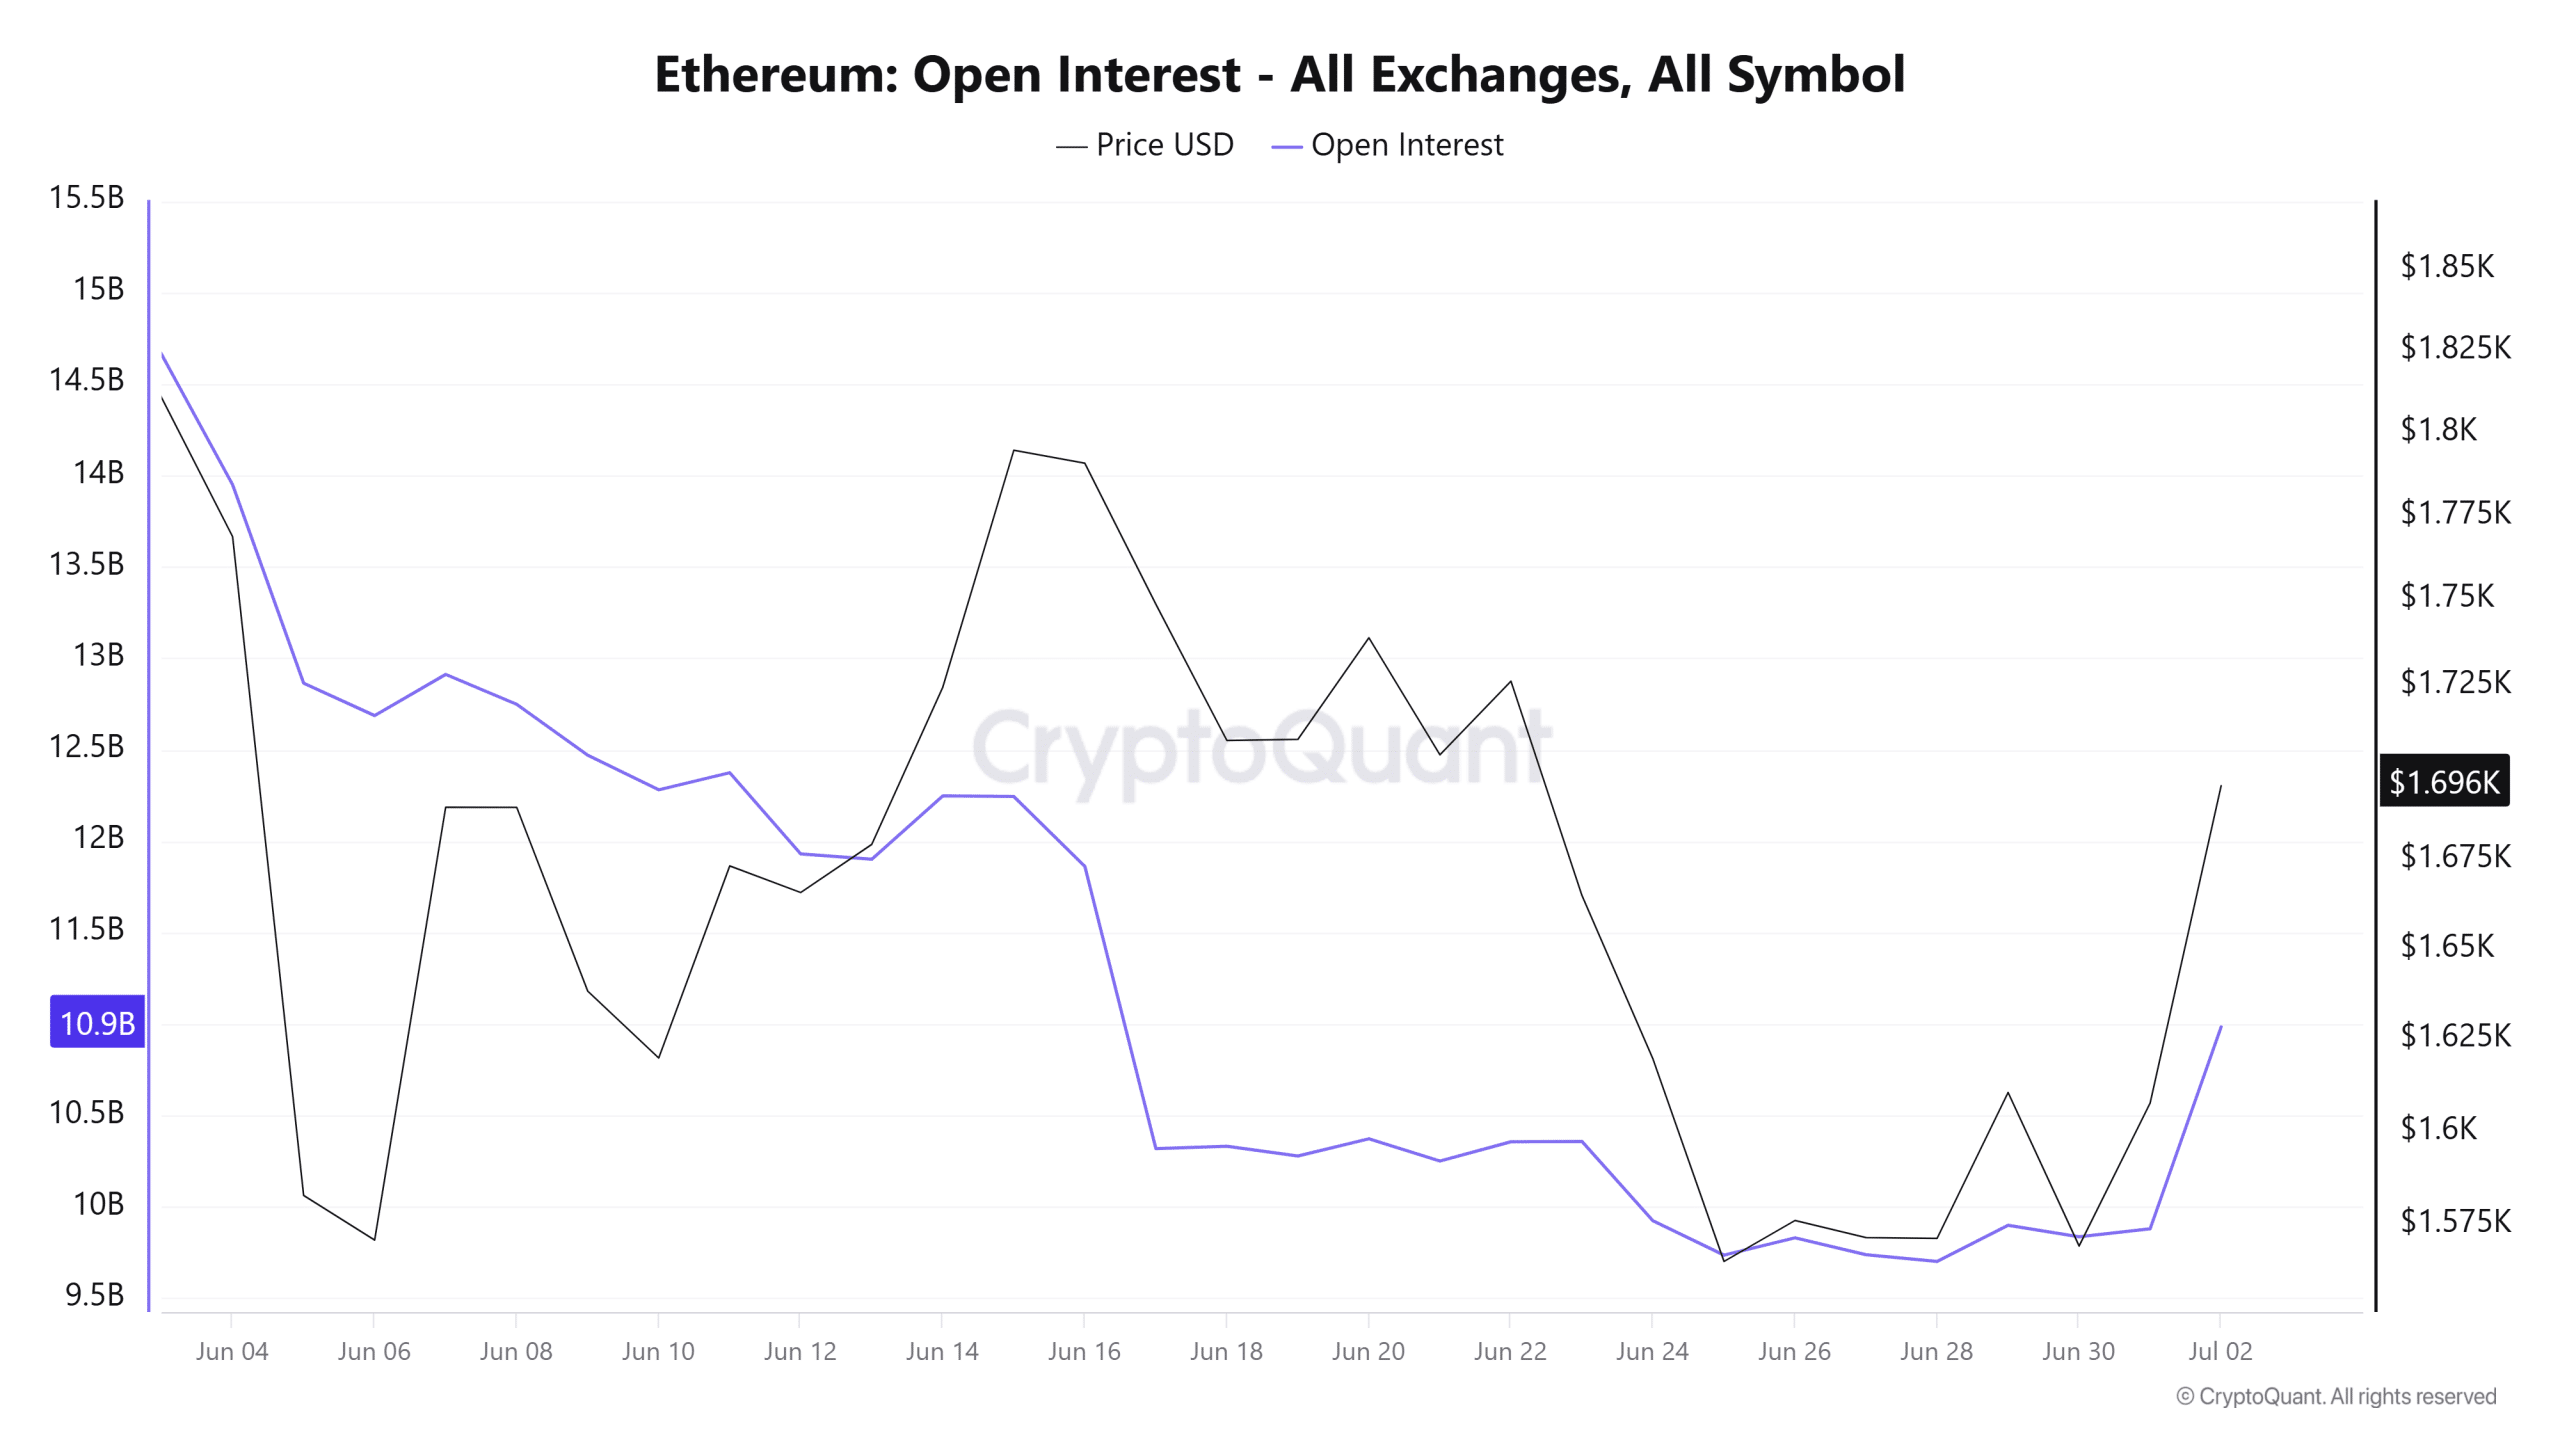
The Open Interest also picked up slightly. Increased speculative interest and buyer aggression could help drive a short squeeze in the coming days. However, if the Open Interest begins to slow down again, it would indicate the bounce was driven by short positions unwinding rather than sustained demand.

The dilemma for long-term Ethereum investors

Source: Glassnode

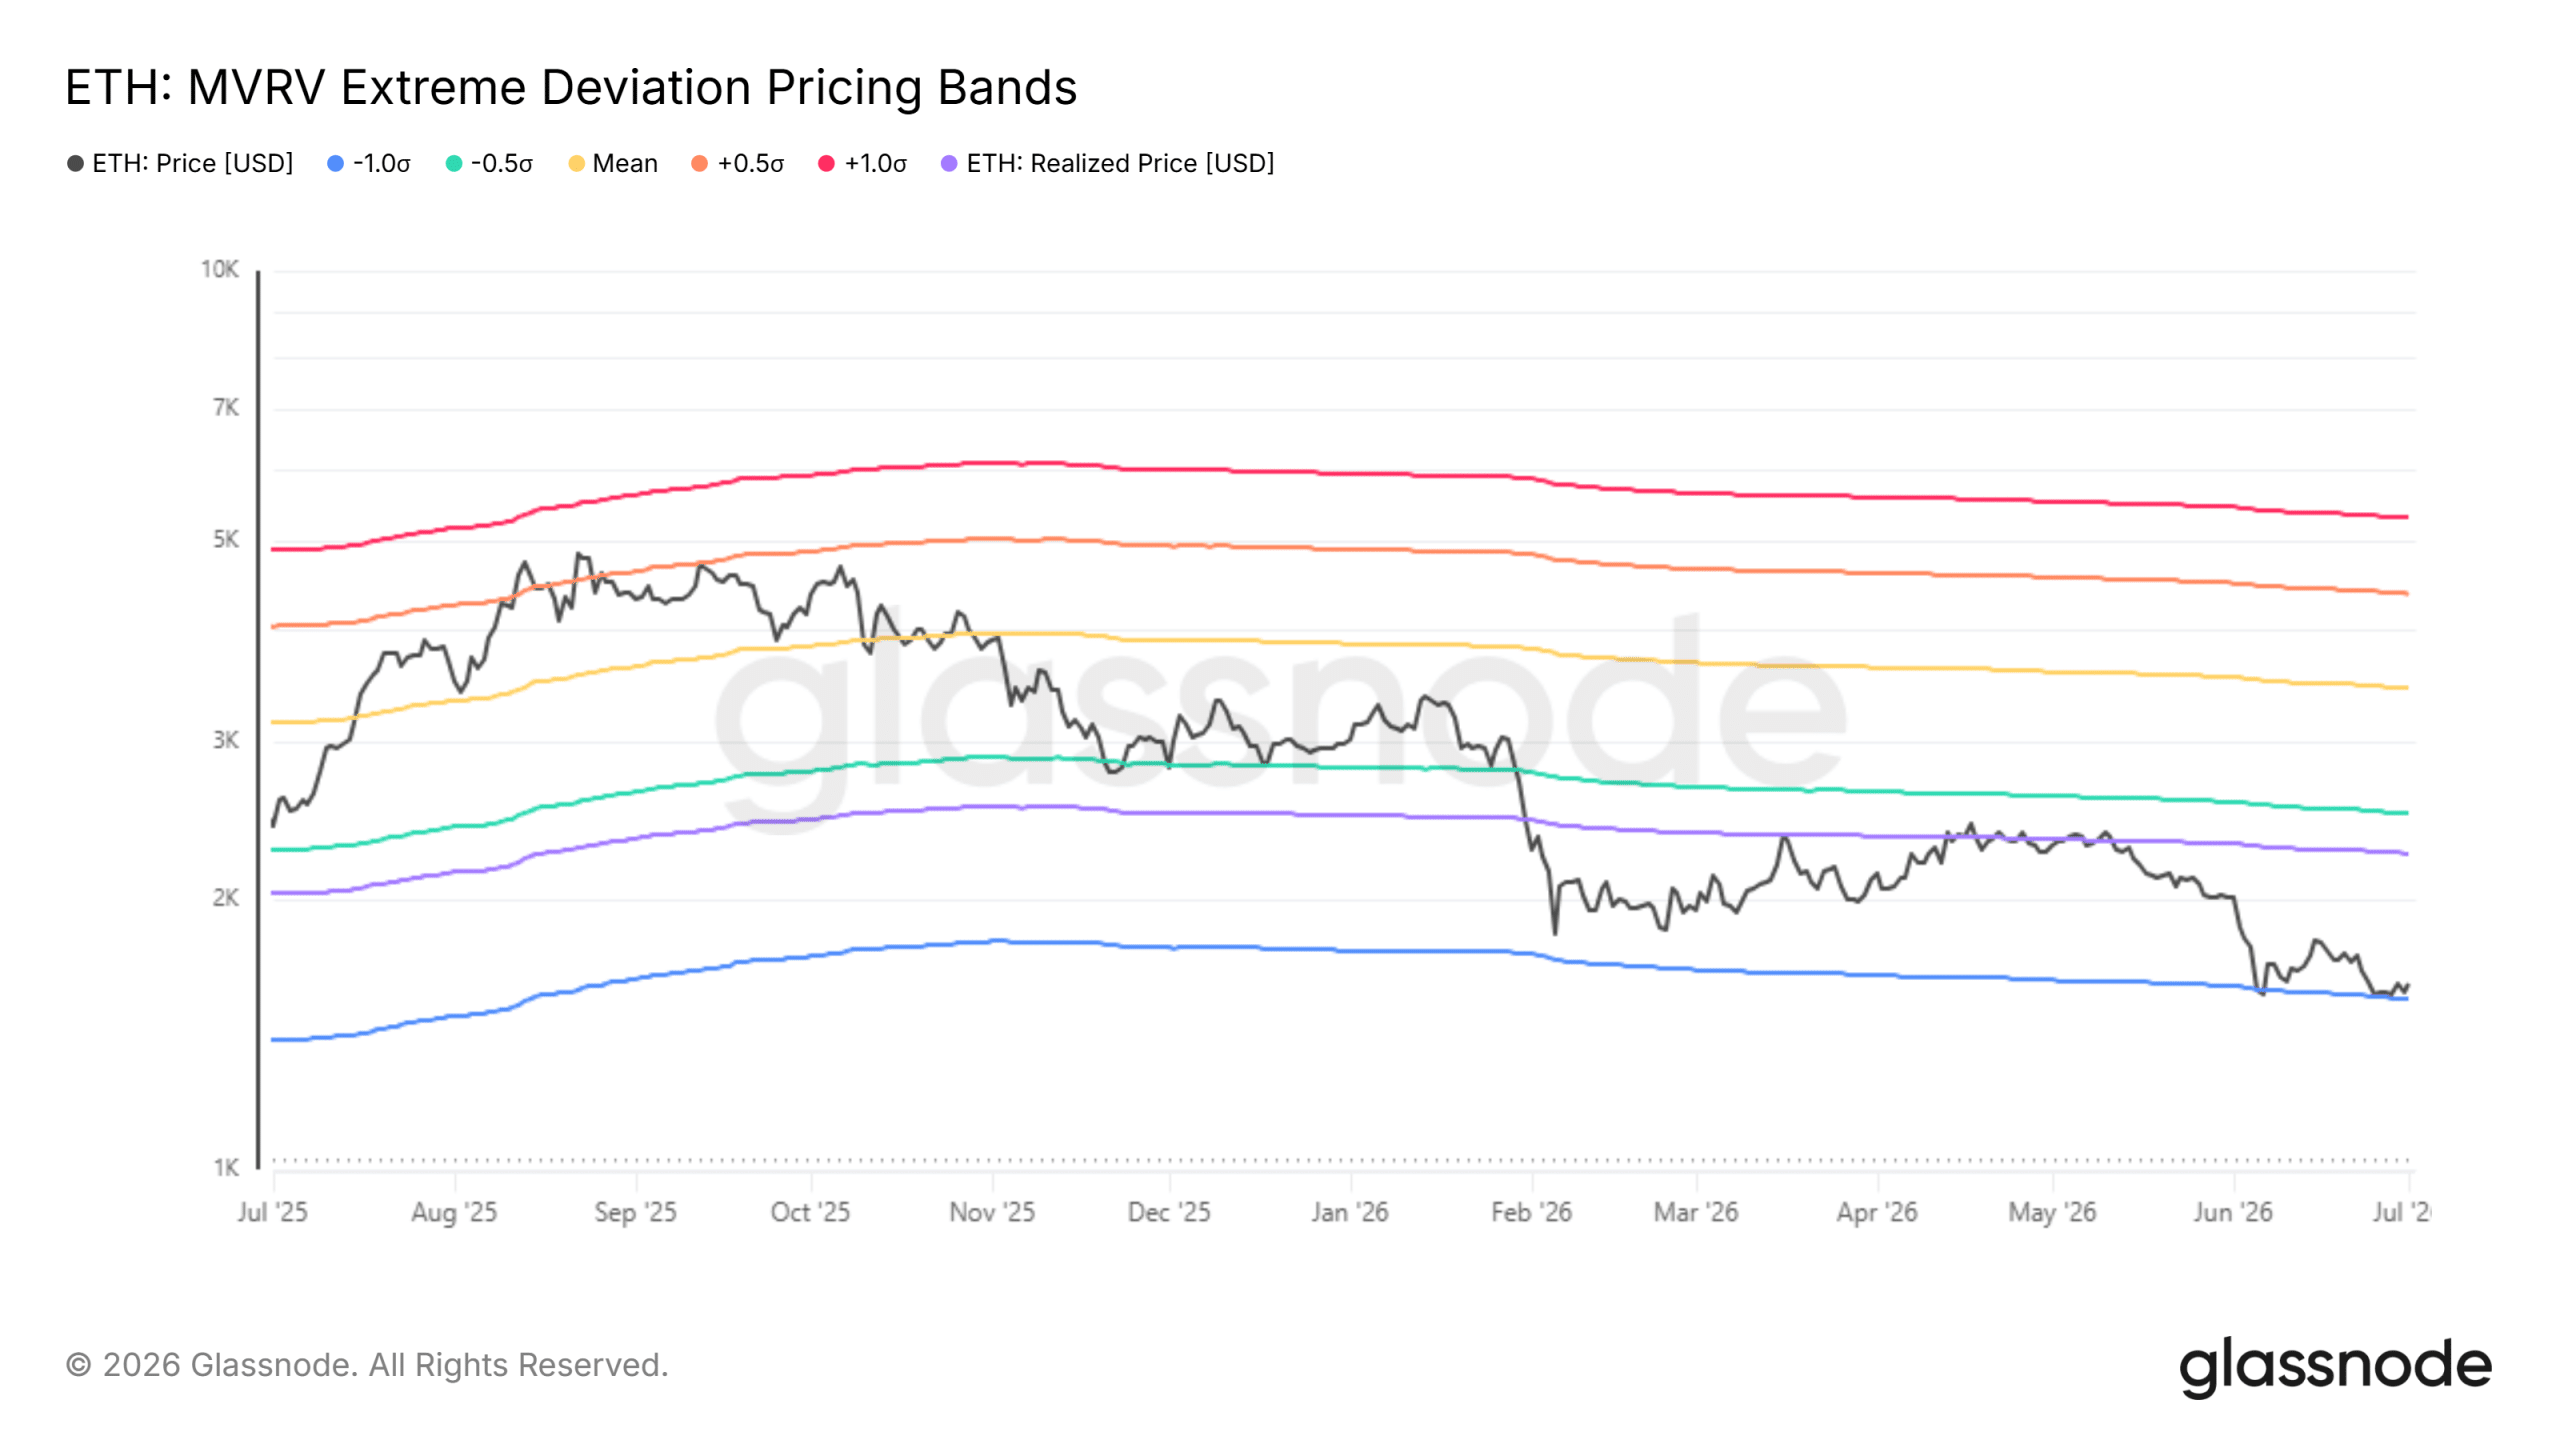
The Ethereum MVRV extreme deviation pricing bands use the all-time MVRV mean and degrees of deviation from it to form bands. These bands act as dynamic support/resistance levels.

Right now, the extreme low of the band, the -1.0σ, or one standard deviation below the mean, at $1,549, was acting as support.

Crypto analyst Ali Martinez pointed out in a post on X that July has kicked off with a buy signal on the monthly timeframe from the TD Sequential indicator.

In September 2022 and March 2025, when the same monthly buy signal flashed, Ethereum rallied 235% and 182%, respectively.

The ETF flows and wider market sentiment did not make it seem like a major market bottom was forming. Only time will confirm whether a deeper drawdown is lying in wait.


Final Summary

  • The increased Ethereum taker buy ratio in perpetual markets and Open Interest signaled increased short-term speculative interest.
  • ETH’s spot ETF flows were negative over the past two weeks, underlining weak investor conviction.

Trending Cryptos

Related Questions

QWhat recent price movements has Ethereum experienced, according to the article?

AEthereum has rallied 8.05% in the past week and 4.9% in the past 24 hours, although it has been in a longer-term downtrend.

QWhat does the negative $358.3 million in Ethereum spot ETF flows since June 17, 2026, indicate about market sentiment?

AThe persistent negative ETF outflows underline the bearish market sentiment and weak investor conviction towards Ethereum.

QWhat two major support levels did Ethereum lose in 2026, as mentioned in the article?

AEthereum lost the $3.2k and $2.0k support levels in 2026.

QWhat recent signal from the TD Sequential indicator does analyst Ali Martinez point out, and what were the historical results of similar signals?

AAli Martinez points out a monthly buy signal from the TD Sequential indicator in July. Historically, similar signals in September 2022 and March 2025 preceded rallies of 235% and 182%, respectively.

QWhat does the article suggest the recent rise in Open Interest and the Taker Buy-Sell Ratio could potentially lead to?

AThe article suggests that increased speculative interest and buyer aggression, signaled by rising Open Interest and a Taker Buy-Sell Ratio above 1, could help drive a short squeeze in the coming days.

Related Reads

Trading

Spot

Hot Articles

Discussions

Welcome to the HTX Community. Here, you can stay informed about the latest platform developments and gain access to professional market insights. Users' opinions on the price of ETH (ETH) are presented below.

活动图片