Meme Coins on a Decline, Nearly Mirror European Markets

TheNewsCryptoPublished on 2026-03-03Last updated on 2026-03-03

Abstract

Meme coins are experiencing a significant decline, nearly mirroring losses in European markets. This downturn is largely driven by the ongoing Middle East conflict involving the US, Israel, and Iran. Major meme coins like DOGE, SHIB, and PEPE have all fallen over 2.5% in 24 hours, with weekly losses for some, such as PIPPIN, exceeding 30%. The collective meme coin market cap dropped nearly 2%. European markets also extended their losses due to a sell-off linked to the geopolitical tensions, with the STOXX 600 index falling 1.3%. The European Central Bank's chief economist warned the conflict could increase inflation pressure and impact economic growth. Meanwhile, broader cryptocurrencies are attempting a recovery but have retraced from recent highs, with Bitcoin falling back to around $67k and Ethereum to $1,900. Notably, the AI crypto segment defied the trend, with tokens like NEAR posting gains over 12%.

Meme coins are on a free fall to almost mirror the condition of the European markets. The decline stems from the Middle East conflict, wherein the US and Israel have locked horns with Iran. Meanwhile, cryptocurrencies are attempting a recovery from recent losses.

Meme Coins Right Now

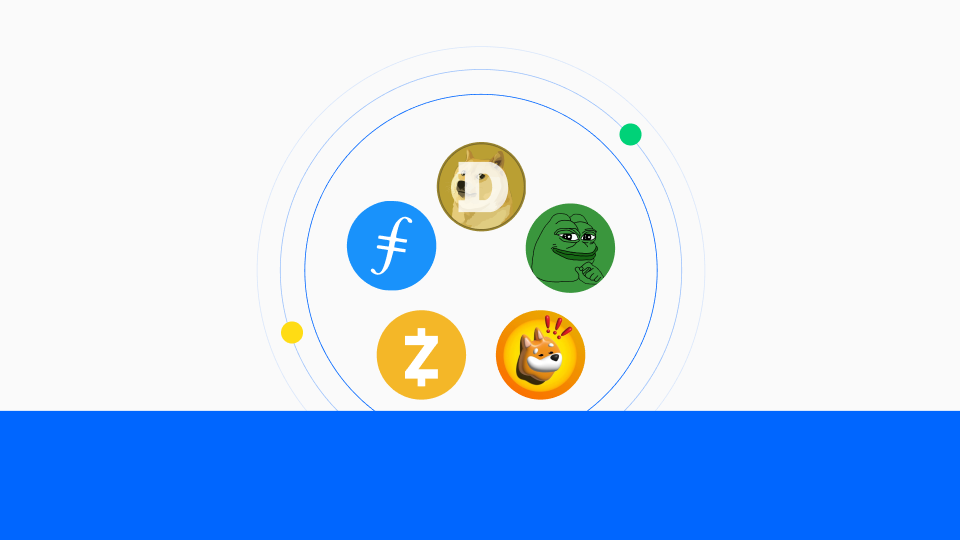
All top meme coins are down by over 2.5% at the time of writing this article. For instance, DOGE has shed 2.75% of its value while SHIB and M are down by 3.63% and 5.40%, respectively. In fact, the collective market cap is down by 1.96% with an uptick of 20.64% in trading volume.

As for the individual performance, the frog-themed meme coin, PEPE, has declined by 2.33%, and so has the TRUMP token, with slight resistance, given that it is only down by 1.04%. All percentage changes have happened over the last 24 hours.

Notably, the highest weekly loss is for PIPPIN from the list of top 7 meme tokens. PIPPIN is down by 32.12%, followed by PEPE (-12.89%) and SHIB (-10.54%).

European Markets

European markets reportedly extended their losses to the last session. The scenario has been attributed to a deep sell-off amid the rising Middle East conflict. The pan-European STOXX has plunged by 1.3% to 615.72 points. The energy sector did climb marginally, but was balanced by a 2.6% fall each by sectors led by banks and the utilities index.

European Central Bank Chief Economist Philip ​Lane, in an interaction with the Financial Times, emphasized that the war could put pressure in inflation. The aspect is seemingly coming closer, given that the State of Hormuz could turn off at any point. Lane has also underlined that the growth of the euro zone could be impacted.

Cryptocurrencies Retracing Lower

While there are notable gains, top cryptocurrencies have considerably retraced their steps on the price charts to lower values. For instance, BTC is again hovering around $67k, down from $68k+. And, ETH’s momentum is back to $1,900 after briefly booking values over the $2k margin.

That’s not where cryptocurrencies stop, though. The AI crypto segment has been able to defy the ongoing trend. TAO has gained 0.88% in a single day. NEAR has added over 12% to its trading value while VIRTUAL is aiming to surpass the 6% target.

Highlighted Crypto News Today:

BOJ Governor Says Blockchain, AI Reshaping Finance

TagsEuropeMEME Coins

Related Questions

QWhat is the main reason for the decline in meme coins and European markets mentioned in the article?

AThe decline stems from the Middle East conflict, particularly the tensions between the US, Israel, and Iran.

QWhich meme coin experienced the highest weekly loss among the top 7 tokens?

APIPPIN experienced the highest weekly loss, down by 32.12%.

QHow much did the pan-European STOXX index decline by according to the article?

AThe pan-European STOXX index plunged by 1.3% to 615.72 points.

QWhat did European Central Bank Chief Economist Philip Lane emphasize about the war's impact?

APhilip Lane emphasized that the war could put pressure on inflation and impact the growth of the euro zone.

QWhich cryptocurrency segment was able to defy the ongoing declining trend?

AThe AI crypto segment was able to defy the ongoing trend, with tokens like NEAR and VIRTUAL posting gains.

Related Reads

SemiAnalysis Dissects Huawei's Kirin 9030: Process Technology Halted, So They Folded the Chip

SemiAnalysis has published a detailed teardown report on the HiSilicon Kirin 9030 Pro chipset found in Huawei's Mate 80 Pro. Fabricated using SMIC's most advanced N+3 node without EUV lithography, the analysis reveals significant technical achievements and strategic shifts. The report indicates SMIC's N+3 has achieved transistor density comparable to TSMC's N6 (113.4 vs 107.7 MTr/mm²), primarily through aggressive use of Self-Aligned Quadruple Patterning (SAQP) for its metal layers. This results in a notably small 32.5nm M0 metal pitch. However, SemiAnalysis notes this achievement comes with significantly higher process complexity, cost, and potential yield challenges compared to competitors using more advanced tools. The Kirin 9030 design maximizes this constrained density. While its GPU performance has improved ~70% and matches Qualcomm's 2022 flagship level, the CPU core's IPC lags behind current top-tier designs from Apple and Qualcomm, a gap attributed to the underlying manufacturing technology rather than design capability. Facing long-term restrictions on advanced tools, Huawei is charting a new path. The report highlights the company's "LogicFolding" roadmap, a 3D stacking technique aimed at shortening signal paths to boost performance and efficiency. The goal is to reach 5GHz frequency and a projected density of 295 MTr/mm² by 2031. SemiAnalysis concludes that export controls have not halted China's chip progress but have fundamentally altered its trajectory, making it more expensive and complex. This has spurred innovation in alternative areas like 3D stacking and domestic EDA tool development, with Huawei's supply chain also beginning to integrate Chinese memory from CXMT.

marsbit37m ago

SemiAnalysis Dissects Huawei's Kirin 9030: Process Technology Halted, So They Folded the Chip

marsbit37m ago

How Will the Price Move Before SpaceX's Next Share Unlock?

TL;DR Investors buying SPCX after SpaceX's IPO are not simply investing in a typical tech stock. It’s a high-valuation asset driven by Musk's narrative, Starlink, and space transport potential, but with a key twist: a very small initial float of ~4% has led to significant post-listing price appreciation. The current price action reflects a timing gap. Before the first lock-up expiration (estimated around August, subject to official confirmation), scarcity and high demand could continue to push prices up. Short-term bulls focus on low float, FOMO, and potential index inclusion. However, bears point to the supply dynamics that will change post-lockup. Existing shareholders still hold over 95% of shares, which will be released in stages starting from the first unlock window. This introduces future selling pressure from low-cost holders. The upcoming Q2 earnings report is a critical catalyst before the unlock. It will test whether the company's fundamentals can justify the current ~$2.1T valuation. Strong results could support the pre-unlock momentum, while weak figures could amplify concerns about future supply. The trading thesis is shifting from immediate scarcity ("can't buy enough") to evaluating future absorption capacity ("who will buy when more supply hits"). The path ahead hinges on the specifics of the unlock schedule, Q2 earnings performance, and whether anticipated passive index buying materializes.

marsbit57m ago

How Will the Price Move Before SpaceX's Next Share Unlock?

marsbit57m ago

Bitcoin Short-Term Bullish Structure Validated, HYPE Low-Entry Window Opens | Guest Analysis

**Market Analysis Summary (Week of June 2026)** **Overall Market Context:** The market environment is exceptionally complex, with the unexpected US-Iran agreement and the reopening of the Strait of Hormuz triggering a global asset repricing and significant volatility. This heightened noise underscores the importance of a structured analytical framework. **Bitcoin (BTC) Analysis & Strategy:** * **Current Status:** The price has climbed above $65,000, currently in a rebound phase (segment 38-39) following a complex 12-segment correction from the May high of $82,850. * **Key Levels:** * **Primary Resistance:** $69,500–$70,500. A successful breakout above $65,000 targets this zone. * **Primary Support:** $65,000 (immediate), followed by $59,000–$60,000 and $55,000. * **Weekly Outlook & Strategy:** The focus is on the confirmation of the $65,000 level. * **Bullish Scenario (Hold $65K):** A move toward the $69.5K–$70.5K resistance zone is anticipated, which is a potential area for initiating medium-term short positions. * **Bearish Scenario (Break below $65K):** A retest of the $60,000–$62,000 support range is likely. * **Medium-Term Strategy:** Currently neutral. Plan to establish short positions (up to 60% allocation) either in the $69.5K–$70.5K resistance zone upon signs of rejection, or on a confirmed breakdown below $65,000 and further below $59K–$60K. * **Short-Term Strategy:** Utilize 30% capital for scalping opportunities based on support/resistance levels, using 30/60-minute charts. **HYPE Analysis & Strategy:** * **Current Status:** The price has stabilized around $52 after a four-segment decline from the June high of $75.87 and is now in a rebound (segment 50-51). * **Key Levels:** * **Primary Resistance:** $62.50–$64.57. Watch for potential rejection here to form a lower high. * **Primary Support:** $52–$55.50, followed by $47–$49. * **Weekly Outlook & Strategy:** Adopt a "buy on dips, avoid chasing rallies" approach. * **Core View:** Monitor the price action and potential formation of a lower high ("endpoint 51") in the $62.50–$64.57 resistance zone. * **Short-Term Strategy:** Consider light long positions (max 30% allocation) if the price finds support and shows reversal signals in the $52–$54.50 or deeper $47–$49 support zones, confirmed by proprietary quantitative bottom signals. **Trade Review:** Last week's HYPE short-term long trade, executed based on proprietary "Price Difference" and "Momentum" model signals, yielded a profit of approximately 11.88%. The entry was near $54.39 and exit near $60.85. **Risk Management Reminder:** Always set an initial stop-loss upon entry. Move stop-loss to breakeven at +1% profit, then trail it upwards to lock in gains as the trade progresses. *Disclaimer: All analysis, models, and strategies are based on personal technical analysis for educational purposes only, not investment advice. The market carries inherent risk.*

Odaily星球日报1h ago

Bitcoin Short-Term Bullish Structure Validated, HYPE Low-Entry Window Opens | Guest Analysis

Odaily星球日报1h ago

Bitcoin Short-Term Bullish Structure Validated, HYPE Accumulation Window Opens | Guest Analysis

**Bitcoin and HYPE Market Analysis: Short-Term Outlook and Trading Strategies** This market analysis examines Bitcoin (BTC) and HYPE amid volatile conditions, providing short-term outlooks and specific trading strategies. **Key Outlooks:** * **Bitcoin (BTC):** Focus is on whether BTC's recent move above $65,000 holds. A successful breakout could lead to a test of the $69,500-$70,500 resistance zone, where medium-term short positions are considered. A failure, breaking below $65,000, may trigger a decline towards the $59,000-$60,000 support area. * **HYPE:** The token completed a four-wave correction and is now rebounding. The key resistance zone is $62.5-$64.57. The trading strategy is "buy on dips," looking for entry opportunities near the $52-$54.5 or deeper $47-$49 support zones, pending confirmation from proprietary models. **BTC Trading Strategy:** * **Medium-term:** Primarily looking to establish short positions (up to 60% allocated capital) if price rallies to the $69,500-$70,500 resistance area and shows signs of reversal. Alternative plans involve initiating shorts on a breakdown below $65,000. * **Short-term:** Allocate up to 30% capital for intraday "spread" trades based on support/resistance levels on 30/60-minute charts. **HYPE Trading Strategy:** * **Short-term:** Adopt a dip-buying approach. Consider light long positions (under 30% capital) when price tests key support levels ($52-$54.5 or $47-$49) and shows stabilization, confirmed by proprietary "Price Spread" and "Momentum Quant" models. **Trade Recap:** The analysis reviews a successful HYPE long trade from the previous week, executed at ~$54.39 and closed at ~$60.85 for an ~11.88% gain, based on signals from the aforementioned models. **Risk Management Emphasis:** The article stresses strict capital allocation (under 30-60%), immediate initial stop-loss placement, and a trailing stop-loss protocol to lock in profits as trades move favorably. ***Disclaimer:** All analysis, models, and strategies are for educational purposes based on technical analysis, not investment advice. Markets are volatile; trade with caution.*

marsbit1h ago

Bitcoin Short-Term Bullish Structure Validated, HYPE Accumulation Window Opens | Guest Analysis

marsbit1h ago

Trading

Spot
Futures

Hot Articles

Discussions

Welcome to the HTX Community. Here, you can stay informed about the latest platform developments and gain access to professional market insights. Users' opinions on the price of MEME (MEME) are presented below.

活动图片