If You’re Wondering When The Next Bitcoin Bull Run Will Begin, You Should See This Chart

bitcoinistPublished on 2026-02-17Last updated on 2026-02-17

Abstract

Market participants are searching for signals for Bitcoin’s next bull run. A chart by Joao Wedson, analyzing the Long-Term Holder Net Unrealized Profit/Loss (NUPL) metric, offers insight. Currently at 0.36, it shows long-term holders remain in profit, historically aligning with late bull markets or consolidation phases. The critical signal occurs when NUPL turns negative—marking unrealized losses even for resilient investors. These red zones have coincided with late bear markets, maximum pessimism, and cycle bottoms, preceding every major bull run. Since the metric remains positive, historical patterns suggest the final capitulation phase hasn't yet occurred, meaning the next bull run may not be imminent.

Market participants continue to search for reliable signals that can define the timing of Bitcoin’s next major expansion phase. While price forecasts, macro narratives, and ETF flows increasingly shape expectations, a chart published on February 16, 2025, by Alphractal founder and CEO Joao Wedson has added a new layer to that discussion. Focusing specifically on the profit positioning of long-term Bitcoin holders, this chart reveals a historic pattern about bull market timing.

What The Bitcoin Chart Tracks — And Why It Matters

In his post, Wedson presented a long-range chart built around the Long-Term Holder Net Unrealized Profit/Loss metric. The indicator measures the average unrealized gains or losses held by investors classified as long-term participants—wallets historically associated with stronger holding behavior and lower sell-side activity.

Related Reading: This Key Bitcoin Metric Signals That The Downside May Persist A Bit Longer

Rather than emphasizing short-term speculation, Wedson framed the metric as a lens into the financial condition of Bitcoin’s most resilient market cohort. According to the data shared, the current reading sits at 0.36. That level indicates long-term holders remain in aggregate profit, meaning their holdings, on average, are valued above acquisition cost.

Source: Chart from Joao Wedson on X

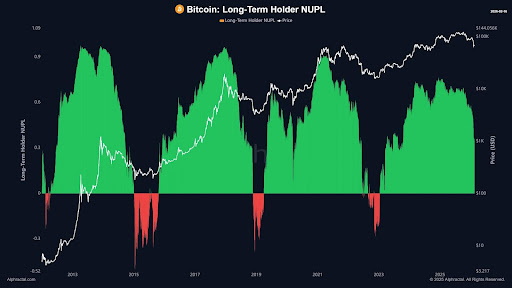
The chart visualizes this positioning through color-coded zones. Green regions represent periods where long-term holders hold unrealized profits. These phases have historically aligned with either late bull market environments or transitional consolidation ranges. The persistence of green, in Wedson’s presentation, signals that deep cycle stress has not yet fully materialized among conviction investors. By contrast, the most consequential signals in the chart appear when the metric shifts below zero.

When The Metric Turns Negative

Wedson’s analysis places primary emphasis on the moments when Long-Term Holder NUPL enters negative territory. In these intervals, even the most historically patient investors hold unrealized losses. The chart marks these periods in red, visually distinguishing them from profit-dominant phases.

Related Reading: Historical Pattern From 2017 Signals Bitcoin Price Crash To $35,000

Historically, those red zones have coincided with late bear-market conditions—periods characterized by widespread pessimism and compressed valuations. Wedson described this stage as one reflecting maximum market depression, where financial stress extends beyond speculative traders to reach long-term capital.

The chart’s historical mapping shows that these negative phases have preceded every major Bitcoin bull cycle. Each time the metric dropped below zero, it aligned with late-stage capitulation dynamics: seller exhaustion, reduced distribution pressure, and a transfer of coins toward entities with stronger holding capacity.

Within this framework, the red zone functions less as a signal of structural weakness and more as a reset phase. It marks the point where excess leverage and speculative positioning have been cleared, establishing conditions historically associated with cycle bottoms.

Wedson’s interpretation positions opportunity within these depression phases rather than during profit-heavy expansions. As illustrated in the chart, prior bull runs did not begin while long-term holders were comfortably in profit. They emerged after losses had permeated the cohort. With the metric still positive at 0.36, the chart suggests that, based strictly on historical precedent, the final capitulation preceding the next bull run has yet to occur.

BTC trading at $67,815 on the 1D chart | Source: BTCUSDT on Tradingview.com

Trending Cryptos

Related Questions

QWhat is the key metric discussed in the article that helps predict Bitcoin bull runs?

AThe key metric is the Long-Term Holder Net Unrealized Profit/Loss (NUPL), which measures the average unrealized gains or losses held by long-term Bitcoin investors.

QAccording to the chart, what does a negative Long-Term Holder NUPL value historically indicate?

AA negative NUPL value indicates that long-term holders are in unrealized losses, which historically coincides with late bear-market conditions, maximum market depression, and has preceded every major Bitcoin bull cycle.

QWhat is the current reading of the Long-Term Holder NUPL metric mentioned in the article?

AThe current reading of the Long-Term Holder NUPL metric is 0.36, indicating that long-term holders remain in aggregate profit.

QWhat does the article suggest about the timing of the next Bitcoin bull run based on the current NUPL data?

AThe article suggests that since the NUPL is still positive at 0.36, the final capitulation phase (where the metric turns negative) has not yet occurred, meaning the next bull run has not begun based on this historical pattern.

QWho created and shared the chart that is the focus of this article?

AThe chart was created and shared by Joao Wedson, the founder and CEO of Alphractal, on February 16, 2025.

Related Reads

STRC Hits Historic Low, Saylor's Perpetual Motion Machine Grinds to a Halt

STRC, the perpetual preferred stock issued by MicroStrategy to fund its Bitcoin purchases, hit a historic low of $85.32, a 17% discount to its $100 par value. Designed as a "digital credit engine" to trade stably near par and enable continuous share issuance for buying Bitcoin, its plunge signals a breakdown in this model. Three key factors drove the decline: 1. Bitcoin's price fell over 50% from its peak, trading around $63,000 amid hawkish Fed signals. 2. MicroStrategy's cash reserves were depleted after a $1.5 billion convertible note repayment, slashing the dividend coverage for STRC's 11.5% yield to ~7 months. The company then sold 32 BTC to cover dividends—Michael Saylor's first Bitcoin sale since 2022—damaging the "never sell" narrative. 3. A competing Bitcoin-backed preferred stock, Strive's SATA, offers a higher yield (~13%) and daily dividends, drawing investors away from STRC. The drop triggers a negative cycle: STRC below par halts ATM share issuances, cutting off a key funding source for Bitcoin buys and potentially forcing more BTC sales for dividends, further eroding confidence. While Saylor argues the model is mathematically sound—needing only 2.3% annual Bitcoin growth to sustain itself—the market is testing the resilience of the leveraged Bitcoin treasury strategy in a bear market. The STRC price now reflects rising skepticism about this financial machinery's durability during downturns.

marsbit14m ago

STRC Hits Historic Low, Saylor's Perpetual Motion Machine Grinds to a Halt

marsbit14m ago

A Guide to Grayscale’s ‘Bottom Fishing’: Using Cash Flow to Assess Cryptocurrency Value

**Title:** Grayscale's Guide to Bottom-Fishing: Valuing Cryptoassets Using Cash Flows **Summary:** This report by Grayscale Research presents a fundamental valuation framework for cryptocurrency assets, moving beyond pure speculation to analyze those with underlying cash flows. It distinguishes between "commodity-like" assets (e.g., Bitcoin) and "cash-flow" assets, primarily within DeFi. Using the leading decentralized lending protocol Aave as a case study, the analysis applies traditional financial methodologies like Discounted Cash Flow (DCF) and Price-to-Earnings (P/E) multiples. Key findings indicate that AAVE tokens are currently undervalued. Despite recent challenges, the protocol's strong revenue growth, ~50% net profit margin, and diversified treasury support a fundamental valuation range of $80-$100 per token (compared to a ~$75 market price at the time of writing). In a base-case scenario driven by stablecoin adoption and regulatory clarity, the fair value could rise to around $175 within a year. The report emphasizes that protocol success does not automatically translate to token value. It critically examines the "value capture" mechanisms—such as buybacks, burns, and staking rewards—that channel protocol profits to token holders. Furthermore, it addresses the legal and governance complexities of Decentralized Autonomous Organizations (DAOs), noting their difference from traditional corporate equity but highlighting how robust, transparent governance can align protocol economics with holder interests. The conclusion is that the crypto market is maturing, with capital increasingly flowing towards projects with demonstrable fundamentals, real adoption, and disciplined capital allocation, creating opportunities for value-based investors.

marsbit1h ago

A Guide to Grayscale’s ‘Bottom Fishing’: Using Cash Flow to Assess Cryptocurrency Value

marsbit1h ago

After semiconductors lead the gains, are funds buying into AI orders or a macroeconomic rebound?

After US-Iran talks led to a temporary ceasefire and framework for reopening the strategic Strait of Hormuz, U.S. stocks rose on June 18, with the Nasdaq gaining 1.9%. The semiconductor and AI hardware sectors outperformed. This rally stemmed primarily from reduced geopolitical risk, which lowered oil prices and inflation expectations, easing discount rate pressure on high-valuation growth stocks like tech. The key question is not whether tech rebounded, but the nature of the rebound. The market appears to be selectively repricing AI infrastructure plays rather than broadly chasing AI narratives. Gains were concentrated in chips, optical interconnects, memory, and domestic manufacturing—segments tied to tangible data center build-outs and capital expenditure. Intel's ~10% surge, fueled by a Trump statement about potential Apple collaboration, exemplifies this mixed dynamic. It reflects policy catalysts and domestic manufacturing sentiment more than confirmed fundamentals. Meanwhile, strong earnings from companies like Astera Labs (revenue up 93% YoY) provided concrete evidence of AI-driven demand in hardware. In essence, the rally represents a risk-premium recalibration. Lower Middle East tensions opened a valuation repair window, and capital flowed first into AI infrastructure segments with visible near-term revenue streams. The sustainability of this move hinges on upcoming Q2 earnings, specifically continued strength in cloud provider capex, AI server orders, and hardware company guidance. Policy hopes alone are insufficient; the cycle needs validation from orders and financials.

marsbit1h ago

After semiconductors lead the gains, are funds buying into AI orders or a macroeconomic rebound?

marsbit1h ago

Trading

Spot
Futures

Hot Articles

What is $BITCOIN

DIGITAL GOLD ($BITCOIN): A Comprehensive Analysis Introduction to DIGITAL GOLD ($BITCOIN) DIGITAL GOLD ($BITCOIN) is a blockchain-based project operating on the Solana network, which aims to combine the characteristics of traditional precious metals with the innovation of decentralized technologies. While it shares a name with Bitcoin, often referred to as “digital gold” due to its perception as a store of value, DIGITAL GOLD is a separate token designed to create a unique ecosystem within the Web3 landscape. Its goal is to position itself as a viable alternative digital asset, although specifics regarding its applications and functionalities are still developing. What is DIGITAL GOLD ($BITCOIN)? DIGITAL GOLD ($BITCOIN) is a cryptocurrency token explicitly designed for use on the Solana blockchain. In contrast to Bitcoin, which provides a widely recognized value storage role, this token appears to focus on broader applications and characteristics. Notable aspects include: Blockchain Infrastructure: The token is built on the Solana blockchain, known for its capacity to handle high-speed and low-cost transactions. Supply Dynamics: DIGITAL GOLD has a maximum supply capped at 100 quadrillion tokens (100P $BITCOIN), although details regarding its circulating supply are currently undisclosed. Utility: While precise functionalities are not explicitly outlined, there are indications that the token could be utilized for various applications, potentially involving decentralized applications (dApps) or asset tokenization strategies. Who is the Creator of DIGITAL GOLD ($BITCOIN)? At present, the identity of the creators and development team behind DIGITAL GOLD ($BITCOIN) remains unknown. This situation is typical among many innovative projects within the blockchain space, particularly those aligning with decentralized finance and meme coin phenomena. While such anonymity may foster a community-driven culture, it intensifies concerns about governance and accountability. Who are the Investors of DIGITAL GOLD ($BITCOIN)? The available information indicates that DIGITAL GOLD ($BITCOIN) does not have any known institutional backers or prominent venture capital investments. The project seems to operate on a peer-to-peer model focused on community support and adoption rather than traditional funding routes. Its activity and liquidity are primarily situated on decentralized exchanges (DEXs), such as PumpSwap, rather than established centralized trading platforms, further highlighting its grassroots approach. How DIGITAL GOLD ($BITCOIN) Works The operational mechanics of DIGITAL GOLD ($BITCOIN) can be elaborated on based on its blockchain design and network attributes: Consensus Mechanism: By leveraging Solana’s unique proof-of-history (PoH) combined with a proof-of-stake (PoS) model, the project ensures efficient transaction validation contributing to the network's high performance. Tokenomics: While specific deflationary mechanisms have not been extensively detailed, the vast maximum token supply implies that it may cater to microtransactions or niche use cases that are still to be defined. Interoperability: There exists the potential for integration with Solana’s broader ecosystem, including various decentralized finance (DeFi) platforms. However, the details regarding specific integrations remain unspecified. Timeline of Key Events Here is a timeline that highlights significant milestones concerning DIGITAL GOLD ($BITCOIN): 2023: The initial deployment of the token occurs on the Solana blockchain, marked by its contract address. 2024: DIGITAL GOLD gains visibility as it becomes available for trading on decentralized exchanges like PumpSwap, allowing users to trade it against SOL. 2025: The project witnesses sporadic trading activity and potential interest in community-led engagements, although no noteworthy partnerships or technical advancements have been documented as of yet. Critical Analysis Strengths Scalability: The underlying Solana infrastructure supports high transaction volumes, which could enhance the utility of $BITCOIN in various transaction scenarios. Accessibility: The potential low trading price per token could attract retail investors, facilitating wider participation due to fractional ownership opportunities. Risks Lack of Transparency: The absence of publicly known backers, developers, or an audit process may yield skepticism regarding the project's sustainability and trustworthiness. Market Volatility: The trading activity is heavily reliant on speculative behavior, which can result in significant price volatility and uncertainty for investors. Conclusion DIGITAL GOLD ($BITCOIN) emerges as an intriguing yet ambiguous project within the rapidly evolving Solana ecosystem. While it attempts to leverage the “digital gold” narrative, its departure from Bitcoin's established role as a store of value underscores the need for a clearer differentiation of its intended utility and governance structure. Future acceptance and adoption will likely depend on addressing the current opacity and defining its operational and economic strategies more explicitly. Note: This report encompasses synthesised information available as of October 2023, and developments may have transpired beyond the research period.

396 Total ViewsPublished 2025.05.13Updated 2025.05.13

What is $BITCOIN

Discussions

Welcome to the HTX Community. Here, you can stay informed about the latest platform developments and gain access to professional market insights. Users' opinions on the price of BTC (BTC) are presented below.

活动图片