Ethereum SuperTrend Reversal: Why The ETH Price Could Crash To $1,200

bitcoinistPublished on 2026-03-28Last updated on 2026-03-28

Abstract

An analyst, Leshka.eth, warns that Ethereum's price could crash to $1,200 based on a bearish SuperTrend reversal signal on the daily chart. This trend-following indicator has turned red, a pattern that has previously led to significant declines. This is the third such setup in the current cycle. The first instance in late 2025 resulted in a 45% crash from over $4,750 to below $2,750. The second occurrence in early 2026 saw ETH drop below $1,850. The critical support level to watch is $1,990; a break below this could trigger a drop of 45-48%, projecting a target around $1,200. Recent attempts to push past $2,300 resistance have been rejected, reinforcing the bearish outlook.

Ethereum’s latest price structure is beginning to look like a pattern that has previously led to steep declines, and one analyst believes the signal is already in play.

A technical breakdown shared by Leshka.eth on X points to a SuperTrend reversal on the daily timeframe, which is a setup that has always led to heavy drawdowns for ETH. The structure is not new, but the way it is forming again has raised concern. If all goes according to the laid out structure, then the ETH price could crash to as low as $1,200.

The SuperTrend Indicator Has Flipped Again

The SuperTrend indicator is a trend-following tool that plots dynamic support and resistance levels based on price volatility. This indicator has reversed bearish on Ethereum’s daily timeframe. According to chart analysis by Leshka.eth, this is the third time this setup has appeared in the current cycle, and the previous two instances ended in steep losses.

The first instance, which formed around the October and November 2025 period, saw Ethereum initially hold a support zone before breaking down. The collapse that followed measured approximately 45.03%, a selloff that wiped out a significant portion of the gains from earlier in the year. Notably, this selloff saw the ETH price fall from above $4,750 until it fell below $2,750.

Source: Chart from Leshka.eth on X

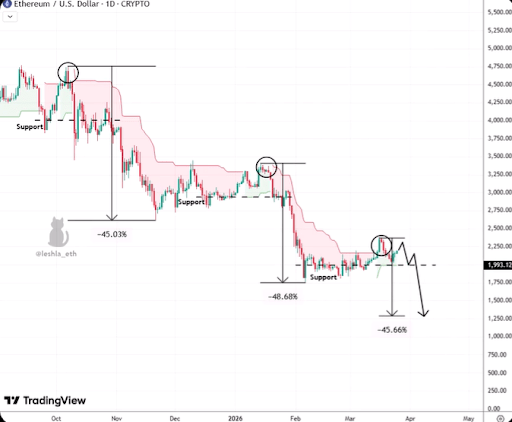
The second setup came about in early 2026. Again, the ETH price appeared to find footing at a support level in early January, but that support eventually gave way during the second half of the month. This eventually led to a decline that looked like the first episode in magnitude, with the ETH price falling below $1,850 in the first week of February 2026.

That same transition is now taking place again. The SuperTrend has turned red, and this places Ethereum in a condition that has always favored continuation to the downside.

The Line In The Sand

The outlook from this analysis places the important level to watch at $1,990. This is where the current SuperTrend reversal is forming, and it is the make-or-break zone for the near-term ETH outlook. The chart shows a dashed horizontal line as support around the $1,990 price level as the line in the sand that must not be broken.

Price has already attempted to push higher into resistance around $2,300, as seen in the chart above but those moves have been rejected. According to Leshka.eth, if $1,900 breaks, then the next target is the $1,200 zone.

The chart annotations point to drops of roughly 45% to 48% after similar setups, and applying that range to the current structure projects Ethereum’s next major zone around $1,200.

ETH price drops below $2,000 | Source: ETHUSDT on Tradingview.com

Related Questions

QWhat is the SuperTrend indicator and what does its recent reversal on Ethereum's daily timeframe signal according to the analyst?

AThe SuperTrend indicator is a trend-following tool that plots dynamic support and resistance levels based on price volatility. Its recent bearish reversal on Ethereum's daily timeframe signals a setup that has historically led to steep price declines for ETH.

QAccording to the analysis, what is the critical price level for Ethereum that must hold to avoid a further crash, and what is the projected target if it breaks?

AThe critical price level is $1,990. If this support breaks, the next projected target is the $1,200 zone.

QHow many times has this specific SuperTrend setup appeared in the current cycle, and what was the outcome of the previous two instances?

AThis is the third time this setup has appeared in the current cycle. The first instance resulted in a 45.03% decline, and the second instance also led to a significant drop of similar magnitude.

QWhat was the price range of Ethereum's decline following the first SuperTrend reversal setup mentioned in the article?

AFollowing the first setup, the ETH price fell from above $4,750 to below $2,750.

QWhat recent price action does the article cite as evidence that upward moves are being rejected?

AThe article states that the price has attempted to push higher into resistance around $2,300 but those moves have been rejected.

Related Reads

The Value Distribution of Stablecoins

**Summary: The Value Distribution of Stablecoins** The article argues that stablecoins are evolving from mere trading tools into broader channels for dollar access. It divides the stablecoin ecosystem into four layers to analyze how value is distributed: 1. **Issuance Layer:** Mints stablecoins, holds reserve assets, and captures the spread between reserve yield and user costs (e.g., Tether, Circle). This layer currently earns the largest profit margin. 2. **Infrastructure Layer:** Connects stablecoins to the traditional financial system, handling fiat on/off-ramps, banking integration, compliance (KYC/AML), and asset management (e.g., Bridge, BVNK). This is the "unglamorous" but critical work, building the essential bridges between crypto and real-world finance. 3. **Acquiring/Distribution Layer:** Integrates stablecoins into merchant systems, manages payment flows, and provides enterprise financial software (e.g., Stripe, Coinbase). They act as the access point for businesses. 4. **Application Layer:** The end-users and businesses that ultimately use stablecoins for payments, settlements, or as a store of value. They benefit from convenience but have little pricing power. The core thesis is that while the issuance layer currently dominates profits, the often-overlooked **infrastructure layer holds significant long-term potential**. The real challenge and barrier to mass adoption is not the on-chain transfer of stablecoins (which is simple), but the complex "last mile" integration into existing business workflows, banking systems, and regulatory frameworks across different countries. Companies in this layer are currently in a "land grab" phase, investing heavily to build networks, secure bank partnerships, and establish compliance pathways. While their position is currently pressured by the profitable issuers above and distribution platforms below, the article suggests that if stablecoins become a default financial rail for businesses, the infrastructure providers who have done the hard work of integration will ultimately gain strong pricing power and become entrenched, essential players.

marsbit6h ago

The Value Distribution of Stablecoins

marsbit6h ago

The Value Distribution of Stablecoins

The Value Distribution of Stablecoins The article argues that stablecoins are evolving from a mere trading tool into a broad "dollar channel." It analyzes the industry's value chain through four layers: 1. **Issuance Layer (e.g., Tether, Circle):** The top layer that mints stablecoins, holds reserve assets, and captures the thickest interest rate spread. 2. **Infrastructure Layer (e.g., Bridge, BVNK):** Connects stablecoins to the traditional financial system, handling critical but complex "dirty work" like fiat on/off-ramps, banking integration, compliance (KYC/AML), and cross-border settlement. 3. **Acquiring/Distribution Layer (e.g., Stripe, Coinbase):** Embeds stablecoins into merchant systems, manages payment flows, and integrates with enterprise software. 4. **Application Layer:** End-users and businesses that ultimately use stablecoins for payments, settlement, or storing value. The author posits that while the issuance layer currently captures the most profit, the most overlooked and potentially critical layer is infrastructure. The core challenge for stablecoin adoption isn't the on-chain transfer (which is simple), but bridging the gap between blockchain and the real-world financial system. This involves solving practical problems for businesses: fiat conversion, reconciliation, tax handling, and user onboarding. Infrastructure companies are currently in a difficult "land-grab" phase—building networks, securing banking relationships, and achieving compliance country-by-country. They face pressure from both the profitable issuance layer above and distribution platforms below. However, the author suggests this layer is building a crucial moat. Once stablecoins become a default business rail, the infrastructure players who have done the hard work of integration may gain significant, durable value and pricing power.

链捕手6h ago

The Value Distribution of Stablecoins

链捕手6h ago

Trading

Spot
Futures

Hot Articles

Discussions

Welcome to the HTX Community. Here, you can stay informed about the latest platform developments and gain access to professional market insights. Users' opinions on the price of ETH (ETH) are presented below.

活动图片