Ethereum Price Is Running The Same Playbook That Led To 10,000% And 4,000% Surges In The Past

bitcoinistPublished on 2026-03-27Last updated on 2026-03-27

Abstract

Ethereum price is holding above $2,000, showing resilience in bearish conditions. Analyst Merlijn The Trader identifies a recurring historical pattern in ETH's price chart that previously led to massive surges of 10,000% (2016-2018) and 4,000% (2018-2021). The pattern consists of three phases: consolidation, trendline retest, and parabolic rally. In the current cycle, ETH is consolidating in a $3,000-$4,000 range with a similar ascending trendline. The analyst suggests the cycle may be poised for another major breakout. If ETH holds above $2,000, a parabolic surge could follow; if not, a brief decline may occur before the anticipated rally.

The Ethereum price continues to hold above $2,000, demonstrating noteworthy resilience amid ongoing bearish market conditions. In light of this resilience, crypto market analyst Merlijn The Trader recently shared a new ETH analysis, identifying a recurring historical pattern that has served as a strong bullish signal for the cryptocurrency. According to the analyst, this pattern previously drove gains of over 10,000% and 4,000%, suggesting that a repeat could spark another major rally in this cycle.

Ethereum Price Chart Repeats Historically Bullish Pattern

In an X post published on Thursday, March 26, Merlijn The Trader shared a three-week price chart highlighting a unique pattern, which he says Ethereum has repeated almost perfectly three cycles in a row. He noted that during each cycle, the pattern unfolded in three distinct phases: a consolidation, a trendline retest, and a parabolic rally.

In the 2016-2018 cycle highlighted on the chart, the Ethereum price started near the lows of $3-$5. The cryptocurrency consolidated sideways for years in the red box zone between $11.5 and $27.5 while building a rising trendline of higher lows beneath it. When the price finally broke out of that trendline, it went parabolic, rising to roughly $1,400 in 2018, reflecting a massive 10,000% price rally. Following this, Ethereum experienced a major price collapse, wiping out almost 90% of its market value, which dragged its price back down to around $80-$100 by late 2018, completely resetting the cycle.

Source: X

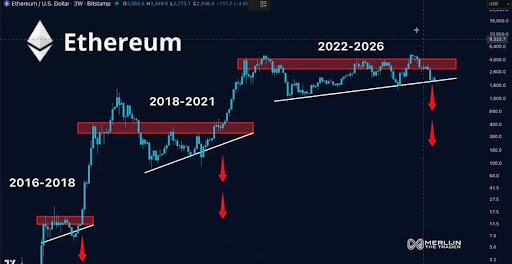
Similarly, in the 2018-2021 cycle, Ethereum started from lows around $80-$100, then recovered and slowly entered a long consolidation within the red box around $300-$400. Again, the cryptocurrency was building a rising trendline of higher lows beneath it. Once the cryptocurrency retested this trendline, the breakout was enormous, sending ETH all the way above $4,800 by late 2021 and marking a new all-time high.

This roughly 4,000% rally was also supported by a surge in DeFi activity and the NFT mania during the cycle. After this jump, Ethereum experienced a similar price collapse to the previous cycle, first dropping hard, then bouncing briefly, before finally crashing again to below $1,000 by mid-2022.

What This Means For The Current Cycle

In the current cycle, Merlijn The Trader’s price chart shows that Ethereum is mirroring past cycle trends exactly. The cryptocurrency has climbed back into a new, much higher red box zone around $3,000-$4,000, with the same ascending trendline forming underneath. The consolidation within this box has been prolonged and choppy, underscoring bearish market conditions and weakness.

Merlijn The Trader’s projection suggests that this cycle has already completed its consolidation and trendline reset and could now be on the verge of an explosive rally. The analyst outlined two possible scenarios for Ethereum’s next move. He predicts that if ETH continues to hold above $2,000, a breakout from the trendline could occur soon, potentially triggering the historical parabolic surge. However, if the cryptocurrency fails to maintain the $2,000 level, its price could decline once more before staging the anticipated rally.

ETH price moves toward $2,000 support | Source: ETHUSDT on Tradingview.com

Trending Cryptos

Related Questions

QWhat historical price pattern is the analyst Merlijn The Trader identifying for Ethereum?

AThe analyst is identifying a recurring pattern that consists of three distinct phases: a consolidation, a trendline retest, and a parabolic rally.

QWhat were the two previous major rallies in Ethereum's price that this pattern preceded, according to the analysis?

AThe pattern preceded a 10,000% rally to roughly $1,400 in the 2016-2018 cycle and a 4,000% rally to above $4,800 in the 2018-2021 cycle.

QIn the current cycle, what price zone is the 'red box' consolidation occurring in?

AIn the current cycle, the consolidation is occurring in a 'red box' zone around $3,000-$4,000.

QWhat is the two possible scenarios for Ethereum's next move, as outlined by the analyst?

AThe two scenarios are: 1) If ETH holds above $2,000, a breakout and parabolic surge could occur soon. 2) If it fails to hold $2,000, the price could decline further before the anticipated rally.

QWhat were the two major factors that supported the 4,000% rally in the 2018-2021 cycle?

AThe rally was supported by a surge in DeFi activity and the NFT mania during that cycle.

Related Reads

The Entire Internet Hails Noam's Joining, But OpenAI's Loss Bill Just Got Thicker

While the AI community celebrates Noam Shazeer, co-author of the "Attention Is All You Need" paper, joining OpenAI as Head of Architectural Research, the company's audited financials reveal a starkly different reality. In 2025, OpenAI reported $13.07 billion in revenue but a massive $20.92 billion operating loss. Even excluding a one-time accounting charge, the cash burn is severe, with $3.7 billion consumed in Q1 2026 alone. This high-profile hiring occurs against a backdrop of significant internal research talent drain, with key founders and researchers departing as the company's focus shifts from exploratory research to product iteration. Meanwhile, OpenAI's fundamental business model faces a deep crisis. It paid Microsoft $10.59 billion for compute in 2025, while its vast user base of 9 billion weekly actives includes only 50 million paying customers, making growth a direct driver of escalating costs. The article argues Shazeer's recruitment is less about technical necessity and more about crafting a compelling narrative for OpenAI's upcoming IPO, aiming to justify a rumored $1 trillion valuation to future public market investors. It contrasts OpenAI's strategy with Anthropic's reported path to profitability, which relies on a strong enterprise customer base and cost control, rather than star-powered narratives. Ultimately, the piece concludes that while Shazeer's architectural work may take 1-2 years to materialize, OpenAI's financial clock is ticking much faster, with its massive losses undercutting the celebratory headlines.

marsbit1h ago

The Entire Internet Hails Noam's Joining, But OpenAI's Loss Bill Just Got Thicker

marsbit1h ago

Market Trend (June 19): US-Iran Deal Drives Out Geopolitical Premium; Chip Stocks Soar to New Highs; Energy Sector Leads Declines

U.S. Market Trends (June 19): U.S.-Iran Deal Eases Tensions, Chip Stocks Soar, Energy Sector Leads Declines. U.S. stocks rallied on Thursday as the signing of a temporary U.S.-Iran deal in Geneva de-escalated Middle East tensions, with Saudi oil tankers transiting the Strait of Hormuz. This geopolitical relief helped markets recover from recent Fed-driven volatility. The S&P 500 rose over 1%, the Nasdaq gained nearly 2%, and the Dow Jones Industrial Average closed at another record high. The Philadelphia Semiconductor Index surged over 6% to a historic peak. Chip stocks were the standout performers. Reports of an Apple-Intel design and foundry deal for certain products, alongside mentions of potential Nvidia and SpaceX collaborations with Intel, propelled the sector. Intel surged ~10.5%, while memory chip makers like Micron also saw significant gains, highlighting sustained confidence in long-term AI capital expenditure. In contrast, the energy sector was the day's sole loser, with the S&P 500 energy sub-index declining as WTI crude fell ~2% to around $74.29/barrel. The reopening of key shipping routes erased prior geopolitical risk premiums. SpaceX extended losses for a second day on news of a potential large bond offering. Market volatility (VIX) dropped sharply, indicating a swift reversal of post-Fed jitters. Treasury yields dipped slightly but remained elevated. The focus now shifts to upcoming economic data, including next week's PCE inflation report and Micron's earnings, which will serve as a key test for the AI trade's durability.

marsbit2h ago

Market Trend (June 19): US-Iran Deal Drives Out Geopolitical Premium; Chip Stocks Soar to New Highs; Energy Sector Leads Declines

marsbit2h ago

Trading

Spot
Futures

Hot Articles

Discussions

Welcome to the HTX Community. Here, you can stay informed about the latest platform developments and gain access to professional market insights. Users' opinions on the price of ETH (ETH) are presented below.

活动图片