Author: Token Terminal
Compiled by: Saoirse, Foresight News
Ethereum serves as the core underlying settlement network for on-chain assets, relying on ETH for gas fees and staking to maintain network security. Traditional finance suffers from issues like slow settlement, multiple intermediaries, and high counterparty risk, while tokenized assets and stablecoins provide on-chain solutions. From 2025 to 2026, relevant regulations gradually matured, providing the necessary conditions for institutional on-chain business deployment.
Various stablecoins, tokenized funds, commodities, and on-chain stocks are issued and settled on Ethereum. Layer 2 networks offload transactions, which are ultimately confirmed on Layer 1, allowing ETH to continuously accumulate value. By market capitalization, Ethereum remains the world's largest platform for hosting tokenized assets, operated jointly by the Ethereum Foundation and the developer community. Teams like Etherealize specialize in connecting with traditional financial institutions, driving institutional capital inflows. In Q1 2026, the Ethereum ecosystem exhibited a divergent performance, which will be analyzed in detail below using complete data from Token Terminal.
The Q1 2026 market presented a stark dual dynamic: on-chain usage scale hit record highs—monthly active users, total transaction volume, and throughput all reached new peaks. However, asset valuations and fee metrics denominated in USD contracted simultaneously, with fully diluted market cap, total value locked (TVL), trading volume, and two types of fee data all declining sequentially. Key events this quarter profoundly shaped this unique market situation:
In January, only the second Blob parameter fork (BPO#2) of the Fusaka upgrade cycle was implemented, significantly increasing data storage capacity.
In February, the ERC-8004 standard launched on the mainnet, becoming the universal standard for AI agent identity and credit ratings.
The Ethereum Foundation defined three core protocol goals for 2026: scaling, improving user experience, and strengthening Layer 1 foundational security.
The Institutional Ethereum Forum was held in March, with significantly increased participation from traditional financial institutions.
Key Q1 2026 Metrics Overview
Ecosystem Total Value Locked (TVL): $316.2 billion (QoQ -11.0%, YoY +22.8%)
Ecosystem Active Outstanding Loans: $21.8 billion (QoQ -16.6%, YoY +39.0%)
Ecosystem Total Decentralized Exchange Volume: $134.5 billion (QoQ -24.0%, YoY -31.2%)
Total Application Fee Revenue for the Ecosystem: $2.0 billion (QoQ -16.9%, YoY -7.8%)
On-Chain Tokenized Asset Total Market Cap: $203.4 billion (QoQ -0.7%, YoY +42.9%)
Stablecoins: $178.9 billion (QoQ -2.3%, YoY +37.6%)
Tokenized Funds: $19.4 billion (QoQ +4.9%, YoY +73.1%)
Tokenized Commodities: $4.7 billion (QoQ +60.0%, YoY +325.9%)
Tokenized Equities: $365.1 million (QoQ +16.5%)
Monthly Active User Addresses: 13.2 million (QoQ +53.5%, YoY +85.9%)
Layer 1 Total Transaction Count: 200.4 million (QoQ +38.0%, YoY +81.5%)
Average Transactions Processed Per Second (TPS): 25.78 (QoQ +41.2%, YoY +81.7%)
Layer 1 Mainnet Transaction Fee Revenue: $39.9 million (QoQ -47.9%, YoY -81.9%)
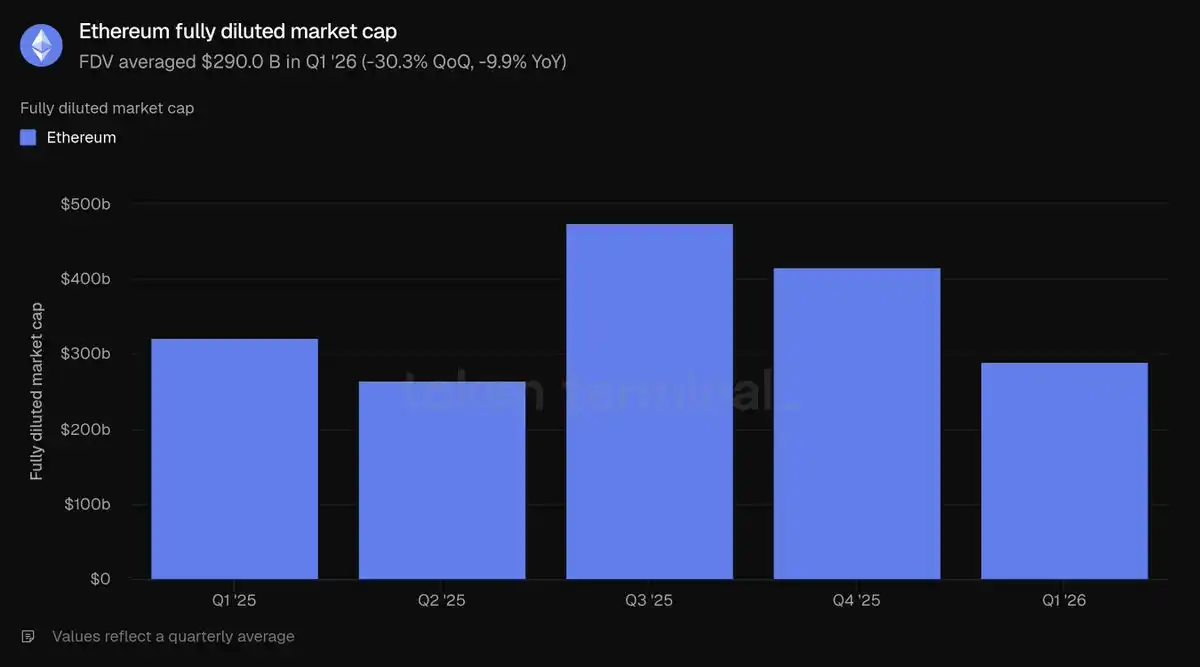
ETH Fully Diluted Market Cap: $290.0 billion (QoQ -30.3%, YoY -9.9%)
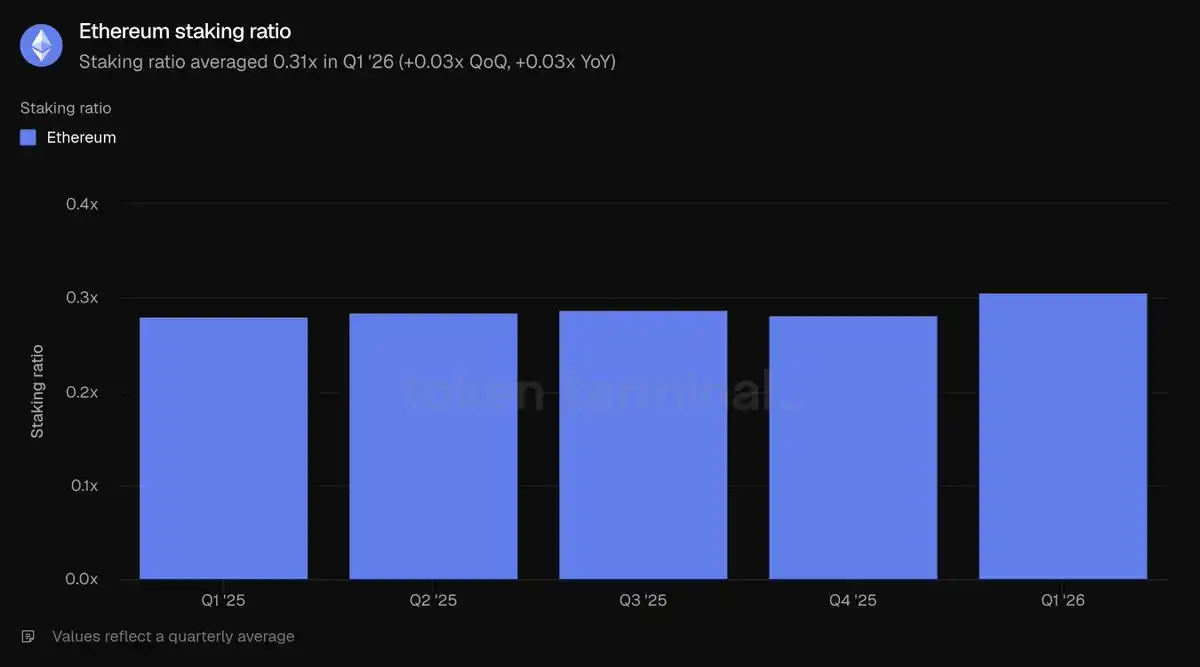
ETH Staking Ratio: 0.31 (QoQ and YoY both increased by 0.03)
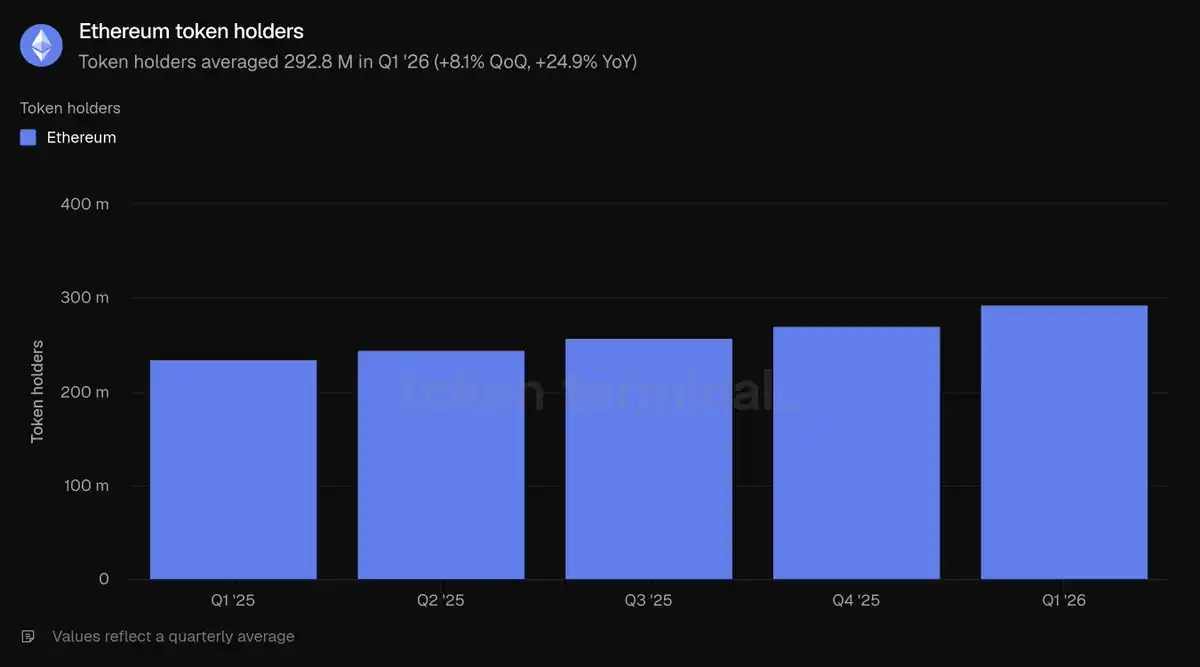
Total ETH Holding Addresses: 292.8 million (QoQ +8.1%, YoY +24.9%)
Note: This report's statistical scope is limited to the Ethereum Layer 1 mainnet. Layer 2 networks are considered independent blockchains, and their data is not included in the Ethereum statistics.
Overall Ecosystem Development
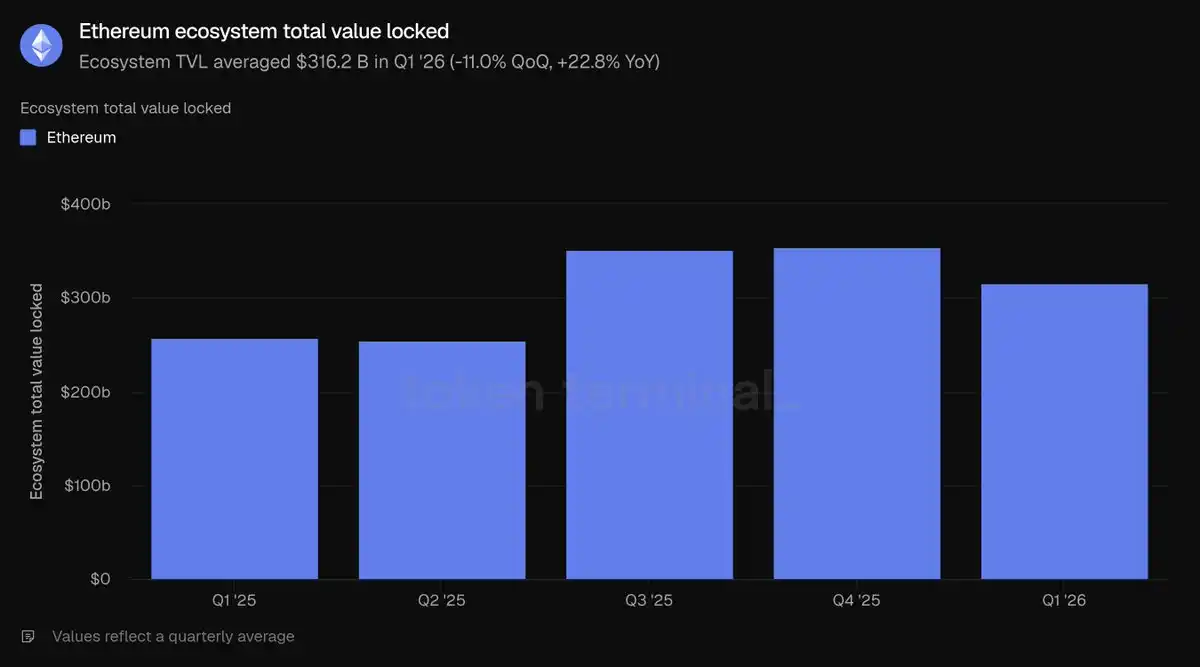
Total Value Locked refers to the total USD value of assets deposited into various on-chain applications. It is a leading indicator for revenue-generating businesses like lending, trading, and staking. This statistic measures on-chain deposited funds that users can withdraw at any time within the entire Ethereum ecosystem. In Q1 2026, the average TVL for the Ethereum ecosystem reached $316.2 billion, down 11.0% QoQ but up 22.8% YoY. The sequential decline was due to a general pullback in crypto asset prices, while the significant YoY growth demonstrates substantial expansion of the ecosystem scale compared to the same period last year.
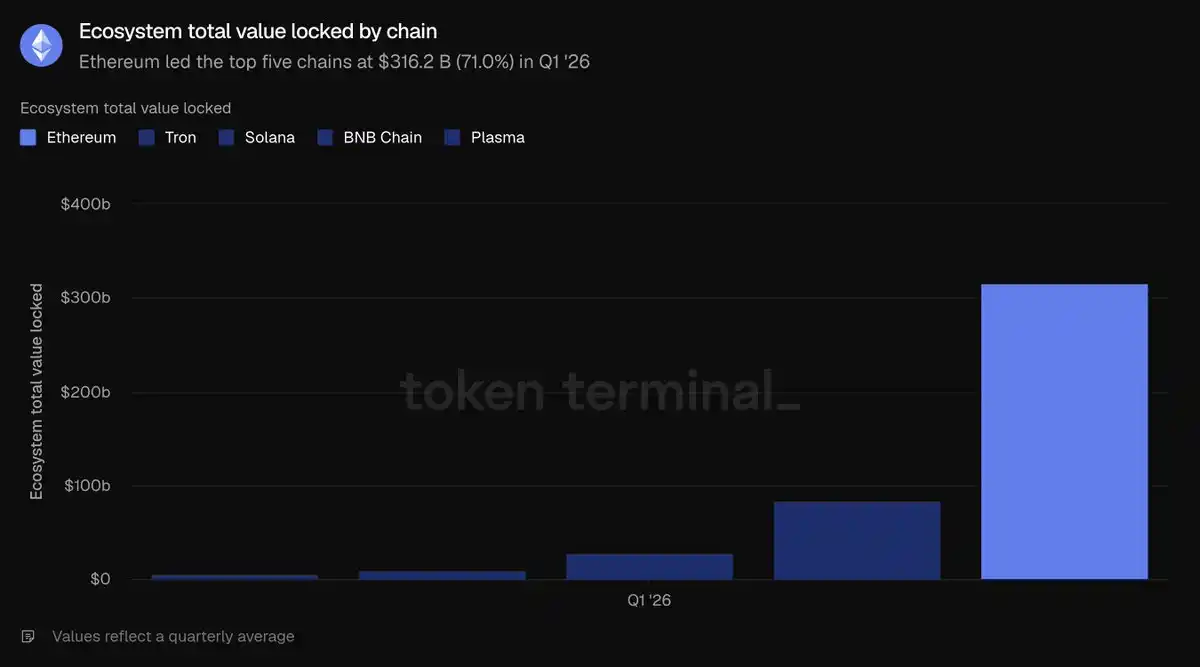
Among the top five blockchains, Ethereum's TVL leads by a wide margin: $316.2 billion far exceeds the combined TVL of Tron ($84.5B), Solana ($28.8B), BNB Chain ($10.3B), and Plasma ($5.7B), accounting for 71% of the total TVL across these five chains. Capital is primarily concentrated in two major sectors: the liquid staking sector led by Lido and the lending sector centered around Aave. Restaking protocols like EigenLayer and ether.fi, as well as synthetic dollar stablecoin platforms like Ethena and Sky, also hold significant capital. High capital concentration is Ethereum's most prominent structural advantage.
Active lending represents the deposit scale that users have borrowed out and that generates interest income, directly reflecting lending business revenue. This statistic measures the total outstanding loan amount across all Ethereum lending applications. In Q1, the ecosystem's average active lending volume was $21.8 billion, down 16.6% QoQ but up 39.0% YoY. The decline in outstanding loans accompanied the contraction in TVL, indicating a general cooling of market risk appetite, but the scale remains significantly higher than the same period last year.
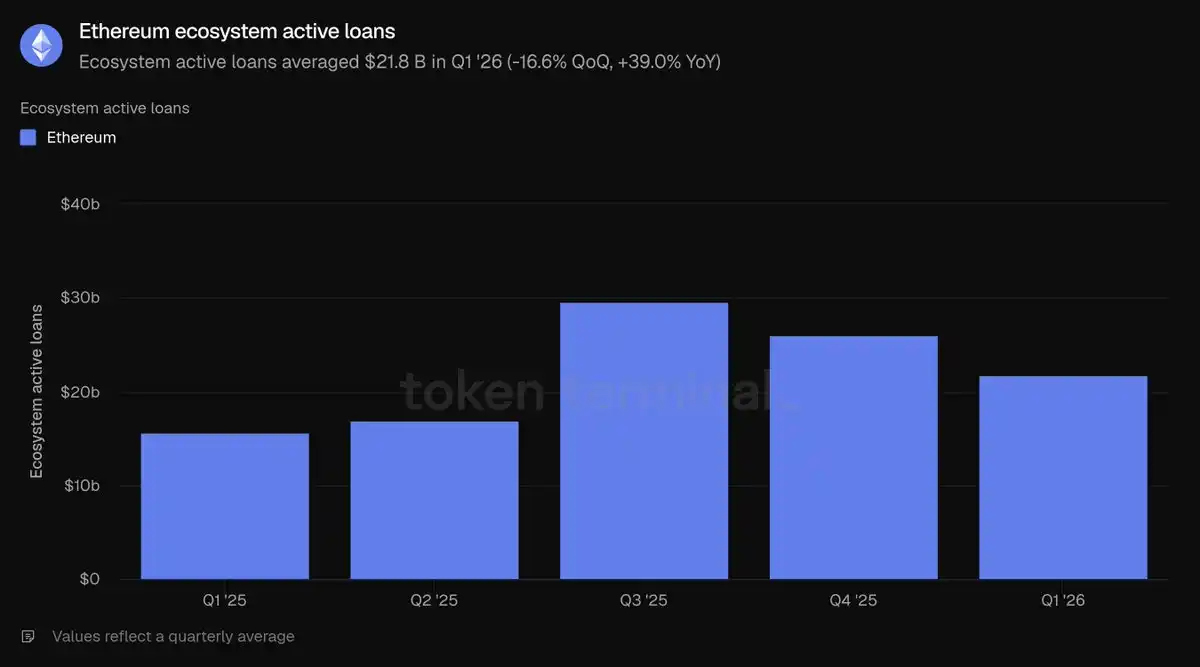
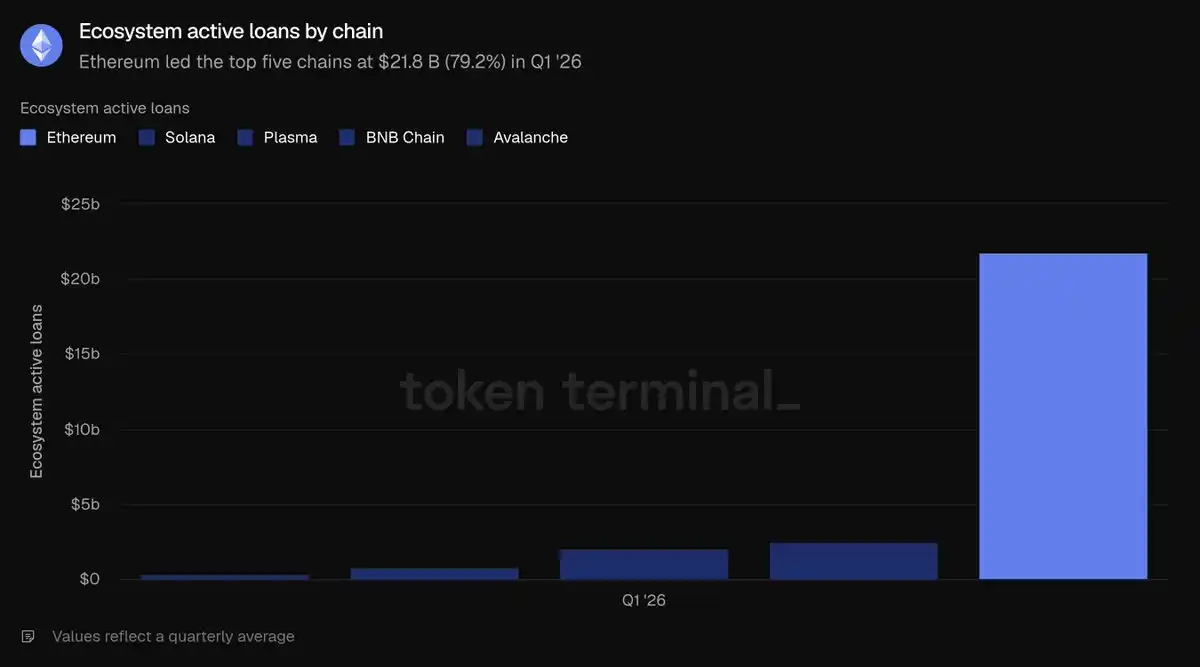
Ethereum's lending market is concentrated in a few liquidity pools, with Aave dominating: its active lending volume was approximately $13.5 billion at quarter-end, accounting for the vast majority of the ecosystem share. It was followed by Morpho (~$1.9B), Spark under Sky (~$1.0B), and Maple (~$0.84B). The contraction in lending scale this quarter was primarily driven by Aave, as the decline in crypto asset prices led to cooling borrowing demand, with its total loans shrinking by approximately 24%. Comparing across the top five chains, Ethereum's $21.8B in active lending significantly leads Solana ($2.5B), Plasma ($2.1B), BNB Chain ($0.761B), and Avalanche ($0.392B), capturing 79.2% of the total lending volume across these five chains. This is the sector where Ethereum holds the highest percentage among these five chains.
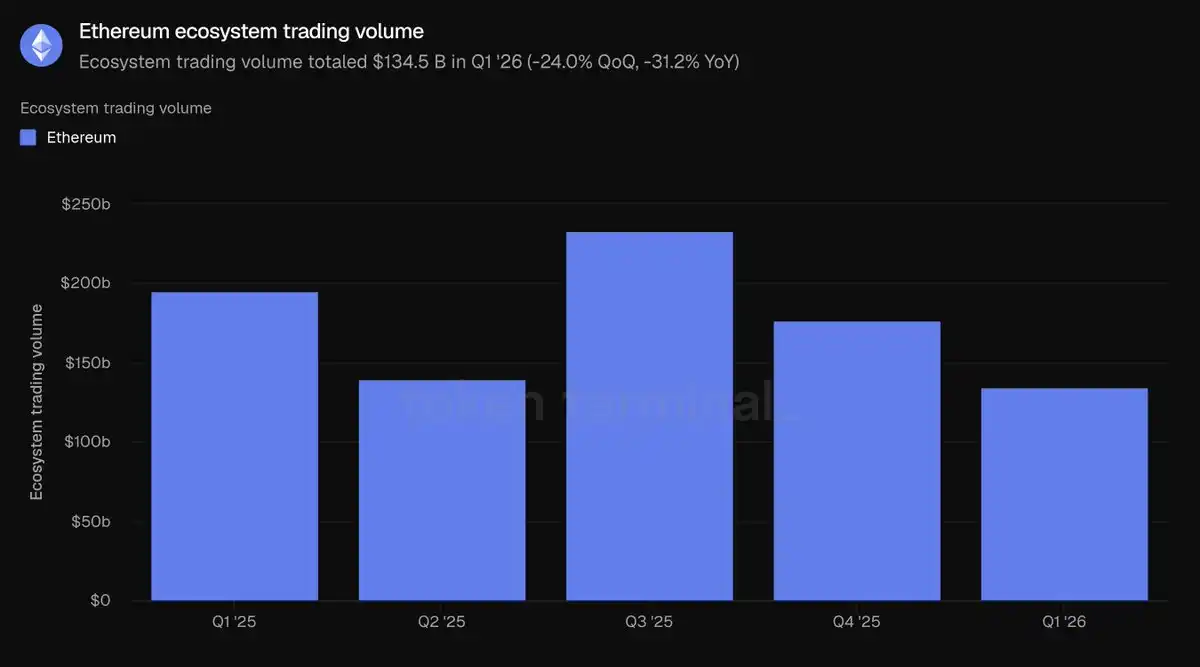
Decentralized exchange volume refers to the total transaction amount completed on on-chain spot exchanges. Traders pay fees when transacting, so trading volume is highly correlated with platform revenue. This data aggregates trading across all Ethereum DEXs. Total ecosystem volume in Q1 was $134.5 billion, down 24% QoQ and 31.2% YoY. The decline in trading volume exceeded the contraction in TVL, confirming a significant reduction in market risk appetite during this quarter's asset price downturn.
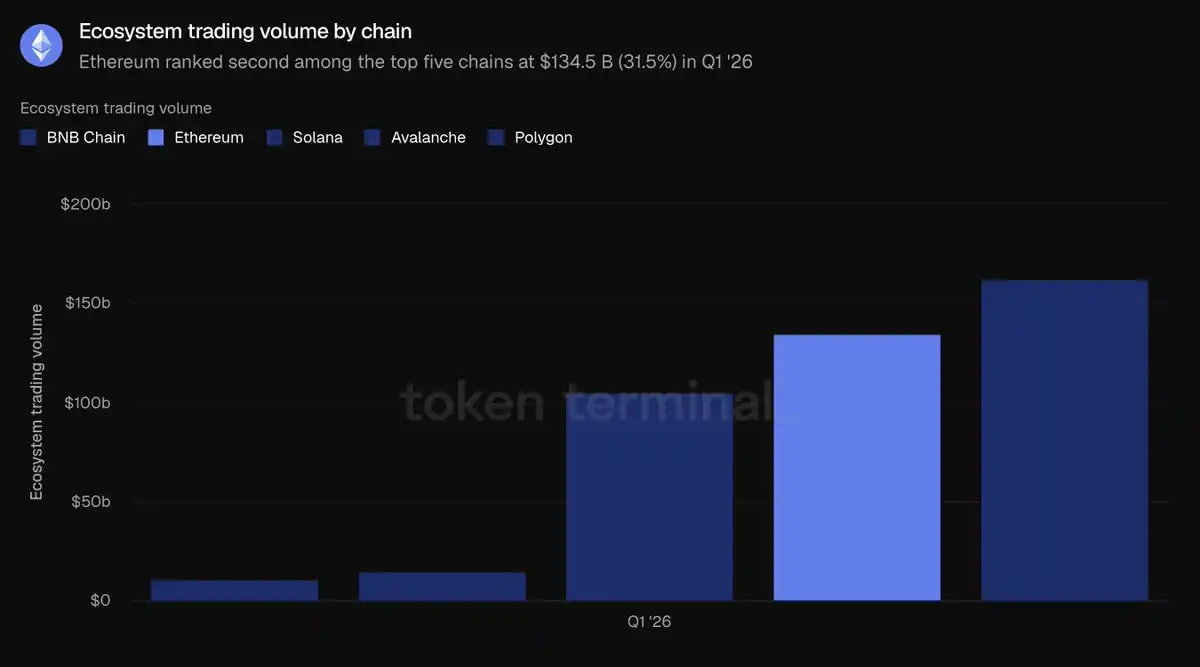
Ethereum DEX transaction flow is highly concentrated among leading platforms: Uniswap's Q1 volume was approximately $85.5 billion, accounting for two-thirds of the ecosystem total. It was followed by Curve (~$22.1B) and CoW Swap (~$12.4B). Trading volume is the only metric where Ethereum did not top the five major chains: BNB Chain's total volume of $162.5B was higher than Ethereum's $134.5B, followed by Solana ($104.9B), with Avalanche ($14.5B) and Polygon ($10.7B) trailing. Ethereum's volume accounted for 31.5% of the total across these five chains, second to BNB Chain's 38%.
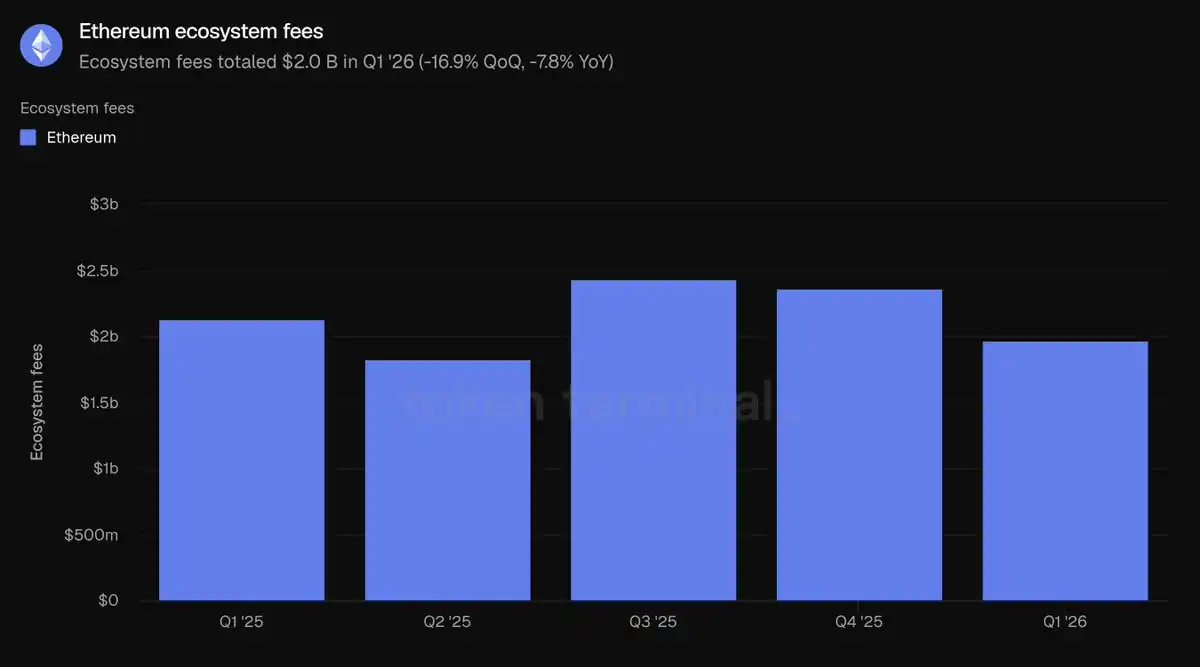
Ecosystem fees refer to all fees generated by users using various applications, including borrower interest and trader transaction fees, directly reflecting the economic value created by the ecosystem. This aggregates total fees from all Ethereum applications. Total ecosystem fees in Q1 amounted to $2.0 billion, down 16.9% QoQ and 7.8% YoY, declining in sync with reduced trading and lending activity.
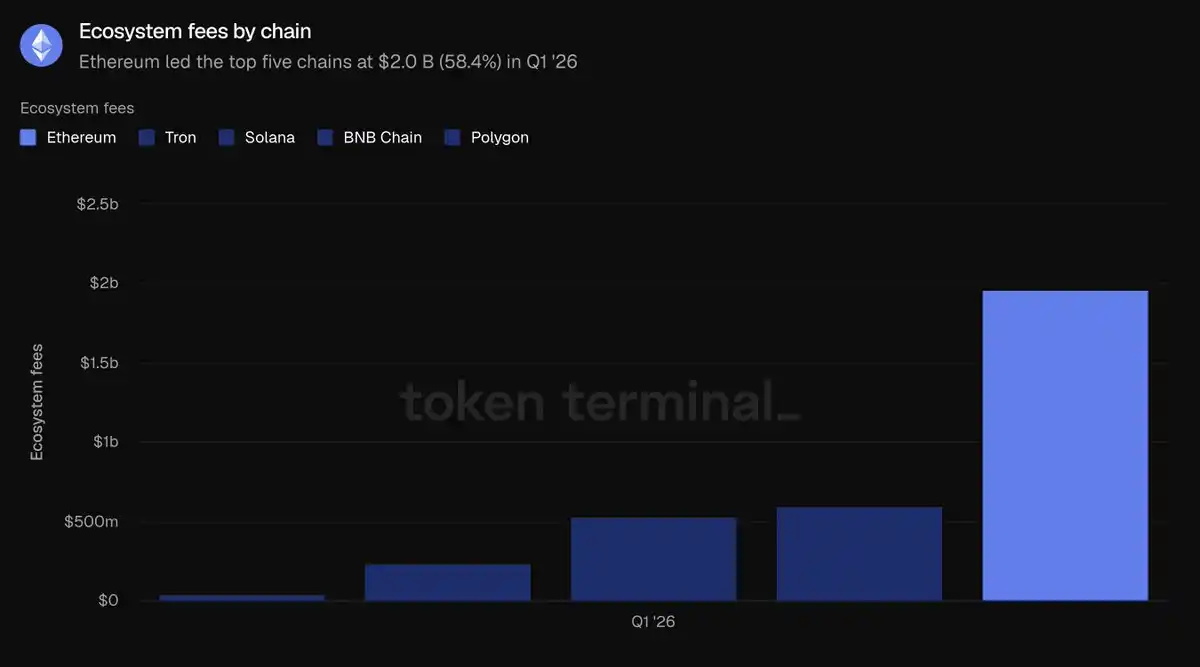
Ethereum's $2.0 billion in ecosystem fees far exceeds Tron ($0.599B), Solana ($0.533B), BNB Chain ($0.232B), and Polygon ($0.0388B), capturing 58.4% of the total fees across these five top chains. Even with the sequential decline, Ethereum remains the number one source of application fees in the industry. Summarizing all indicators in this section: Ethereum leads the industry in TVL, lending volume, and ecosystem fees, trailing only in DEX trading volume compared to BNB Chain.
Tokenized Asset Sector
Circulating asset market cap refers to the total value of on-chain tokenized assets, calculated as circulating supply multiplied by the closing price. For stablecoins, it is the total circulating issuance; for tokenized funds, it is the on-chain assets under management (AUM); for tokenized equities, it is the total value of on-chain issued shares. This section only counts assets issued on Ethereum.
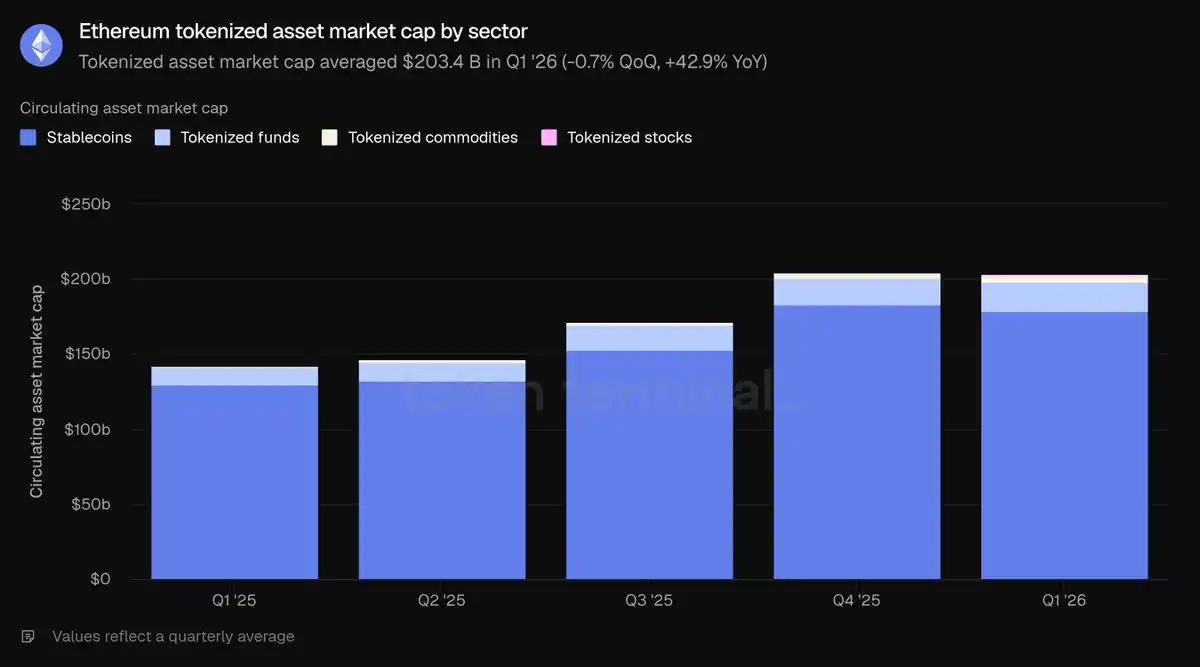
In Q1, the average total market cap for Ethereum tokenized assets was $203.4 billion, roughly flat QoQ (down only 0.7%) but up significantly by 42.9% YoY. Stablecoins account for 87.9% of the total, with the remaining share divided among tokenized funds, commodities, and equities.
Stablecoins
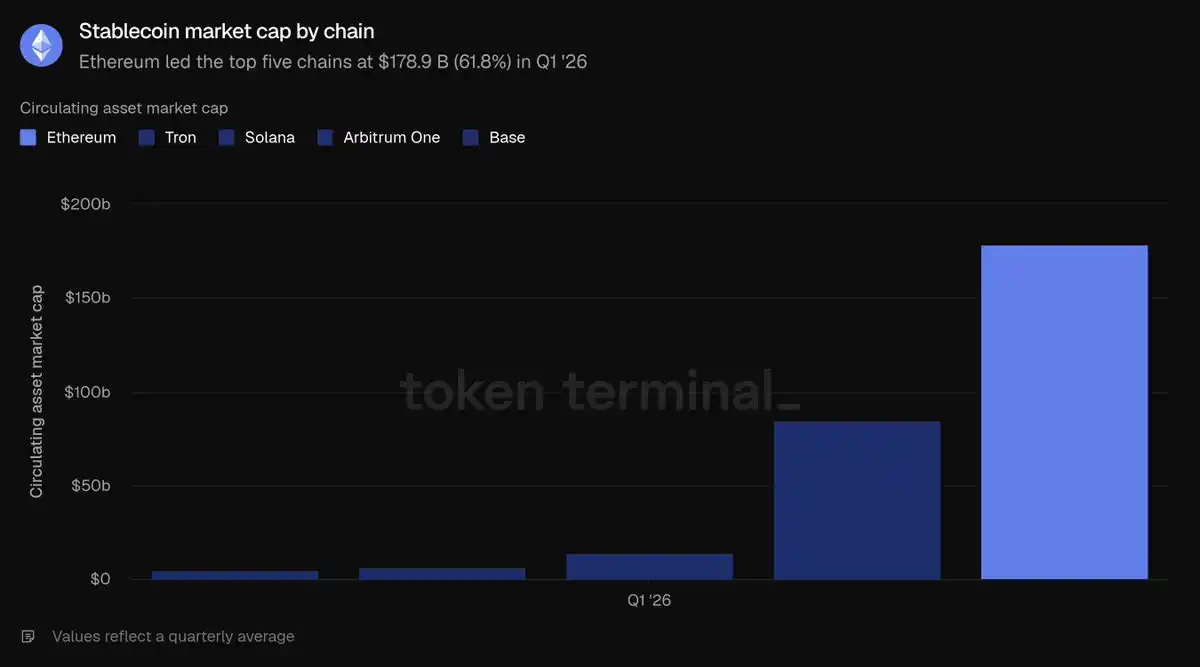
The average scale of Ethereum stablecoins in Q1 was $178.9 billion, down slightly by 2.3% QoQ but up 37.6% YoY, making it the only tokenized sub-sector that contracted sequentially. The market is dominated by two major issuers: at quarter-end, Tether's USDT ($94.1B) and Circle's USDC ($54.5B) combined held the vast majority of Ethereum's stablecoin market cap. Other leading products include Sky's USDS ($12.4B), Ethena's USDe ($5.9B), and PayPal's PYUSD ($2.9B). New compliant stablecoins like Ripple's RLUSD ($1.1B) have also launched. Comparing across the top five chains, Ethereum's $178.9B stablecoin scale leads Tron ($84.5B), Solana ($14.5B), Arbitrum One ($6.8B), and Base ($4.7B), accounting for 61.8% of the total stablecoin supply across these five chains.
Tokenized Funds
The average scale of Ethereum tokenized funds in Q1 was $19.4 billion, up 4.9% QoQ and surging 73.1% YoY. This sector is divided into two main types:
Yield-bearing on-chain dollar products (largest by scale): Sky's sUSDS (~$6.4B), Ethena's sUSDe (~$3.5B).
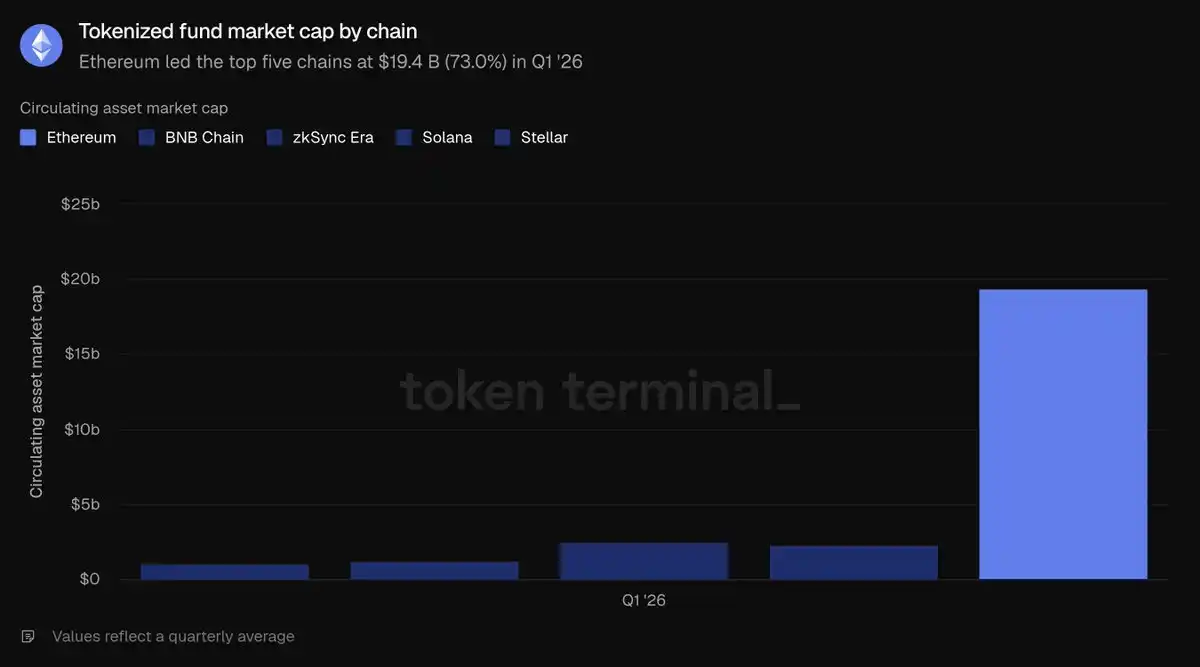
Traditional finance compliant funds (core vehicles for the institutional narrative): BlackRock's BUIDL (issued via Securitize, ~$1.0B), WisdomTree's government money fund (~$0.815B), Superstate's USTB (~$0.62B), with Ondo's OUSG (~$0.32B) following closely. Comparing across the top five chains, Ethereum's $19.4B in tokenized funds significantly leads ZKsync Era ($2.5B), BNB Chain ($2.3B), Solana ($1.3B), and Stellar ($1.1B), capturing 73% of the total. This is Ethereum's second most dominant tokenized asset sector.
Tokenized Commodities
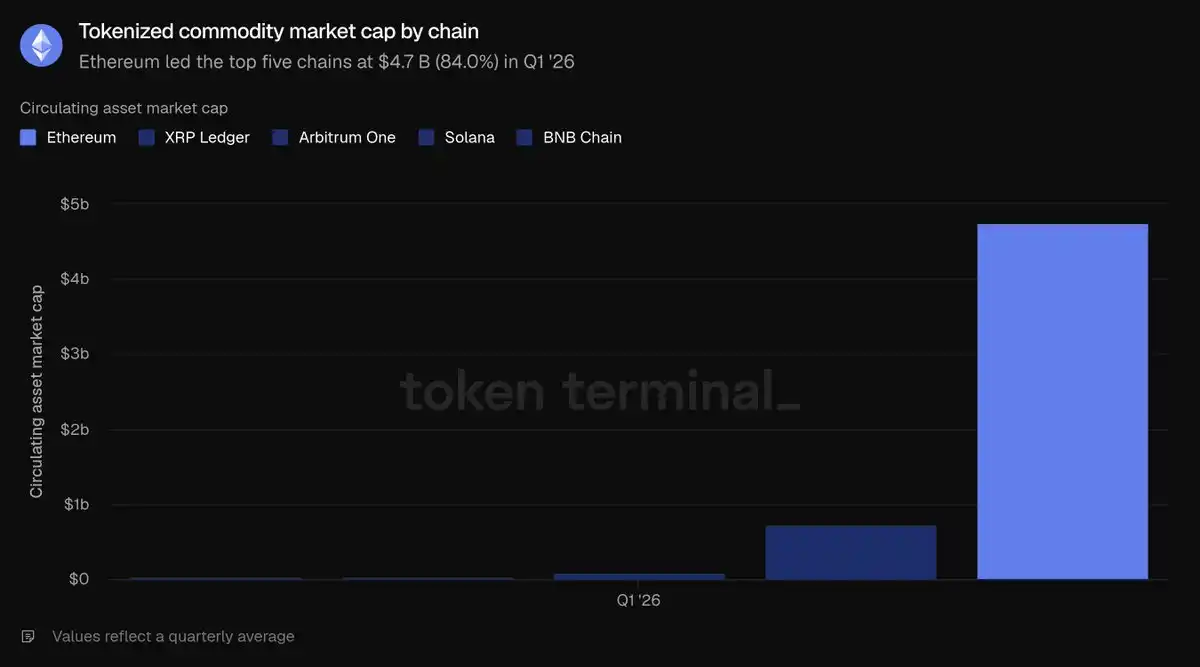
The average scale of Ethereum tokenized commodities in Q1 was $4.7 billion, up 60% QoQ and surging 325.9% YoY, making it the fastest-growing tokenized category. This sector consists almost entirely of on-chain gold: Tether's gold XAUT (~$2.6B) and Paxos' gold PAXG (~$2.4B) together hold nearly the entire sector share. Comparing across the five relevant public chains, Ethereum's $4.7B scale far exceeds Ripple ($0.737B), Arbitrum One ($0.0959B), BNB Chain ($0.0384B), and Solana ($0.0298B), accounting for 84% of the total. This is the most dominant sub-sector for Ethereum.
Tokenized Equities
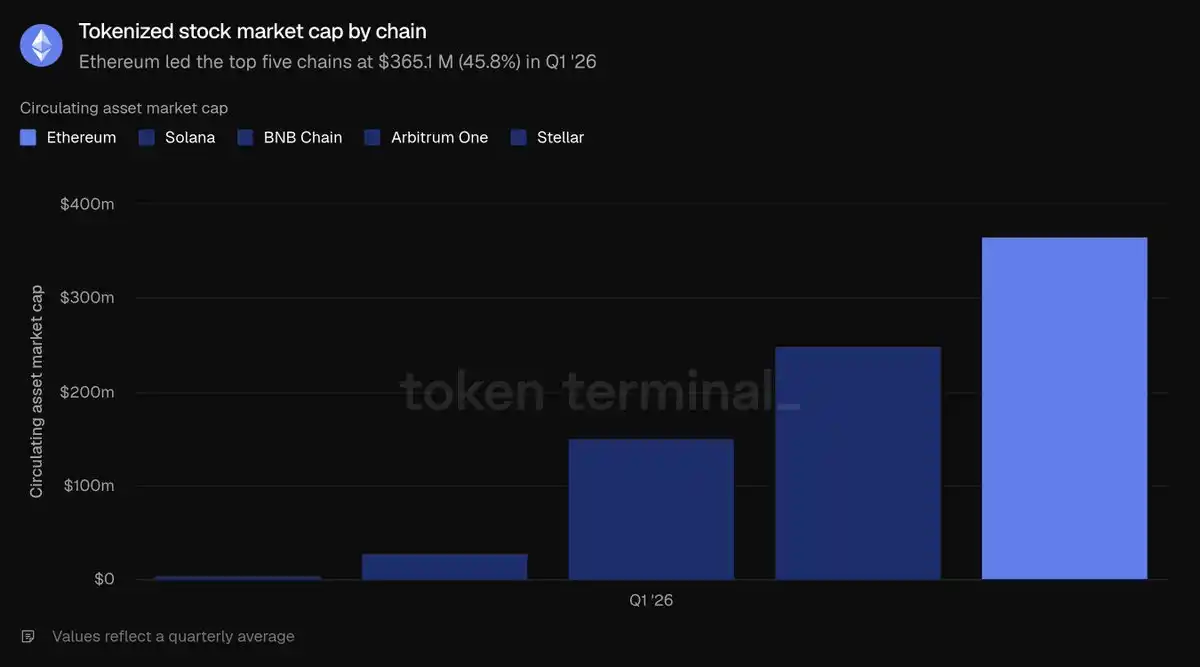
Tokenized equities are the smallest sub-sector by scale. In Q1, Ethereum's average scale was $365.1 million, virtually zero a year ago, representing a 16.5% increase QoQ. This sector is almost exclusively dominated by Ondo Finance, which issues S&P 500, NASDAQ-100 broad index, and dozens of individual stock on-chain assets, constituting the vast majority of Ethereum's tokenized equity market cap. Comparing across the five major chains, Ethereum's $365.1M slightly leads Solana ($249M), BNB Chain ($150.5M), Arbitrum One ($29M), and Stellar ($4.2M), capturing only 45.8% of the total tokenized equity supply across these five chains. This is the only tokenized asset sector where Ethereum does not hold an absolute majority share.
Summarizing the tokenized asset sector: Stablecoin balances slightly retreated in Q1, but Ethereum's dominant positions in tokenized funds and commodities continue to solidify.
On-Chain Usage Activity
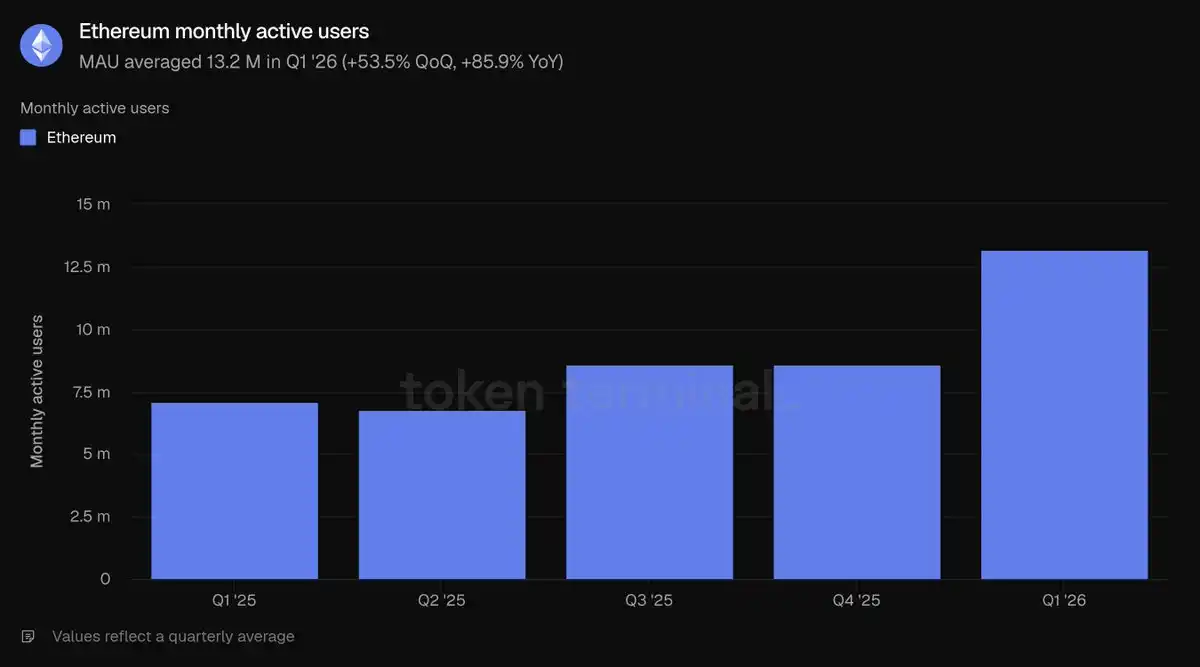
Monthly active users are defined as unique addresses that generate revenue-generating on-chain transactions each month. This metric only counts addresses interacting with the Ethereum Layer 1 mainnet. The average MAU in Q1 was 13.2 million, surging 53.5% QoQ and up 85.9% YoY, hitting a record high and ending the slow growth trend of previous quarters, with user growth accelerating significantly.
Total transaction count refers to the number of transactions written to and confirmed on the blockchain, reflecting the heat of user on-chain interaction. Transactions per second (TPS) is the average confirmation rate within a period, measuring the network's real-time capacity. Both metrics only count the Ethereum Layer 1 mainnet. In Q1, Layer 1 processed 200.4 million transactions, up 38% QoQ and 81.5% YoY. Average TPS increased to 25.78, up 41.2% QoQ. Both figures hit new record highs, proving that user growth has effectively translated into real on-chain business volume.
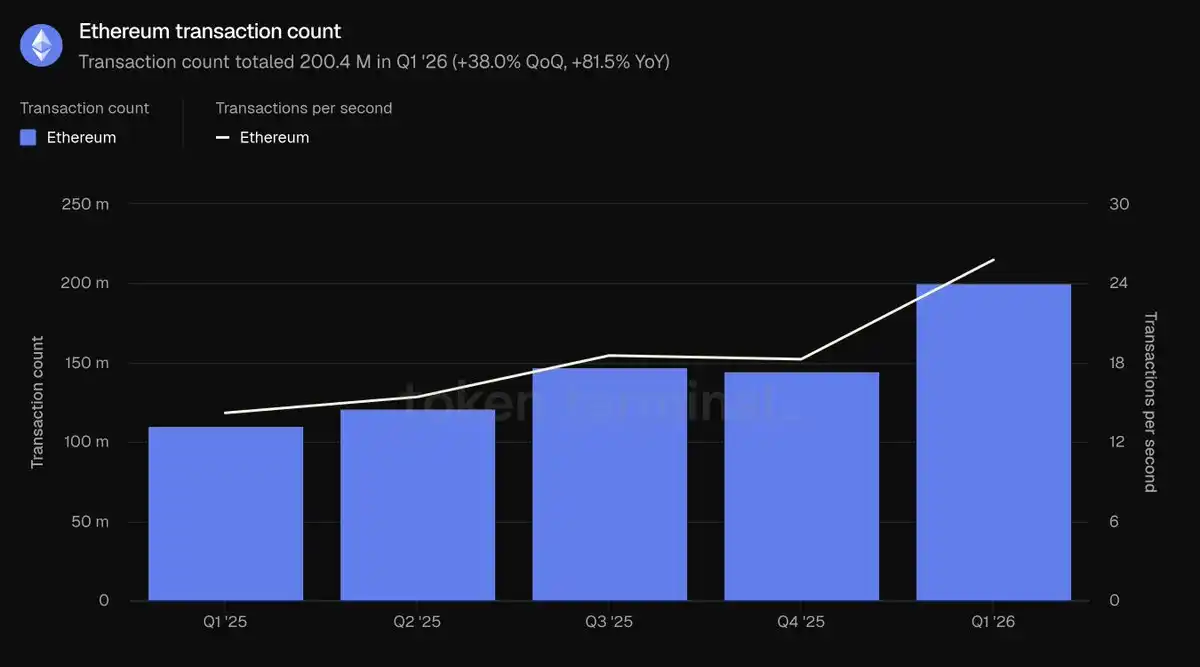
Here, 'fees' specifically refer to the base network cost users pay for initiating transactions on Ethereum Layer 1, distinguished from the total ecosystem application fees in Part 2. Total Layer 1 transaction fees in Q1 were $39.9 million, plummeting 47.9% QoQ and 81.9% YoY. The core data contrast this quarter is heightened activity alongside a sharp drop in fees: transaction volume increased 38%, but total fees contracted by nearly half. The primary reason is that the Blob scaling upgrade significantly increased block storage capacity. With ample block space supply, the cost per transaction has notably decreased.

The key conclusion of this section is the realization of scaling benefits: user and transaction counts simultaneously hit new highs while overall network usage costs declined. When network throughput expansion outpaces the growth rate of market transaction demand, the characteristics of 'increased activity and decreased fees' emerge.
Native Token ETH Fundamentals
Fully Diluted Market Cap calculation logic: ETH token price × total supply under the current tokenomics model (including circulating, locked, unlocked, and yet-to-be-issued tokens). The average ETH FDMC in Q1 was $290.0 billion, down sharply by 30.3% QoQ and 9.9% YoY, marking the largest sequential decline among all valuation metrics in the report and the core factor driving the decline in USD-denominated asset scale across the ecosystem.
Staking Ratio: The ratio of the total value of ETH staked to secure the Proof-of-Stake network to the overall ETH market cap; 0.31 indicates that approximately 31% of ETH's market cap is participating in staking. The average staking ratio in Q1 was 0.31, higher than the 0.28 of the previous quarter and the same period last year. Even as ETH's overall market cap corrected significantly, the proportion of tokens participating in network security staking continued to rise, indicating stable long-term staking willingness among users during the price downturn.
Token Holder Metric: The total number of unique wallet addresses holding ETH. The average number of ETH holding addresses in Q1 was 292.8 million, up 8.1% QoQ and 24.9% YoY, increasing steadily for five consecutive quarters. Against the backdrop of a continuously declining FDMC, the expansion of holding addresses represents a further dispersion of the ETH holder base, indicating that ordinary users' willingness to position themselves has not cooled with short-term market conditions.
Etherealize Team Commentary and Analysis
The most critical contradiction this quarter: Ethereum Layer 1 mainnet on-chain usage scale hit record highs, while network transaction fees simultaneously declined. Ethereum proactively pursued network scaling, sacrificing short-term fee revenue with the long-term logic being: cheaper block space will unlock vast potential market demand, ultimately driving long-term network revenue growth.
Data from Token Terminal's "Ethereum Q1 2026 Report" proves this long-term logic is being realized: on a YoY basis, MAU grew 85.9%, transaction volume increased 81.5%, and network throughput rose 81.7%. This is a classic manifestation of the Jevons Paradox. The team predicts that the long-term incremental demand for network-wide transactions will fully offset the short-term revenue loss from lower per-transaction fees. Drawing an analogy to the semiconductor industry: when Gordon Moore proposed Moore's Law in 1975, industry revenue was limited; today, industry revenue has grown by several orders of magnitude. Scaling benefits are not yet fully realized: the Q3 Glamsterdam upgrade plans to increase the Gas limit by more than threefold. Ethereum's long-term roadmap envisions achieving tens of thousands of TPS by 2029, building a high-speed Layer 1 chain with second-level finality.
The team agrees with BlackRock CEO Larry Fink's view from last December: the current stage of the tokenization industry is equivalent to that of the internet in 1996—when Amazon's online book sales were only $16 million. At the time, the market generally believed Amazon was just an online bookstore surviving on the internet bubble and sustained losses. But Jeff Bezos predicted the internet would completely reshape retail, forgoing short-term profits to build network effects and scale advantages. Ethereum is now making a similar trade-off to solidify its position as the global financial settlement layer.
Internet development offers another crucial lesson: open, permissionless networks will ultimately defeat closed, proprietary networks. In his 1995 book "The Road Ahead," Bill Gates predicted that digital commerce would rely on corporate proprietary private networks—"information superhighways"—rather than the open internet. At the time, Microsoft's MSN, America Online, CompuServe, and Prodigy operated closed walled gardens with millions of paying users. France's Minitel terminal system had more users than the global internet until late 1996. But all these closed systems ultimately failed. No established large enterprise wants to build its business on a network controlled by a competitor. More critically, no single company can perpetually keep up with the innovation speed of a permissionless, open ecosystem. History repeatedly confirms this pattern: Linux surpassing proprietary Unix systems, the open web replacing corporate intranets, Wikipedia replacing Encyclopaedia Britannica. At the start of each shift, proprietary products often gain first-mover advantages with more precise features, ample marketing, and business resources. But when the open ecosystem accumulates sufficient development tools, developers, and neutral, trustworthy attributes, first-mover advantages rapidly dissolve.
This industry dynamic is now replaying in the financial infrastructure domain. All data in this report serves as evidence that Ethereum has crossed the critical ecosystem threshold: it holds commanding market share across all core sectors. Institutions choosing Ethereum for tokenized finance deployment is not due to ideological preference but because ecosystem liquidity, composability, and mature institutional use cases have concentrated here. Report data shows: Ethereum captures 79.2% of DeFi active lending, 61.8% of stablecoins, 73% of tokenized funds, and 84% of tokenized commodities market share across the top five chains. Each new type of tokenized asset further thickens ecosystem liquidity, continuously attracting more institutions. A neutral, unbiased base layer is the only stable equilibrium solution for the industry—major financial institutions will never unanimously choose a competitor's private chain for asset settlement. Furthermore, institutions are gradually realizing that private interactions, access restrictions, KYC compliance, and asset transfer controls can be implemented via privacy-preserving computation environments and permissioned token standards atop Ethereum while fully accessing the network's public liquidity. Conversely, closed private chains cannot tap into the vast liquidity and diverse applications of the open ecosystem.
Following the quarter, institutional deployment has accelerated. In May alone, several significant developments occurred: In asset management: BlackRock filed for two new tokenized funds; JPMorgan launched its second Ethereum on-chain money market fund, JLTXX; Fidelity International launched Moody's AAA-rated US dollar liquidity fund FILQ as an ERC-20 token. In stablecoins: Japan's Blockchain Foundation's yen stablecoin EJPY is set to deploy on Ethereum; a consortium of 12 major European banks (including BNP Paribas, ING, UniCredit, BBVA, etc.) is preparing a compliant euro stablecoin.
The internet seemed distant in 1990 but became a societal necessity by 2005. If Fink's assessment of the tokenization industry's stage is accurate, the coming years may be the most opportune phase in Ethereum's development history. The team's previous "Efficient Money" report proposed a core thesis: Network fees build an intrinsic value floor for ETH. The long-term optimistic logic is that, relying on more robust monetary properties, ETH has the potential to capture the monetary storage value premium of gold and Bitcoin, totaling over $30 trillion. Ethereum can establish its leading industry position without relying on high transaction fees.