dogwifhat [WIF] is staging a comeback after spending most of the year subdued, with the memecoin down 38% on a year-to-date basis yet up 16% over the past day.
Market analysis shows that a stronger rally could still take shape once the asset overcomes the key structural level that could keep its price from staging a surge.
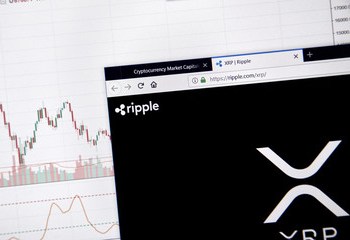
A descending resistance line caps WIF’s rally
The major obstacle standing between WIF and a sizeable rally remains the descending resistance line that price has only marginally crossed.
The breakout cannot be confirmed as bullish yet. WIF’s price has not closed above the descending line, nor has it continued along the bullish path it began carving out days earlier.

For context, this same resistance has repeatedly capped WIF’s advances and forced the token to trade lower thrice in a row, even though each run leading into the level delivered double-digit gains.
A failure to push higher would leave WIF trudging beneath the resistance line for an extended period, adding to the 48 days it has already spent trading below this barrier.
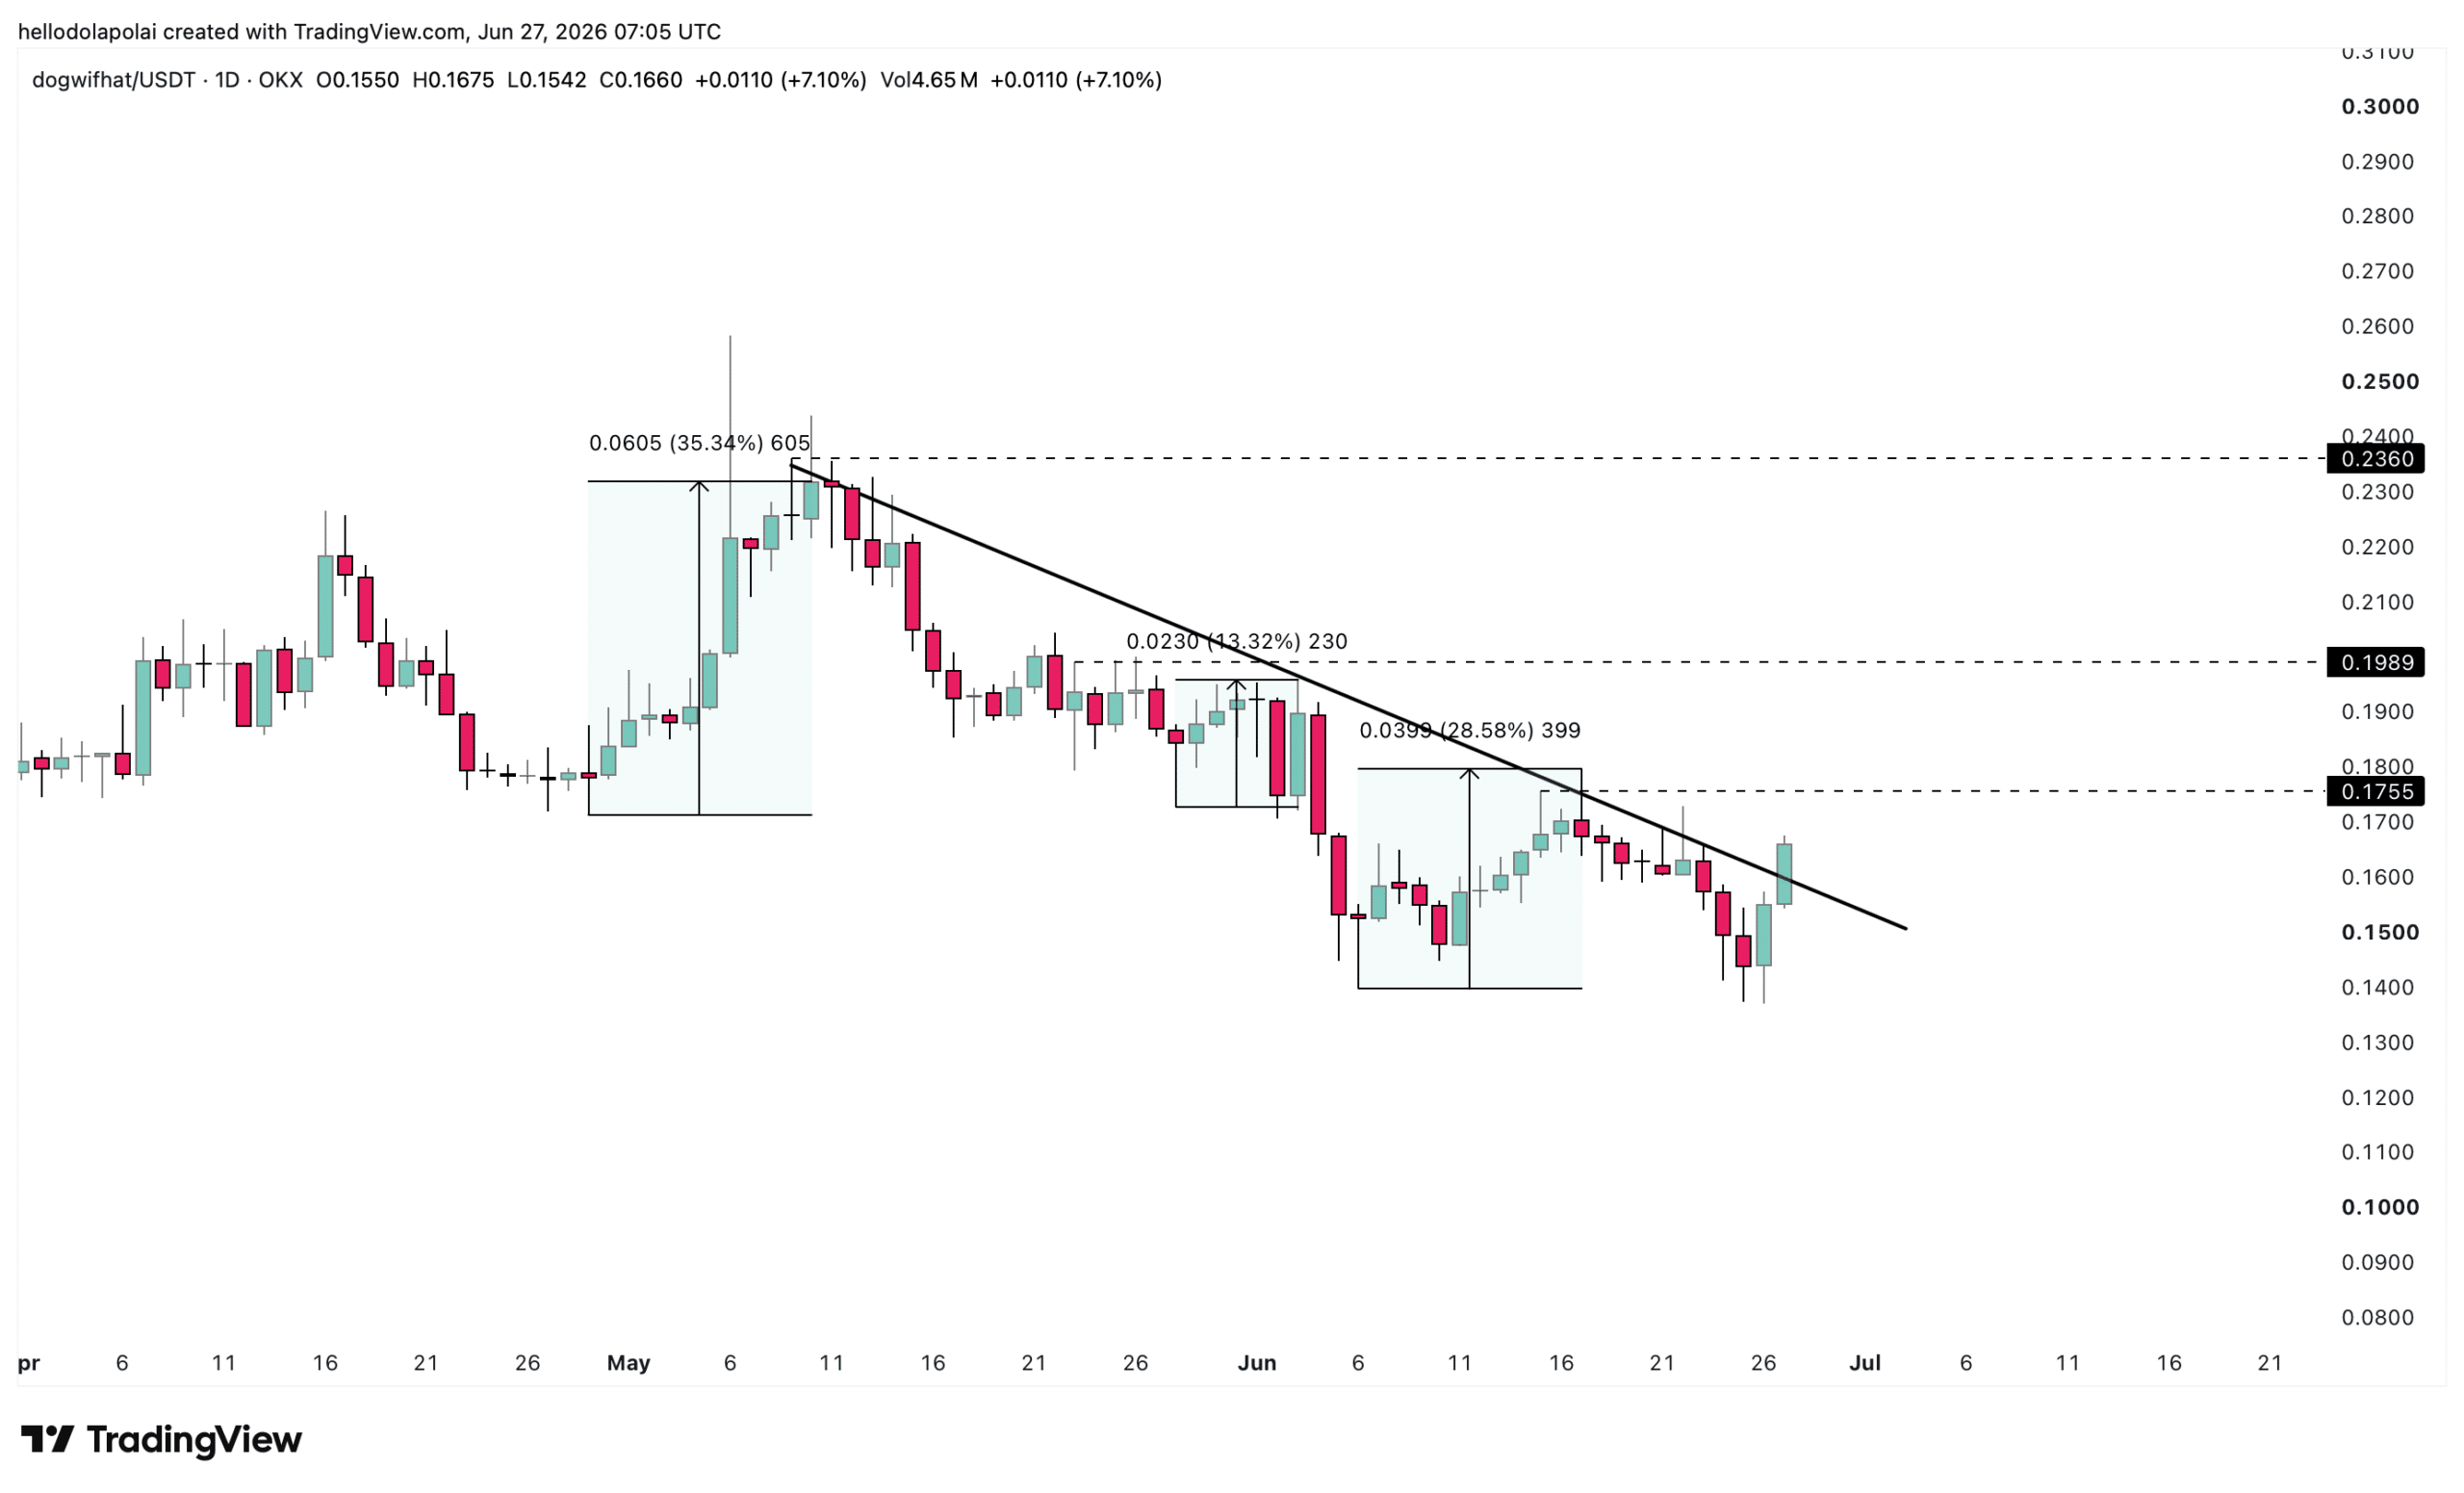
Capital and buying indicators back WIF
WIF stands a strong chance of a major upswing, with the key indicators that track capital flow and buying activity all pointing in the same direction.
The accumulation/distribution indicator is showing a powerful upswing, which implies sustained buying, while total volume has settled at around 378 million WIF traded over the past 24-hour window.
Adding to this, the money flow index—which measures the movement of capital into and out of an asset—is surging upward at a reading of 67, signaling that more capital has flowed into WIF. More importantly, that reading sits in the bullish zone above 50, suggesting investors are actively buying.

The pattern worth noting appears at the vertical lines marking the points where price failed to breach the resistance mentioned earlier, where both indicators rallied into the level together—unlike previous instances in which one indicator rose while the other lagged, or one sat in overvalued territory.
A continued upward move would meaningfully reshape the outlook for WIF, since it would confirm a close above the resistance and establish a sustained bullish pattern.
Liquidation clusters limit WIF’s upside
The liquidation chart shows that WIF’s possible upside is limited, based on the arrangement of its clusters, which mark the levels where unfilled orders sit.
The downside below the current price level extends even further, suggesting WIF could still fall well beneath its present position despite the bullish momentum on display.
An important caveat applies here, as the liquidation heatmap offers only a glimpse rather than an extended view across a broader price spectrum. That leaves it unknown whether more buy orders sit beyond what the chart currently displays.
Final Summary
- WIF has bounced 16% in a day after a rough year down 38%, and the signals that track buying activity suggest investors are stepping back in.
- The rally isn’t safe yet, as WIF still needs to firmly clear a price ceiling that has rejected it three times before, and there’s room for it to slip lower first.