Can ASTER’s $1.4M whale rotation spark a $0.80 breakout?

ambcryptoPublished on 2026-03-05Last updated on 2026-03-05

Abstract

A prominent whale sold $1.4M worth of Ethereum to acquire 1.88 million ASTER tokens, significantly increasing their holdings to ASTER to 4.45 million tokens ($3.18M). This deliberate capital rotation suggests growing conviction in ASTER. The token is trading near $0.72, forming an inverse head-and-shoulders pattern with a key neckline resistance between $0.72 and $0.80. A breakout above $0.80 could signal a stronger recovery. Momentum is improving, with the RSI above 50, indicating strengthening buyer activity. Exchange netflows show limited selling pressure, supporting accumulation. Derivatives traders are strongly bullish, with a 1.70 long/short ratio on Binance. ASTER is at a critical juncture, with whale accumulation, technical patterns, and bullish sentiment converging.

A prominent whale wallet sold 650 Ethereum [ETH] worth $1.4 million and redirected the capital into Aster [ASTER] purchases, raising attention across the market.

On-chain tracking shows the address swapped the funds into 1.88 million ASTER worth roughly $1.4 million, indicating a deliberate capital rotation rather than random trading activity. This move follows a sequence of transfers recorded on-chain within the same timeframe.

As a result, the whale now controls 4.45 million ASTER valued at nearly $3.18 million, placing the address among notable holders. Such repositioning often reflects shifting conviction between assets.

In this case, the whale reduced exposure to ETH while expanding ASTER holdings significantly. As a result, the transaction introduces a strong accumulation narrative.

Inverse pattern forms near the key neckline

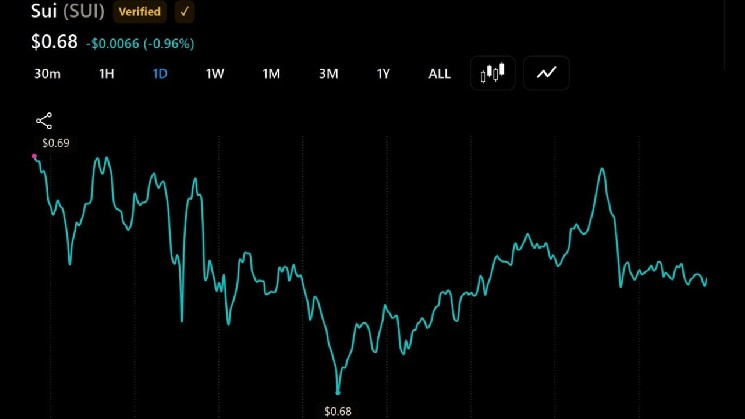
At press time, ASTER was trading near $0.72, with the daily chart showing a developing inverse head‐and‐shoulders pattern in its price structure.

The left shoulder formed near $0.68, followed by a deeper decline toward $0.50, which established the head. Soon after, the price recovered and formed the right shoulder near $0.68, reinforcing the structure.

Notably, ASTER traded just beneath the neckline resistance between $0.72 and $0.80. This region has repeatedly rejected upside attempts.

However, price stabilization within this zone suggests growing buying pressure. Support levels remain clearly defined at $0.68 and $0.60, which previously halted declines.

Since this pattern typically signals reversal conditions, traders now focus on the neckline zone. A sustained push above $0.80 could strengthen the broader recovery narrative.

Momentum indicators now reveal improving buyer activity after months of pressure. The Relative Strength Index sat near 56.85, while its Moving Average tracked close to 54.93.

This shift places RSI above the neutral 50 threshold, which often signals strengthening market participation. Earlier in the downtrend, the indicator repeatedly struggled below the midline.

However, recent recovery shows improving demand as ASTER stabilizes near resistance. In addition, the RSI trend now slopes upward, which reflects strengthening market conviction.

Buyers appear increasingly willing to defend higher price zones. As a result, the indicator supports the developing reversal structure visible on the price chart.

ASTER exchange flows hint at accumulation shifts

Spot exchange activity now reveals shifting supply dynamics surrounding ASTER. Historical data shows several periods of large negative netflows, which indicate tokens leaving exchanges.

Such outflows often suggest accumulation as investors move assets into private wallets. Notably, the latest reading shows a netflow near -$300.81K, which reflects a relatively balanced short-term environment.

Selling pressure, therefore, appears limited at the moment. At the same time, the absence of large inflows reduces immediate distribution risk.

Combined with the whale accumulation observed earlier, these flows support the idea that some investors continue positioning quietly.

Derivatives traders lean strongly long on ASTER

Derivatives positioning as of writing revealed a strong bullish tilt among experienced traders. Data from Binance showed 62.96% of accounts were positioned long, while 37.04% remained short.

This distribution produced a 1.70 Long/Short Ratio, indicating that bullish bets dominate. The ratio has gradually recovered after a brief drop earlier in the week.

As a result, sentiment among top traders increasingly favors upside positioning. When professional traders maintain long exposure during consolidation, markets often anticipate volatility expansion.

However, traders also monitor leverage concentration closely because aggressive positioning can amplify liquidations.

Even so, the current bias clearly favors buyers. Combined with whale accumulation and improving technical structure, derivatives sentiment now aligns with the broader recovery narrative surrounding ASTER.

Conclusively, ASTER now sits at a critical inflection point as whale accumulation, improving technical structure, and bullish derivatives positioning converge simultaneously.

The developing inverse head and shoulders pattern places $0.80 resistance at the center of attention.

If buyers sustain pressure above this zone, ASTER could extend recovery toward higher resistance levels.

However, failure to break the neckline may prolong consolidation near $0.72. Traders, therefore, watch whether demand continues strengthening around current levels.


Final Summary

  • Whale capital rotation into ASTER suggests growing conviction as traders quietly reposition ahead of potential structural breakout opportunities.
  • Technical structure now aligns with improving sentiment, placing ASTER near a pivotal zone where demand could accelerate rapidly.

Related Questions

QWhat significant transaction did a whale make involving Ethereum and Aster, and what was its value?

AA prominent whale sold 650 Ethereum (ETH) worth $1.4 million and used the capital to purchase 1.88 million Aster (ASTER), also valued at approximately $1.4 million.

QWhat technical pattern is forming on ASTER's daily price chart, and what are its key levels?

AAn inverse head-and-shoulders pattern is forming. The left and right shoulders are near $0.68, the head is at $0.50, and the key neckline resistance is between $0.72 and $0.80.

QWhat does the Relative Strength Index (RSI) value and its position indicate about ASTER's momentum?

AThe RSI is at 56.85, above the neutral 50 threshold, and its moving average is at 54.93. This indicates strengthening buyer activity and improving market participation, supporting a reversal narrative.

QWhat does the negative netflow of ASTER tokens from exchanges suggest about market activity?

AA negative netflow of approximately -$300.81K indicates that more tokens are leaving exchanges than entering, which often suggests accumulation by investors moving assets to private wallets, reducing immediate selling pressure.

QWhat is the sentiment among derivatives traders on Binance towards ASTER, as shown by the Long/Short Ratio?

ADerivatives traders are strongly bullish, with 62.96% of accounts long and 37.04% short, resulting in a Long/Short Ratio of 1.70. This indicates dominant bullish bets and a sentiment that favors upside positioning.

Related Reads

SemiAnalysis Dissects Huawei's Kirin 9030: Process Technology Halted, So They Folded the Chip

SemiAnalysis has published a detailed teardown report on the HiSilicon Kirin 9030 Pro chipset found in Huawei's Mate 80 Pro. Fabricated using SMIC's most advanced N+3 node without EUV lithography, the analysis reveals significant technical achievements and strategic shifts. The report indicates SMIC's N+3 has achieved transistor density comparable to TSMC's N6 (113.4 vs 107.7 MTr/mm²), primarily through aggressive use of Self-Aligned Quadruple Patterning (SAQP) for its metal layers. This results in a notably small 32.5nm M0 metal pitch. However, SemiAnalysis notes this achievement comes with significantly higher process complexity, cost, and potential yield challenges compared to competitors using more advanced tools. The Kirin 9030 design maximizes this constrained density. While its GPU performance has improved ~70% and matches Qualcomm's 2022 flagship level, the CPU core's IPC lags behind current top-tier designs from Apple and Qualcomm, a gap attributed to the underlying manufacturing technology rather than design capability. Facing long-term restrictions on advanced tools, Huawei is charting a new path. The report highlights the company's "LogicFolding" roadmap, a 3D stacking technique aimed at shortening signal paths to boost performance and efficiency. The goal is to reach 5GHz frequency and a projected density of 295 MTr/mm² by 2031. SemiAnalysis concludes that export controls have not halted China's chip progress but have fundamentally altered its trajectory, making it more expensive and complex. This has spurred innovation in alternative areas like 3D stacking and domestic EDA tool development, with Huawei's supply chain also beginning to integrate Chinese memory from CXMT.

marsbit34m ago

SemiAnalysis Dissects Huawei's Kirin 9030: Process Technology Halted, So They Folded the Chip

marsbit34m ago

How Will the Price Move Before SpaceX's Next Share Unlock?

TL;DR Investors buying SPCX after SpaceX's IPO are not simply investing in a typical tech stock. It’s a high-valuation asset driven by Musk's narrative, Starlink, and space transport potential, but with a key twist: a very small initial float of ~4% has led to significant post-listing price appreciation. The current price action reflects a timing gap. Before the first lock-up expiration (estimated around August, subject to official confirmation), scarcity and high demand could continue to push prices up. Short-term bulls focus on low float, FOMO, and potential index inclusion. However, bears point to the supply dynamics that will change post-lockup. Existing shareholders still hold over 95% of shares, which will be released in stages starting from the first unlock window. This introduces future selling pressure from low-cost holders. The upcoming Q2 earnings report is a critical catalyst before the unlock. It will test whether the company's fundamentals can justify the current ~$2.1T valuation. Strong results could support the pre-unlock momentum, while weak figures could amplify concerns about future supply. The trading thesis is shifting from immediate scarcity ("can't buy enough") to evaluating future absorption capacity ("who will buy when more supply hits"). The path ahead hinges on the specifics of the unlock schedule, Q2 earnings performance, and whether anticipated passive index buying materializes.

marsbit54m ago

How Will the Price Move Before SpaceX's Next Share Unlock?

marsbit54m ago

Bitcoin Short-Term Bullish Structure Validated, HYPE Low-Entry Window Opens | Guest Analysis

**Market Analysis Summary (Week of June 2026)** **Overall Market Context:** The market environment is exceptionally complex, with the unexpected US-Iran agreement and the reopening of the Strait of Hormuz triggering a global asset repricing and significant volatility. This heightened noise underscores the importance of a structured analytical framework. **Bitcoin (BTC) Analysis & Strategy:** * **Current Status:** The price has climbed above $65,000, currently in a rebound phase (segment 38-39) following a complex 12-segment correction from the May high of $82,850. * **Key Levels:** * **Primary Resistance:** $69,500–$70,500. A successful breakout above $65,000 targets this zone. * **Primary Support:** $65,000 (immediate), followed by $59,000–$60,000 and $55,000. * **Weekly Outlook & Strategy:** The focus is on the confirmation of the $65,000 level. * **Bullish Scenario (Hold $65K):** A move toward the $69.5K–$70.5K resistance zone is anticipated, which is a potential area for initiating medium-term short positions. * **Bearish Scenario (Break below $65K):** A retest of the $60,000–$62,000 support range is likely. * **Medium-Term Strategy:** Currently neutral. Plan to establish short positions (up to 60% allocation) either in the $69.5K–$70.5K resistance zone upon signs of rejection, or on a confirmed breakdown below $65,000 and further below $59K–$60K. * **Short-Term Strategy:** Utilize 30% capital for scalping opportunities based on support/resistance levels, using 30/60-minute charts. **HYPE Analysis & Strategy:** * **Current Status:** The price has stabilized around $52 after a four-segment decline from the June high of $75.87 and is now in a rebound (segment 50-51). * **Key Levels:** * **Primary Resistance:** $62.50–$64.57. Watch for potential rejection here to form a lower high. * **Primary Support:** $52–$55.50, followed by $47–$49. * **Weekly Outlook & Strategy:** Adopt a "buy on dips, avoid chasing rallies" approach. * **Core View:** Monitor the price action and potential formation of a lower high ("endpoint 51") in the $62.50–$64.57 resistance zone. * **Short-Term Strategy:** Consider light long positions (max 30% allocation) if the price finds support and shows reversal signals in the $52–$54.50 or deeper $47–$49 support zones, confirmed by proprietary quantitative bottom signals. **Trade Review:** Last week's HYPE short-term long trade, executed based on proprietary "Price Difference" and "Momentum" model signals, yielded a profit of approximately 11.88%. The entry was near $54.39 and exit near $60.85. **Risk Management Reminder:** Always set an initial stop-loss upon entry. Move stop-loss to breakeven at +1% profit, then trail it upwards to lock in gains as the trade progresses. *Disclaimer: All analysis, models, and strategies are based on personal technical analysis for educational purposes only, not investment advice. The market carries inherent risk.*

Odaily星球日报59m ago

Bitcoin Short-Term Bullish Structure Validated, HYPE Low-Entry Window Opens | Guest Analysis

Odaily星球日报59m ago

Bitcoin Short-Term Bullish Structure Validated, HYPE Accumulation Window Opens | Guest Analysis

**Bitcoin and HYPE Market Analysis: Short-Term Outlook and Trading Strategies** This market analysis examines Bitcoin (BTC) and HYPE amid volatile conditions, providing short-term outlooks and specific trading strategies. **Key Outlooks:** * **Bitcoin (BTC):** Focus is on whether BTC's recent move above $65,000 holds. A successful breakout could lead to a test of the $69,500-$70,500 resistance zone, where medium-term short positions are considered. A failure, breaking below $65,000, may trigger a decline towards the $59,000-$60,000 support area. * **HYPE:** The token completed a four-wave correction and is now rebounding. The key resistance zone is $62.5-$64.57. The trading strategy is "buy on dips," looking for entry opportunities near the $52-$54.5 or deeper $47-$49 support zones, pending confirmation from proprietary models. **BTC Trading Strategy:** * **Medium-term:** Primarily looking to establish short positions (up to 60% allocated capital) if price rallies to the $69,500-$70,500 resistance area and shows signs of reversal. Alternative plans involve initiating shorts on a breakdown below $65,000. * **Short-term:** Allocate up to 30% capital for intraday "spread" trades based on support/resistance levels on 30/60-minute charts. **HYPE Trading Strategy:** * **Short-term:** Adopt a dip-buying approach. Consider light long positions (under 30% capital) when price tests key support levels ($52-$54.5 or $47-$49) and shows stabilization, confirmed by proprietary "Price Spread" and "Momentum Quant" models. **Trade Recap:** The analysis reviews a successful HYPE long trade from the previous week, executed at ~$54.39 and closed at ~$60.85 for an ~11.88% gain, based on signals from the aforementioned models. **Risk Management Emphasis:** The article stresses strict capital allocation (under 30-60%), immediate initial stop-loss placement, and a trailing stop-loss protocol to lock in profits as trades move favorably. ***Disclaimer:** All analysis, models, and strategies are for educational purposes based on technical analysis, not investment advice. Markets are volatile; trade with caution.*

marsbit1h ago

Bitcoin Short-Term Bullish Structure Validated, HYPE Accumulation Window Opens | Guest Analysis

marsbit1h ago

Trading

Spot
Futures

Hot Articles

Discussions

Welcome to the HTX Community. Here, you can stay informed about the latest platform developments and gain access to professional market insights. Users' opinions on the price of ETH (ETH) are presented below.

活动图片