BTC Medium-Term Trend Weakens, Short-Term Volatility Fails to Mask Directional Risks | Invited Analysis

Odaily星球日报Published on 2025-12-22Last updated on 2025-12-22

Abstract

BTC Mid-Term Trend Weakens, Short-Term Volatility Masks Directional Risks | Guest Analysis Analyst Conaldo reviews Bitcoin market performance from Dec 15-21, noting that BTC entered a predicted consolidation phase, oscillating within the $87.5K–$89K range. The mid-term outlook remains bearish, with the long-term bullish trend line (since late 2022) and the recent descending trend line (from the Oct 2025 high) converging. A breakout above this dual resistance is needed to shift the bearish structure. Last week, four short trades were executed based on quantitative models, yielding a 2.14% return. Key supports were held around $84.5K, closely aligning with predictions. Technical analysis (weekly and daily charts) indicates BTC remains in a bear market. Momentum indicators linger below zero, and sentiment metrics are neutral, suggesting continued weakness and potential downside risk. For the week of Dec 22-28, BTC is expected to trade in a wide range. Critical resistance lies at $89.5K–$91K. A breakdown could deepen corrections, while holding may lead to limited rebounds. Key supports are at $86.5K–$87.5K and $83.5K–$84.5K. Trading strategies maintain 65% mid-term short positions and 30% short-term tactical shorts based on range breaks, with strict stop-losses and profit-taking rules. Macro factors include reduced holiday liquidity, potential Fed chair nomination announcements, U.S. Q3 GDP revisions, and BoJ policy cues, which may influence market volatility. Investors are...

Odaily Invited Market Analyst Conaldo, Master of Financial Statistics from Columbia University, USA, focused on quantitative trading of US stocks during university and gradually expanded to digital assets such as Bitcoin, building a systematic quantitative trading model and risk control system through practical experience; possesses keen data insight into market fluctuations and is committed to continuous development in the professional trading field, pursuing steady returns; will delve into BTC technical, macro, and capital changes weekly, review and display practical strategies, and preview major events worth attention in the near future for reference.
Core Summary:

• From a macro technical perspective (see Figure 3 below): In the Bitcoin daily chart, the upward trend line representing the long-term bull market (since the end of 2022) and the downward trend line defining the recent correction (since the high in October 2025) are about to converge. The market is currently in a repair and fluctuation period after breaking the long-term trend. Bitcoin price is under dual pressure. Before the price breaks through this dual pressure with strong volume, all upward movements can only be considered as rebounds in a bearish pattern. The effective breakthrough of these two key trend lines will be the ultimate basis for judging the medium-term direction of the market.

• Core View Verification: The core judgment proposed last week that "the market will most likely transition into a volatile adjustment pattern" is highly consistent with the actual market movement. The bulls and bears repeatedly contested the $87,500~$89,000 area, and the mid-week adjustment low of $84,456 had a relative error rate of about 1.18% compared to the predicted support area upper limit of $83,500.

• Strategy Execution Effectiveness Verification: Last week's trading strictly followed the established strategy, successfully completing four operations, with a cumulative return of 2.14%.

The following will review the market prediction, strategy execution, and specific trading process in detail.

I. Bitcoin Market Review Last Week (12.15~12.21)

1. Last Week's Trend Prediction and Operation Strategy Review:

Last week's forward-looking analysis clearly stated: The market will most likely transition into a volatile adjustment pattern. Among them, the $87,500~$89,000 area was defined as the key observation area. The outcome of the contest between bulls and bears here will directly determine the short-term direction of the market. Special attention should be paid: if this area is effectively broken, it will also directly affect the subsequent intensity and depth of the coin price adjustment. The following is the strategy review and analysis.

1. Market Trend Prediction Review:

• Core Pressure Level: First pressure at the $92,500~$94,500 area; second pressure at the $96,500~$98,500 area.

• Core Support Level: First support at the $87,500~$89,000 area; second support at the $80,000~$83,500 area.

2. Operation Strategy Review:

• Medium-term Strategy: Maintain a medium-term position (short) of about 65%.

• Short-term Strategy: To cope with the market trend, we initially drafted two short-term operation plans, A/B. Based on the actual evolution of the market, we ultimately executed Plan B as the core strategy.

• Open Position: If the coin price breaks below the $87,500~$89,000 area and is confirmed, establish a 30% short position.

• Risk Control: Stop loss set above $89,000.

• Close Position: When the coin price falls to the $80,000~$83,500 area and shows resistance, close all short positions to take profits.

2. Last week, four short-term operations were successfully completed according to the plan (Figure 1), achieving a cumulative return of 2.14%. Specific transaction details and review are as follows:

Bitcoin 30-minute K-line chart: (Momentum Quantitative Model + Spread Trading Model)
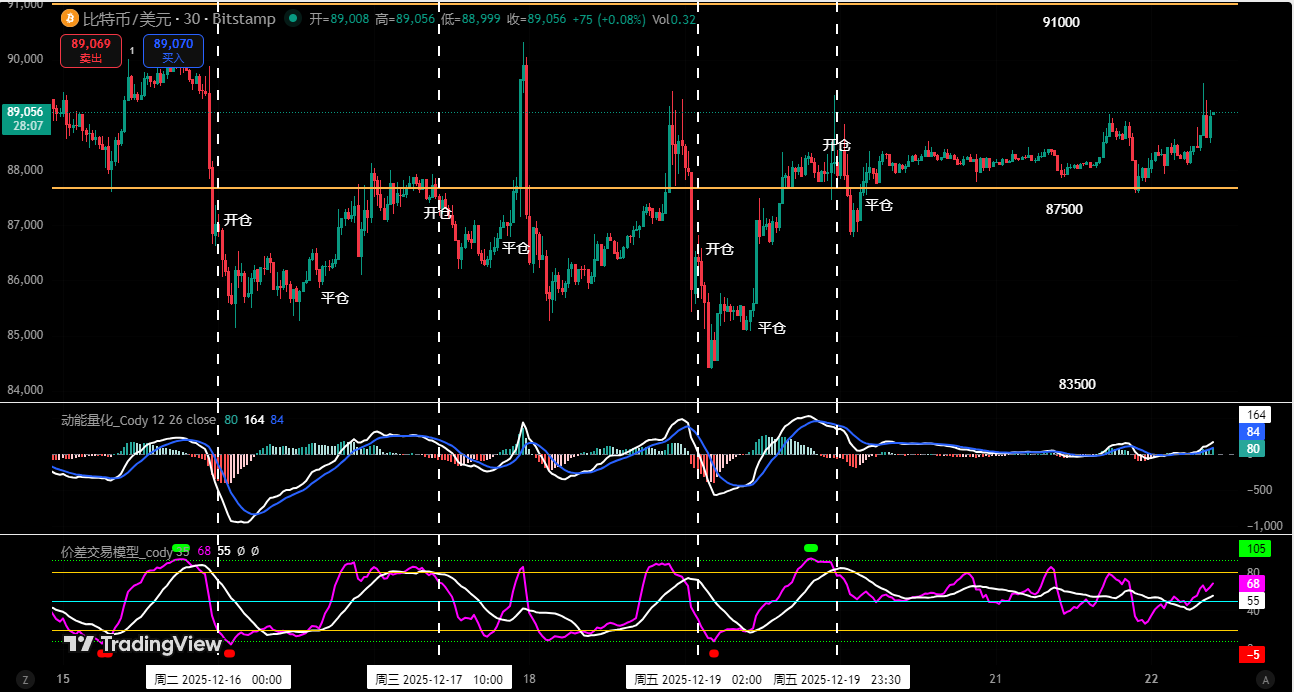
Figure 1

1. Transaction Details Summary:

2. Short-term Trading Review:

• First Transaction (Profit 0.73%): We strictly adhered to the idea of "effectively breaking through key points and going short顺势做空". When the trigger condition was met, the spread trading model simultaneously issued a top signal. Based on this, we decisively established a 30% short position and finally took profits when the price fell near the previous low area.

• Second and Third Transactions (Cumulative Profit 1.41%): Based on the operation mode of "selling short when rebounding to the core pressure area meets resistance". When the coin price hit the $87,500~$89,000 area and encountered resistance,叠加两个模型发出的共振信号, these two transactions were successfully completed.

• Fourth Transaction (Profit 0): The logic for opening this position was consistent with the previous two transactions. It must be特别强调 that in this transaction, we strictly executed the principle of "when the floating profit reaches 1%, immediately move the stop loss to the opening cost price", resulting in the transaction being closed at breakeven.

II. Quantitative Technical Analysis: Based on Multi-Model and Multi-Dimensional Operation

Combining last week's market operation, the author will conduct an in-depth analysis of the evolution of Bitcoin's internal structure using comprehensive multi-dimensional analysis models.

Bitcoin Weekly K-line chart: (Momentum Quantitative Model + Sentiment Quantitative Model)
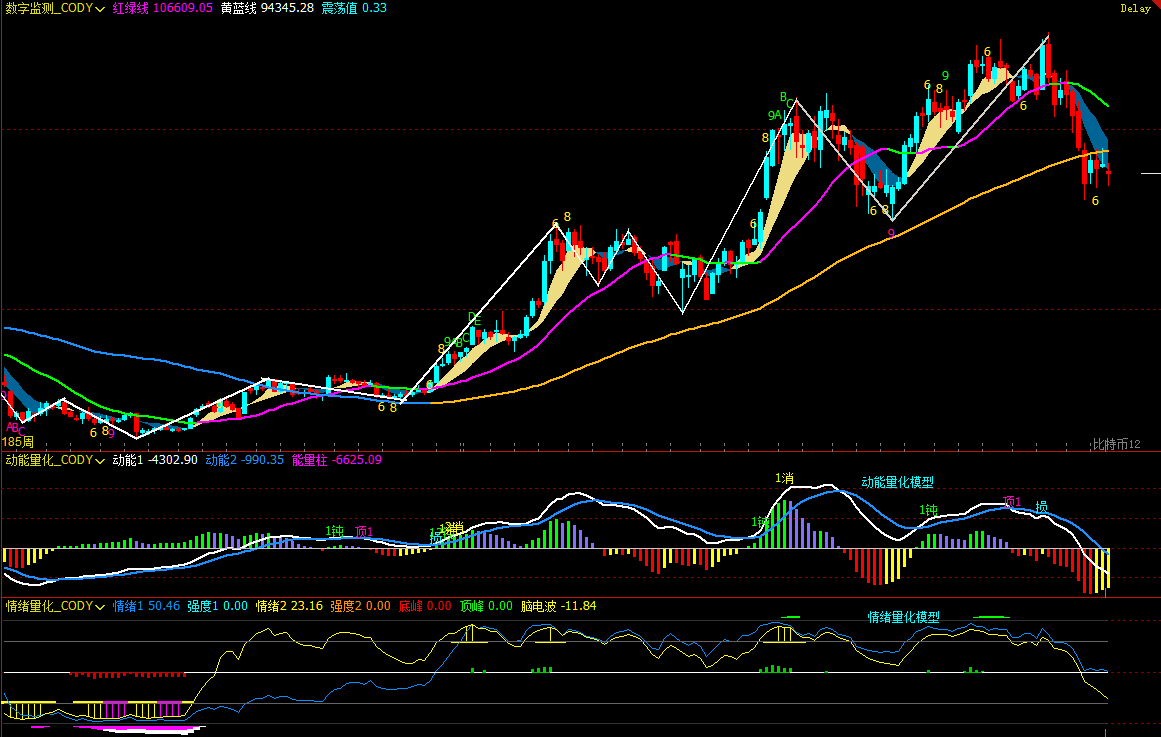
Figure 2

1. As shown in (Figure 2), analysis from the weekly chart:

Momentum Quantitative Model: After last week's adjustment, the two momentum indicator lines continue to run below the zero axis. Although the rebound in previous weeks prevented the negative momentum bars from expanding significantly, the current market structure is still weak, and we need to be警惕 of the risk of further release of adjustment pressure.

Momentum Quantitative Model Indicates: Coin price decline index: High

• Sentiment Quantitative Model: Blue sentiment line value 50.46, strength zero; yellow sentiment line value 23.16, strength zero, peak value is 0.

Sentiment Quantitative Model Indicates: Coin price pressure and support index: Neutral

• Digital Monitoring Model: The chart shows that the coin price has been below the bull-bear (yellow-blue line) dividing line for 5 weeks, increasing the probability of an effective break. Short-term bottom digital signals (above 9) have not yet appeared.

The above data预示: Bitcoin is in a downward trend, entering a bear market on the weekly level, beware of adjustment risks.

Bitcoin Daily K-line chart:
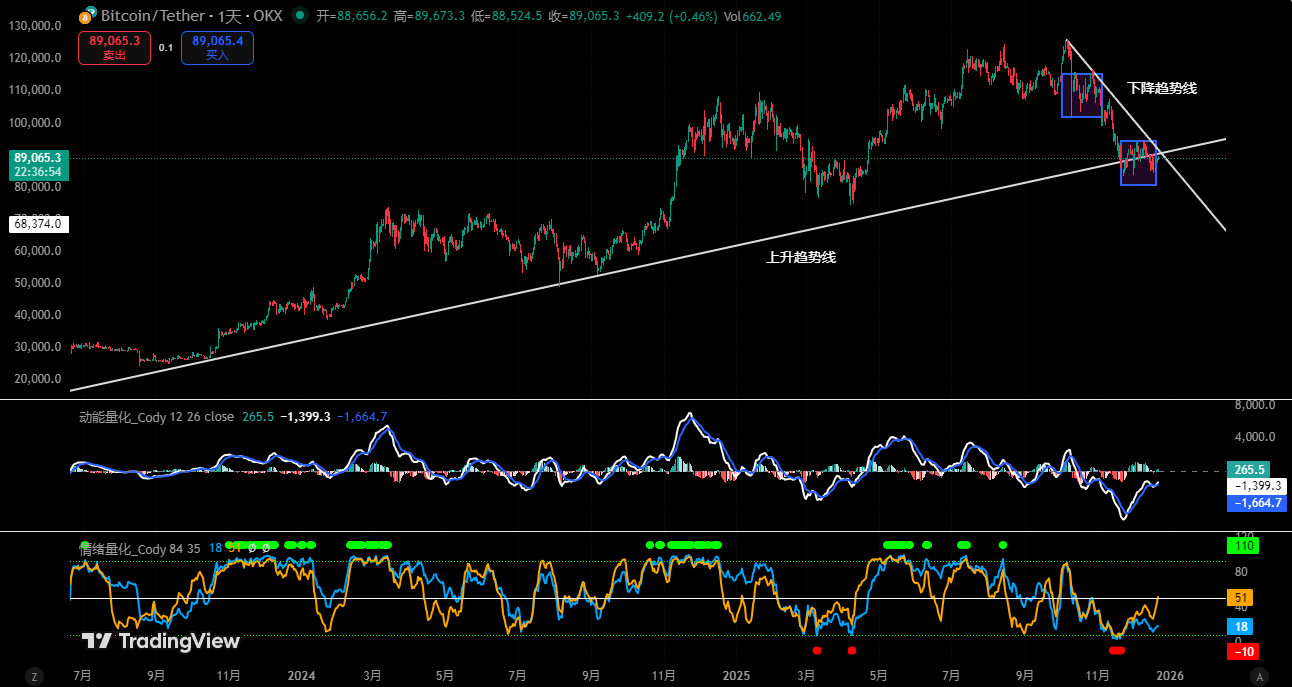
Figure 3

2. As shown in (Figure 3), analysis from the daily chart:

• Momentum Quantitative Model: In last week's行情, the two momentum lines below the zero axis went through a反复交叉 process of "golden cross—dead cross—golden cross", trading volume did not放大, positive momentum bar growth was not obvious.

Momentum Quantitative Model Indicates: Bulls and bears are fiercely contesting for market control, bullish momentum is weak.

• Sentiment Quantitative Model: After last week's daily close, blue sentiment line value 17, strength zero; yellow sentiment line value 45, strength zero.

Sentiment Quantitative Model Indicates: Pressure and support index: Neutral

The above data提示: The daily level is in a bear market, short-term market movements will still be反复.

III. This Week's Market Prediction (12.22~12.28)

1. The market is expected to mainly present a wide-range volatile pattern this week. The core observation interval is $89,500~$91,000. The outcome of the contest in this area will determine the short-term direction:

If effectively broken below: It will mean the adjustment intensity strengthens, the expected adjustment range will expand, and the cycle will相应延长.

If effectively held above: The market is expected to continue its volatile rebound, but the rebound space is expected to be relatively limited.

2. Core Pressure Levels:

• First Pressure Area: $89,500~$91,000 area

• Second Pressure Area: $93,000~$94,500 area

• Important Pressure Area: Around $97,000

3. Core Support Levels:

• First Support Level: $86,500~$87,500 area

• Second Support Level: $83,500~$84,500 area

• Important Support Level: Around $80,000.

IV. This Week's Operation Strategy (Excluding Sudden News Impact)(12.22~12.28)

1. Medium-term Strategy: Maintain a medium-term position (short) of about 65%.

2. Short-term Strategy: Use 30% of the position, set stop loss points, and look for "spread" opportunities based on support and pressure levels. (Using 30 minutes as the operation cycle).

3. Focus on observing the contest and outcome between bulls and bears over the $89,500~$91,000 area. To应对 the market行情, we have drafted two short-term operation plans, A/B:

Plan A: If this area is effectively held above:

• Open Position: If the coin price rebounds to the $93,000~$94,500 area and shows signs of resistance, establish a 30% short position.

• Risk Control: Short stop loss set above $96,000.

• Close Position: When the coin price falls to the $89,500~$91,000 area and shows resistance, close all short positions to take profits.

Plan B: If this area is effectively broken below:

• Open Position: If the coin price breaks below this area and is confirmed, establish a 30% short position.

• Risk Control: Stop loss set above $92,000.

• Close Position: When the coin price falls to the $83,500~$84,500 area and shows resistance, consider partially or fully closing the position to take profits.

V. Special Notes

1. When opening a position: Immediately set the initial stop loss level.

2. When profit reaches 1%: Move the stop loss to the opening cost price (breakeven point) to ensure principal safety.

3. When profit reaches 2%: Move the stop loss to the position of 1% profit.

4. Continuous Tracking: Thereafter, for every additional 1% profit the coin price makes, move the stop loss同步 by 1%, dynamically protecting and locking in existing profits.

(Note: The above 1% profit trigger threshold can be flexibly adjusted by investors according to their own risk preferences and标的 volatility.)

VI. This Week's Macro Outlook and Key Events (12.22~12.28|Christmas Week)

1. Christmas holiday compresses trading hours, liquidity significantly decreases

US stocks will close early on Wednesday and be closed all day Thursday this week. The holiday factor combined with year-end settlement results in overall lower market liquidity. Prices are more easily driven by sentiment and one-sided funds. Beware of "false breakouts" and amplified short-term fluctuations under low trading volume.

2. Fed Chair nomination expectations heat up, policy continuity becomes market focus

The market is watching whether Trump will announce the next Fed Chair nominee during the Christmas holiday. Currently, Kevin Hassett is seen as the领先 probability nominee, and his policy stance is considered偏向 "predictable gradual adjustment".

(If the nomination is announced, it will help stabilize interest rate expectations and risk appetite in the short term; if an unexpected candidate emerges, it may cause阶段性波动 in interest rates and the US dollar.)

3. US Q3 data finale, verifying the "soft landing" narrative

The revised US Q3 GDP, personal consumption expenditure, and core PCE data released on Tuesday will be used to confirm whether economic resilience and the inflation path are consistent with previous judgments.

(If the revisions are mild, the market can more easily maintain its pricing for next year's interest rate cut path; if there are significant upward revisions, it may重新抬升 long-term rates.)

4. Employment data as a marginal observation indicator at year-end

The initial jobless claims released on Wednesday, although not具有趋势性意义, remain an auxiliary signal for observing whether the labor market is loosening around the holidays.

(Currently more偏向 "stable rather than deteriorating", the impact on the market is expected to be limited.)

5. BOJ dynamics provide a reference for global liquidity

BOJ Governor Ueda's speech and the November unemployment rate data will continue to affect the market's judgment on the pace of Japan's monetary policy normalization.

(If yen fluctuations amplify, it may cause情绪扰动 to global risk assets, especially US stocks and crypto markets.)

Financial markets are changing rapidly, all market analysis and trading strategies need to be adjusted dynamically. All views, analysis models, and operation strategies involved in this article are derived from personal technical analysis, for personal trading log purposes only, and do not constitute any investment advice or operation basis. The market has risks, investment needs caution, DYOR.


Trending Cryptos

Related Questions

QWhat is the core technical perspective on Bitcoin's medium-term trend according to the analyst?

AFrom a macro technical perspective, Bitcoin is in a period of repair and consolidation after breaking its long-term uptrend line (since late 2022). The price is under dual pressure from this broken long-term trendline and a recent downtrend line (from the October 2025 high). All upward moves are considered rebounds within a bearish structure until the price breaks above these two key trendlines with strong volume, which will be the ultimate basis for judging the medium-term directional choice of the market.

QWhat was the outcome of the trading strategy execution for the previous week (Dec 15-21)?

AThe trading strategy was strictly followed last week, resulting in four successful short-term operations with a cumulative realized return of 2.14%.

QWhat do the quantitative models (Momentum and Sentiment) on the weekly chart indicate about the current market structure?

AOn the weekly chart, the Momentum Quantitative Model shows both momentum indicator lines continue to run below the zero axis, indicating a high probability of further price decline. The Sentiment Quantitative Model shows neutral pressure and support indices. The Digital Monitoring Model indicates Bitcoin has been below the bull-bear dividing line for 5 weeks, increasing the probability of a valid breakdown. The data suggests Bitcoin is in a downtrend, has entered a bear market on the weekly level, and investors should be wary of adjustment risks.

QWhat are the key support and resistance levels to watch for Bitcoin's price in the upcoming week (Dec 22-28)?

AThe key resistance levels are: First resistance zone: $89,500 - $91,000; Second resistance zone: $93,000 - $94,500; Major resistance near $97,000. The key support levels are: First support zone: $86,500 - $87,500; Second support zone: $83,500 - $84,500; Major support near $80,000.

QWhat major macroeconomic events are highlighted for the upcoming week (Christmas Week, Dec 22-28) that could impact the market?

AKey events include: 1. Reduced trading hours and significantly lower liquidity due to the Christmas holiday. 2. Growing expectations for the Fed Chair nomination, with Kevin Hassett being a probable candidate, which could impact interest rate expectations and risk sentiment. 3. The release of final U.S. Q3 GDP, PCE, and core PCE data to confirm the 'soft landing' narrative. 4. U.S. initial jobless claims data as a marginal labor market indicator. 5. Speeches by the Bank of Japan Governor and Japan's unemployment rate data, which could affect global liquidity and risk asset sentiment.

Related Reads

Anthropic Creates an AI Jailbreak 'Penal Code': Your Requests, Four Ways to Die

Anthropic has publicly detailed its security measures and a new "Cyber Jailbreak Severity" (CJS) framework following the controversial takedown of its Fable 5 model. The incident, triggered by simple user requests like counting letters or stating a profession, highlighted overzealous safety filters. Anthropic classifies cybersecurity-related prompts into four tiers: malicious activities (blocked), high-risk dual-use (like pentesting, with strict limits), low-risk dual-use (often blocked by "safety margin" errors), and harmless tasks (theoretically allowed but still frequently flagged). The company admits its classifiers are tuned for high sensitivity, leading to many false positives. The newly proposed CJS framework aims to objectively score the severity of AI "jailbreaks" (prompts that bypass safety rules) on a 0-10 scale across four dimensions: Capability Gain (does it grant new attack abilities?), Breadth (does it work across multiple attack types?), Weaponization Ease (how hard is it to turn into a real attack?), and Discoverability (how easy is it to find?). The score determines the response, from no action (CJS-0) to a potential model takedown (CJS-4). The score is context-dependent; for example, discovering a major unknown vulnerability today scores high, while asking about a well-known one scores low. The article raises concerns about Anthropic's dual role: it is both creating powerful models (like the restricted Mythos 5) and defining the rules (CJS) for judging their misuse, potentially giving it disproportionate influence. This is set against the backdrop of U.S. export controls, which for the first time directly restricted API access to a model (Fable 5), creating a "tiered" system where public models are heavily filtered and advanced ones are limited to vetted partners. The CJS framework is portrayed as potentially providing regulators with a metric to justify future API shutdowns. For users, the advice is to carefully phrase prompts, watch for signs of being downgraded to a weaker model, and wait indefinitely for promised filter improvements.

marsbit31m ago

Anthropic Creates an AI Jailbreak 'Penal Code': Your Requests, Four Ways to Die

marsbit31m ago

$100M Annual Revenue, Two Berkeley Roommates in Their 20s Build the Most Profitable AI Business

Arena, the AI model ranking platform, has become a $100 million annual revenue business just eight months after launching its commercial service. Originally a UC Berkeley open-source research project called Chatbot Arena, it created a "battle arena" where users blind-test and vote on anonymous AI model responses. This has generated a highly trusted, community-driven leaderboard based on over 10 million user evaluations and 82 million votes. Major AI companies like OpenAI, Google, and Anthropic submit their flagship models to be ranked. The core monetization strategy is its AI Evaluations service, where model developers and large enterprises pay for in-depth performance analysis from Arena's massive user community. This provides real-world feedback on model strengths, weaknesses, and hallucinations—a critical service as models become more complex. The company, spun out from Berkeley in early 2025, quickly raised $100 million in seed funding at a $600 million valuation and later secured a $150 million Series A at a $1.7 billion valuation. The founding team includes CEO Anastasios Angelopoulos, a mathematician focused on rigorous model evaluation; CTO Wei-Lin Chiang, creator of the popular Vicuna chatbot; and co-founder Ion Stoica, a renowned Berkeley professor. Arena is now expanding beyond chat benchmarks into "Agent Mode," evaluating AI agents on complex, multi-step tasks like coding and research. The company's success illustrates the growing value and cost of independent, real-world AI model evaluation as the industry intensifies.

marsbit35m ago

$100M Annual Revenue, Two Berkeley Roommates in Their 20s Build the Most Profitable AI Business

marsbit35m ago

Racking Up 24,000 Stars: With One Command, AI Can Now Find Its Own Skills

Vercel, known for its developer tools like Next.js, has launched 'skills', a package manager for AI coding agents, garnering 24,000 GitHub stars. It allows developers to add specialized capabilities, such as React best practices, to AI assistants like Claude Code or Cursor with a single command: `npx skills add <package>`. Skills are shareable, reusable modules that define an AI agent's behavior for specific tasks, moving beyond one-off prompt engineering towards standardized 'capability engineering'. A key innovation is the 'find-skills' skill, which acts as an internal search engine, allowing an agent to autonomously find and install the right skill for a user's request. This lowers the barrier for non-developers to leverage advanced AI coding assistance. However, this 'npm moment' for AI brings significant security risks. Security audits of thousands of skills on platforms like skills.sh and ClawHub found over 30% contained security flaws, with about 13% classified as severe. Threats include malicious scripts that can access local files and credentials, and prompt injection hidden within skill documentation. Unlike traditional code packages, skills blend instructions, code, and system access, posing a direct risk to user machines and data. Experts advise treating skills like code—reviewing them carefully before installation, especially their scripts, and being wary of excessive permissions. Ultimately, Vercel's initiative represents a major shift towards modular, reusable AI capabilities, but its rapid adoption requires developers to bring the same caution used in managing traditional software dependencies.

marsbit36m ago

Racking Up 24,000 Stars: With One Command, AI Can Now Find Its Own Skills

marsbit36m ago

Claude Engineer Finally Unveils Fable 5's Ultimate Strategy, Teaching You How to Bridge the Information Gap with AI Models

This article, titled "Claude Engineer Finally Releases Fable 5 'Skill-Burning' Guide, Teaching How to Bridge the Information Gap with Models," details a blog post by Claude Code engineer Thariq Shihipar. The core concept is the "information gap" or "unknowns"—the disconnect between a user's instructions (the "map") and the actual task requirements (the "territory"). The article argues that with powerful models like Claude Fable 5, work quality depends on the user's ability to identify and clarify these unknowns. Shihipar categorizes unknowns into four types: Known Knowns (explicit instructions), Known Unknowns (awareness of gaps), Unknown Knowns (implicit, unstated knowledge), and Unknown Unknowns (unforeseen issues). The blog provides a framework for addressing these gaps throughout the workflow: * **Before Implementation:** Techniques include "Blindspot Scanning" to uncover Unknown Unknowns, brainstorming/prototyping for visual or complex tasks, having Claude ask clarifying questions, using reference code/examples, and creating implementation plans. * **During Implementation:** Maintaining an "implementation notes" file for Claude to document deviations and decisions made due to encountered edge cases. * **After Implementation:** Creating summary documents for review and having Claude generate quizzes to ensure the user fully understands the completed changes. The article concludes that as models become more capable, the key to success is systematically discovering and defining these unknowns through low-cost methods like prototyping and planning, allowing for more effective collaboration.

marsbit41m ago

Claude Engineer Finally Unveils Fable 5's Ultimate Strategy, Teaching You How to Bridge the Information Gap with AI Models

marsbit41m ago

Trading

Spot

Hot Articles

How to Buy MASK

Welcome to HTX.com! We've made purchasing Mask Network (MASK) simple and convenient. Follow our step-by-step guide to embark on your crypto journey.Step 1: Create Your HTX AccountUse your email or phone number to sign up for a free account on HTX. Experience a hassle-free registration journey and unlock all features.Get My AccountStep 2: Go to Buy Crypto and Choose Your Payment MethodCredit/Debit Card: Use your Visa or Mastercard to buy Mask Network (MASK) instantly.Balance: Use funds from your HTX account balance to trade seamlessly.Third Parties: We've added popular payment methods such as Google Pay and Apple Pay to enhance convenience.P2P: Trade directly with other users on HTX.Over-the-Counter (OTC): We offer tailor-made services and competitive exchange rates for traders.Step 3: Store Your Mask Network (MASK)After purchasing your Mask Network (MASK), store it in your HTX account. Alternatively, you can send it elsewhere via blockchain transfer or use it to trade other cryptocurrencies.Step 4: Trade Mask Network (MASK)Easily trade Mask Network (MASK) on HTX's spot market. Simply access your account, select your trading pair, execute your trades, and monitor in real-time. We offer a user-friendly experience for both beginners and seasoned traders.

2.8k Total ViewsPublished 2024.03.29Updated 2026.06.02

How to Buy MASK

Discussions

Welcome to the HTX Community. Here, you can stay informed about the latest platform developments and gain access to professional market insights. Users' opinions on the price of MASK (MASK) are presented below.

活动图片