Last week, Bitcoin continued its range-bound volatility, which aligns closely with our previous predictions.
This week, we will focus on two main themes: First, HYPE's Wave IV adjustment has nearly met both time and space requirements, with the daily chart bottom pattern strengthening continuously. The quantitative model has also triggered a bottom warning, and we will focus on capturing buying opportunities this week. Second, Bitcoin's medium-term bearish trend remains unchanged. We maintain our range-bound volatility assessment for this week and will flexibly execute two short-term trading plans (A and B) based on support/resistance levels and model signals.
Summary of Core Trading Views for This Week:
• Analysis of HYPE's multi-timeframe structure. (See Part 1)
• HYPE's weekly forecast and short-term trading strategy. (See Part 2)
• Interpretation of BTC's multi-timeframe structure. (See Part 3)
• BTC's weekly forecast and medium/short-term trading strategies. (See Parts 4 & 5)
Market Validation of Last Week's Core Views:
• BTC Short-Term Trading Results: One short-term short position (1x leverage) was executed last week, successfully realizing a gain of approximately 2.45%. (See Table 1)
• BTC Medium-Term Trading Results Validation: Continued holding the short position established at $89,000 (1x leverage) as per the medium-term strategy. As of last week's close (~$69,031), the profit is ~22.43%, with a maximum profit of ~32.58% during the period.
• BTC Market Forecast Validation: In last week's article, we stated: The market will maintain a range-bound pattern. The current market movement validates our previous prediction.
I. HYPE: Structure Analysis
1. HYPE Daily Chart Structure Breakdown: (Based on price action since January 21)
HYPE_Daily Chart
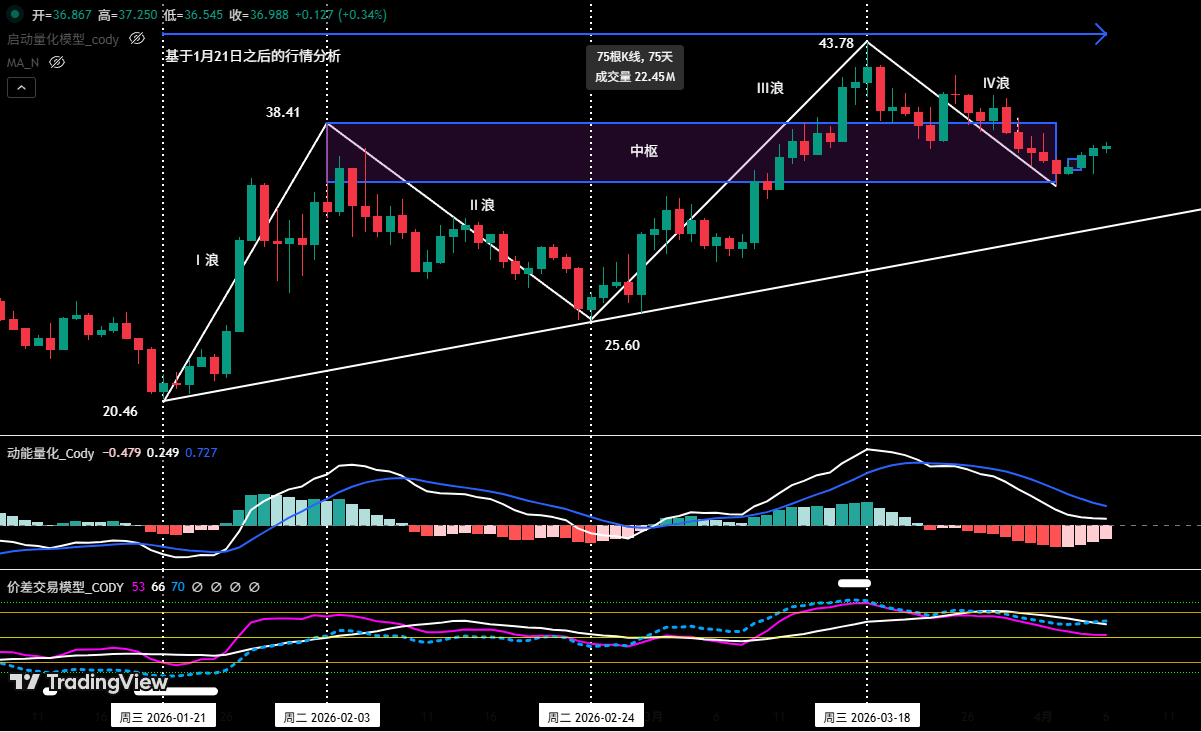
Figure 1
As shown in (Figure 1):
• Wave I (Impulse Wave): From the January 21 low of $20.46 to the February 3 high of $38.41, lasting 14 days, with a maximum gain of 87.73%.
• Wave II (Corrective Wave): From the February 3 high of $38.41 to the February 24 low of $25.60, lasting 20 days, with a maximum decline of 33.35%.
• Wave III (Main Rally Wave): From the February 24 low of $25.60 to the March 18 high of $43.78, lasting 23 days, with a maximum gain of 71.02%.
• Wave IV (Corrective Wave): From the March 18 high of $43.78 to present, has lasted 18 days so far, with a maximum decline of 21.33%.
2. In-Depth Analysis of HYPE's Current Structure (Using 4-Hour Chart)
HYPE_4-Hour Chart
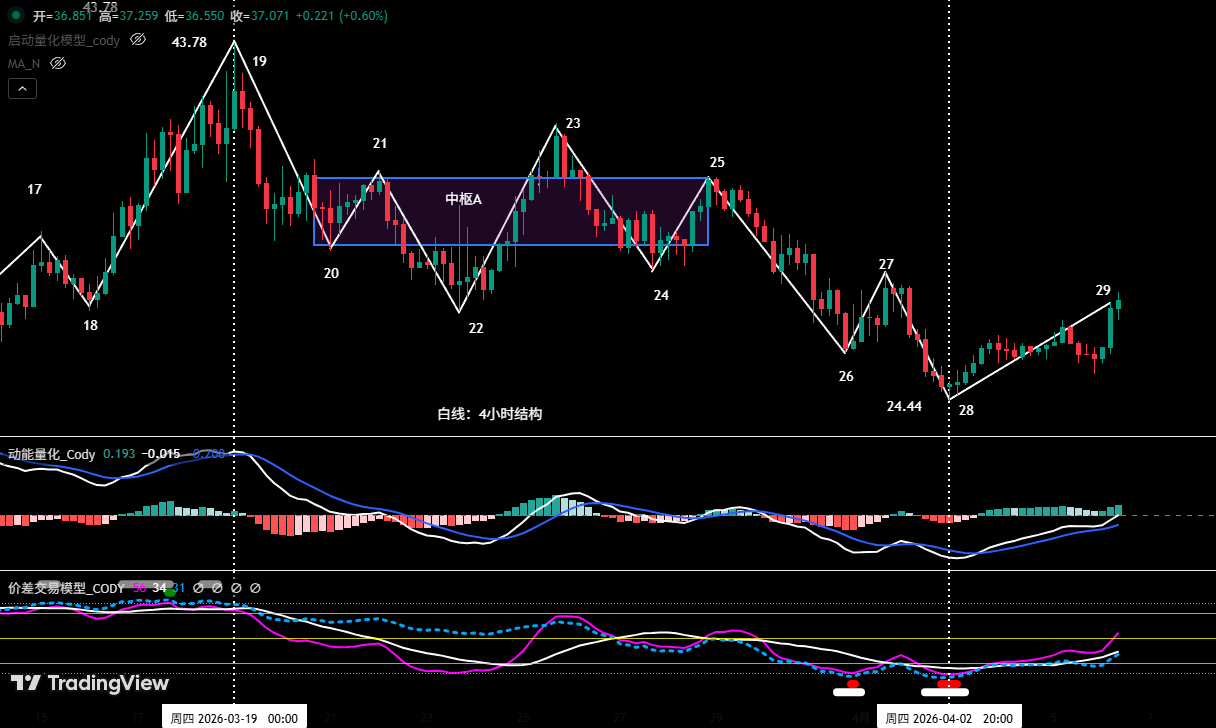
Figure 2
• Breakdown based on the Wave IV correction since the March 18 high of $43.78.
• As shown in (Figure 2), Wave IV can be subdivided into a complex corrective structure consisting of 9 segments between endpoint 19 and endpoint 28: 19-20, 20-21, 21-22, 22-23, 23-24, 24-25, 25-26, 26-27, 27-28.
• Central Pivot A (Zhongshu A): The 5 segments (20-21, 21-22, 22-23, 23-24, 24-25) overlap with each other, forming a declining central pivot (Central Pivot A).
• The price is currently moving in segment 28-29. The chart shows key momentum divergence signals have appeared: comparing the entry segment (19-20) with the exit segment (25-26), and segment 25-26 with segment 27-28, both show decaying downward momentum. This indicates Wave IV correction is highly likely to have ended near endpoint 28.
• Our proprietary Spread Trading Model triggered bottom warning signals at endpoint 26 and endpoint 28 (red and white dots on the chart).
II. HYPE: Weekly Forecast & Short-Term Trading Strategy
1. HYPE Weekly Market Forecast:
• From a daily perspective, the Wave IV correction initiated from the March 18 high of $43.78 has lasted 19 days. Referring to the previous Wave II correction which lasted about 20 days, this correction may be nearing its end.
• Analysis of the 4-hour cycle suggests a high probability that the Wave IV correction ended near endpoint 28.
• Weekly Forecast: Technically, HYPE's Wave IV correction has largely fulfilled its time and space requirements. The daily "bottom reversal" pattern formed around the April 1 low is strengthening, coupled with quantitative model bottom warning signals. Therefore, this week we focus on identifying the end of HYPE's correction and capturing entry opportunities.
2. HYPE Short-Term Trading Strategy for the Week:
• Based on the overall anticipated upward trend, adhere to the strategy of "follow the trend, buy on dips".
• Utilize our proprietary quantitative model signals, using the 30-minute/60-minute charts as operational cycles, and employ 30% of capital to capture long entry opportunities.
• Entry Strategy: The price is currently oscillating upward. If the price can break through the key resistance at $38 this week and successfully retest and hold above the support at $34.47 (April 2 low) (the further the retest is from this low, the better), it may present a high-probability right-side buying opportunity.
3. HYPE Upside Risk Warning: Although HYPE's trend has independence, it cannot completely decouple from Bitcoin's broader environment. If Bitcoin shows significant correction subsequently, it might impact HYPE's rebound momentum.
III. Bitcoin: Structure Interpretation
1. BTC Daily Chart Structure Analysis: (Based on price action since February 6)
• The rally in Bitcoin initiated from the ~$60,000 low on February 6 can still be defined as a large-degree Wave C-2 oversold rebound within a larger corrective structure. If the subsequent rebound fails to break the ~$76,000 high from March 17, the probability of a subsequent Wave C-3 decline is high.
• Key observation points for structural evolution:
The current rebound cycle is prolonging. Monitor whether the subsequent rebound can break the March 17 high. If successfully broken, this rebound might upgrade to a more complex Wave D rebound (same degree as Wave C), potentially followed by a Wave E correction.
• Core conditions for trend confirmation:
The key signal to finally confirm the start of the Wave C-3 (or Wave E) correction is a decisive break below the previous ~$60,000 support low from February 6. Before this, the market remains in a stage of rebound and trend transition博弈 (game theory/contest).
2. In-Depth Analysis of BTC's Current Structure: (Using 4-Hour Chart)
Bitcoin _4-Hour Chart
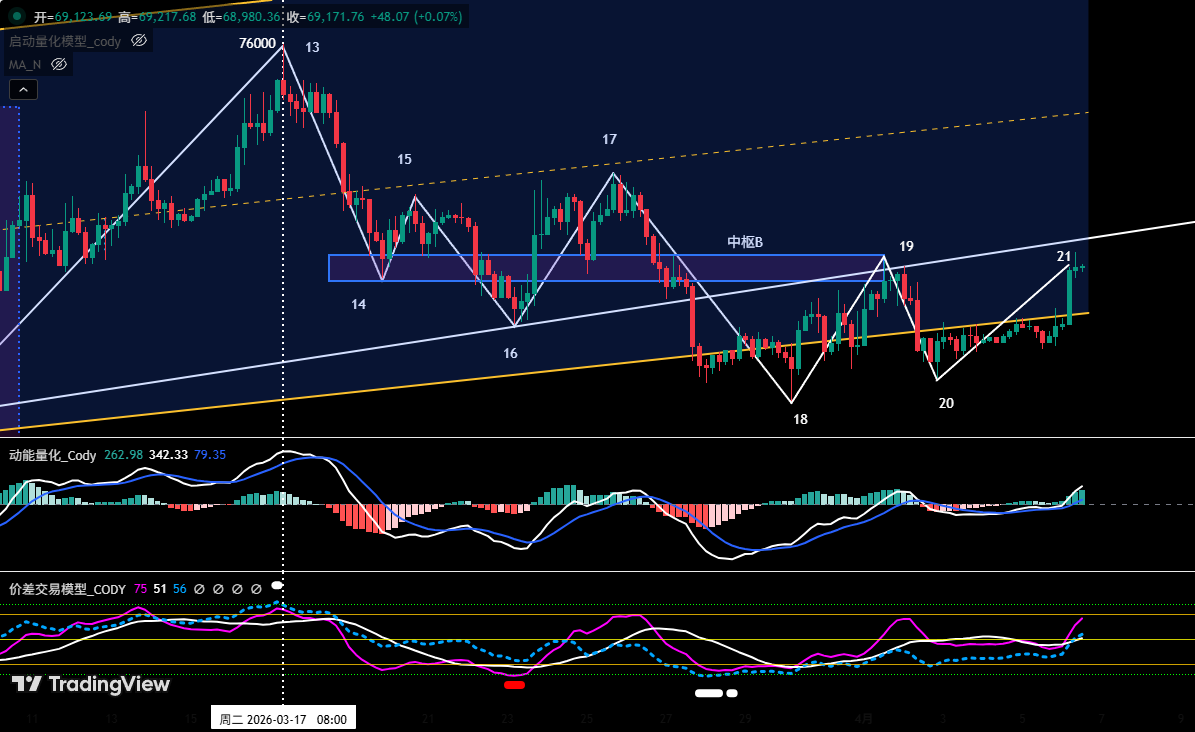
Figure 3
• Based on price action since the March 17 high (~$76,000).
• As shown in (Figure 3), BTC retreated from the March 17 high. From endpoint 13 to endpoint 21, it consists of an 8-segment structure.
• Central Pivot B (Zhongshu B): The declining central pivot consists of 6 segments: 14-15, 15-16, 16-17, 17-18, 18-19, 19-20, and is continuously extending leftwards.
• Currently, segment 20-21 is in progress, with the price touching near the upper轨 (rail/band) of the central pivot around $69,300.
IV. Bitcoin: Weekly Forecast & Short-Term Trading Strategy
1. BTC Weekly Market Forecast:
• Core view for the week: Price maintains range-bound volatility between $65,000~$69,500. If it effectively breaks above the resistance near $69,500, it might enter a wider震荡区间 (volatility range) of $65,000~$72,000; if it breaks below the $65,000 support, watch for support in the $60,000~$62,500 zone.
• The beginning of the week is near a news-sensitive window,建议以观望为主 (advising a primarily wait-and-see approach).
3. Core Resistance Levels:
• First Resistance Zone: $69,500~$72,000 area (previous range)
• Second Resistance Zone: $74,500~$76,000 area (near November 2025 low)
4. Core Support Levels:
• First Support: $65,000~$66,000 area (previous important support zone)
• Second Support: $60,000~$62,500 area (near February 6 low)
• Third Support: Near $57,400
5. Trading Strategy for the Week (Excluding Sudden News Impact): (04.06~04.12)
1. Medium-Term Strategy:
Bitcoin _ Daily Chart: (Position Monitoring Model)
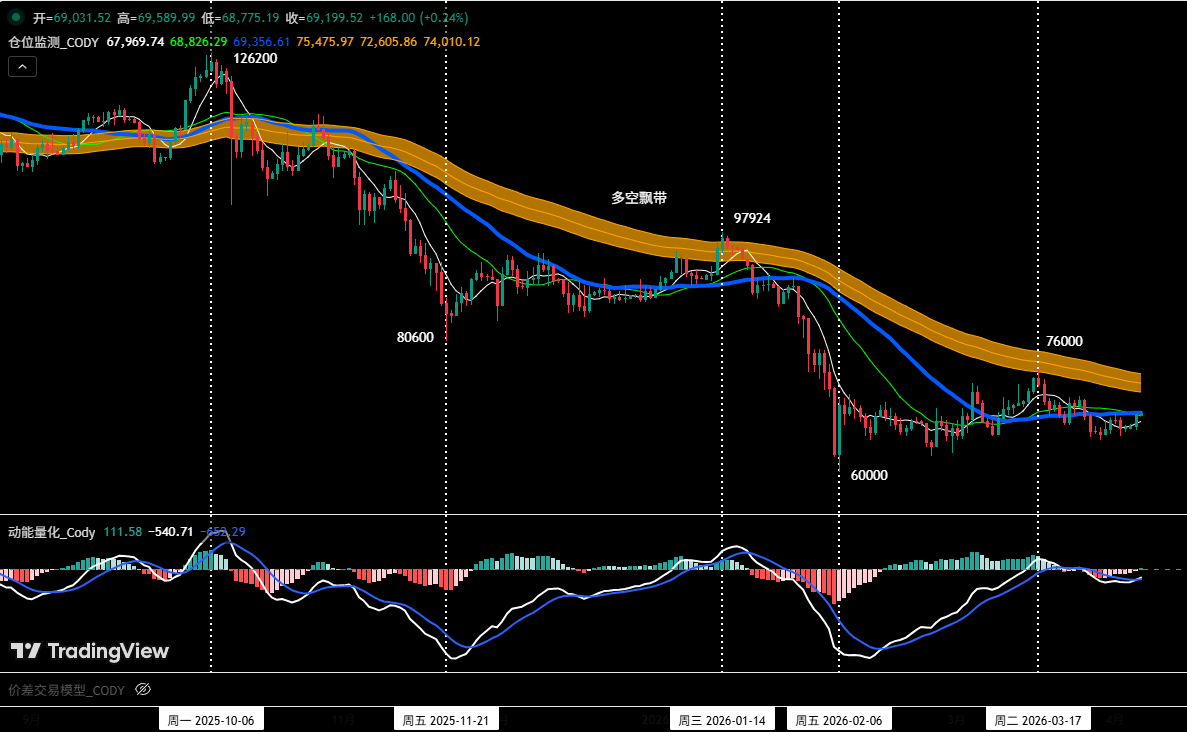
Figure 4
Position Monitoring Model: As shown in (Figure 4), the price is currently below the Bull-Bear Ribbon (yellow), indicating the bearish trend continues. Following strategy rules, we continue holding the 60% short position established at $89,000 (January 28).
• If the price反弹 (rebounds) and effectively breaks above and holds above the Bull-Bear Ribbon, close all medium-term positions.
2. Short-Term Strategy: Utilize 30% of capital, set stop-loss points, and look for "spread" opportunities based on support and resistance levels. (Use 30-minute/60-minute charts as operational cycles).
3. Based on the anticipation of a medium-term bearish market trend, currently adhere to the principle of "follow the trend by shorting". To dynamically respond to complex market changes and combined with signals from our proprietary trading model, we have prepared two short-term contingency plans (A/B):
• Plan A: Short on rallies meeting resistance.
• Entry: When the price rallies to the $69,500~$72,000 zone, triggers resistance signals, and is combined with model top signals, establish a 15% short position.
• Add: When the price continues to rally to the $74,500~$76,000 zone, triggers resistance signals, and is combined with model top signals, add another 15% short position.
• Risk Control: Initial stop-loss for both short entries set above $76,500.
• Exit: When the price falls near important support levels combined with model signals, gradually close positions to take profits.
• Plan B: Follow-through short on breakdown.
• Entry: When the price effectively breaks below the support near $65,000, combined with model top signals,顺势建立 (follow through to establish) a 30% short position.
• Risk Control: Initial stop-loss for the short position set above $67,000.
• Exit: When the price declines to support levels combined with model signals, gradually close positions to take profits.
V. Bitcoin: Last Week's Operation Review
1. Short-Term Operation Review: (See Table 1)
We strictly followed the operation plan. Based on交易信号 (trading signals) from our proprietary Spread Trading Model and Momentum Quantitative Model, we executed one short-term (short) operation last week, achieving a 2.45% profit.
1. Bitcoin Short-Term Trade Details Summary: (Leverage*1x)
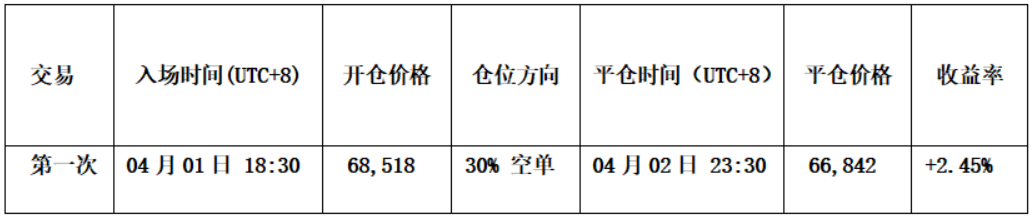
Table 1
2. Short-Term Trade Review: (See Figure 5)
• Entry: When the price rallied near $72,000 and encountered resistance, the Spread Trading Model simultaneously triggered a top warning signal (white dot), forming a shorting resonance with the Momentum Quantitative Model. Therefore, we established a 30% short position at $68,518.
• Exit: When the price fell near $65,000 and stabilized,同时 (simultaneously) the Spread Trading Model triggered a strong bottom warning signal (red dot + white dot). Therefore, we closed all positions near $66,842.
• Summary: This trade successfully profited approximately 2.45%.
Bitcoin _30-Minute Chart: (Momentum Quantitative Model + Spread Trading Model)
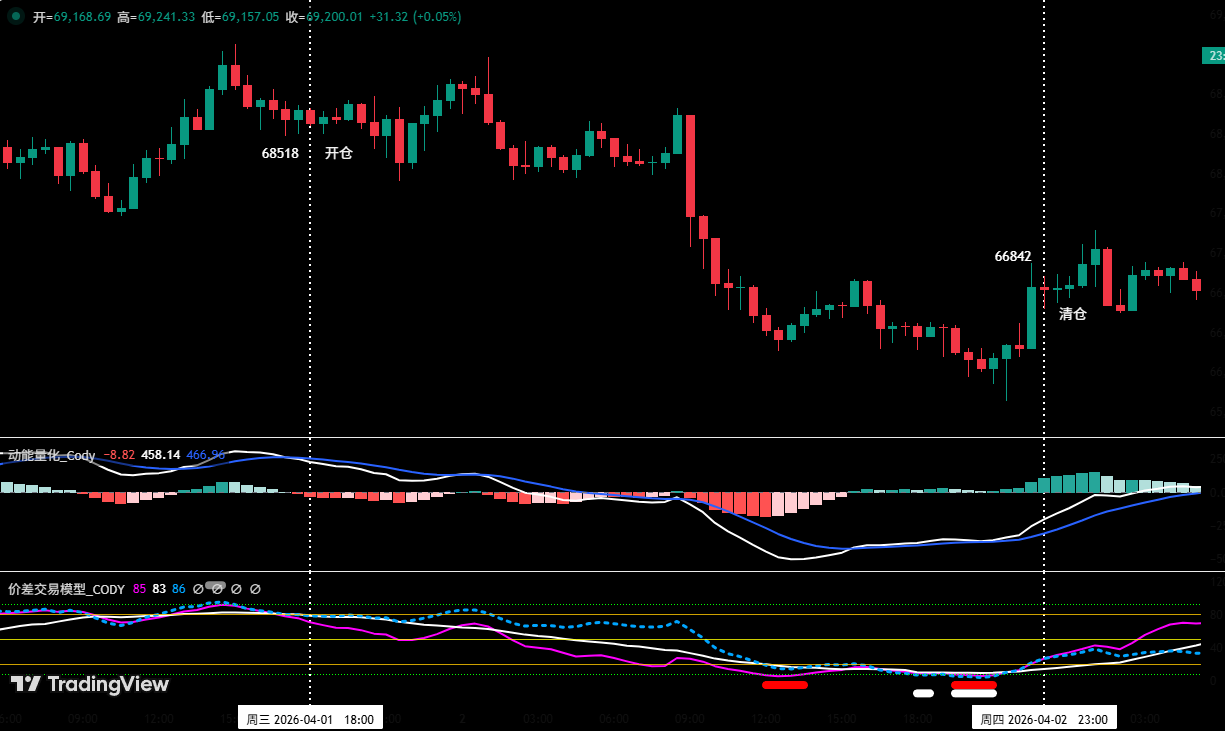
Figure 5 (Short-Term Trade Illustration)
2. Medium-Term Operation Review:
Medium-Term Strategy: Continued holding the 60% short position established near $89,000 (January 28). As of last week's close (closing price ~$69,031), the profit is approximately 22.43%.
VI. Special Notes
1. When opening a position: Immediately set the initial stop-loss level.
2. When profit reaches 1%: Move the stop-loss to the entry price (breakeven point) to ensure capital safety.
3. When profit reaches 2%: Move the stop-loss to the 1% profit level.
4. Continuous tracking: Thereafter, for every additional 1% profit, move the stop-loss up by 1% accordingly, dynamically protecting and locking in profits.
Financial markets change rapidly; all market analysis and trading strategies require dynamic adjustment. All views, analytical models, and operational strategies involved in this article are derived from personal technical analysis, intended solely for personal trading log purposes, and do not constitute any investment advice or operational basis. The market involves risks, investment requires caution. Do not make decisions based solely on this content.


