Bitcoin Triggers Cycle Signal Linked To Every Bear Market Bottom

bitcoinistPublished on 2026-04-06Last updated on 2026-04-06

Abstract

Bitcoin has triggered a Gaussian Channel trend flip on its weekly chart, a technical signal that has historically appeared near the end of every prior bear market. According to analyst ChartNerd, this transition from a green uptrend to a red bearish channel indicates the final stage of the cycle, often preceding one last significant price decline before a market bottom forms. The current analysis suggests Bitcoin could see a downside move into a target range of $40,000 to $50,000 by Q2 or Q3 2026, with key support levels identified at $66,895 and $44,463. Despite the potential for further volatility, this signal is interpreted as a late-stage development rather than the start of a prolonged collapse, potentially offering a final discounted entry opportunity before the next bull run.

Bitcoin is in an uncomfortable spot, and this time the warning is coming from a cycle signal that has shown up at some of the market’s most decisive turning points.

The leading cryptocurrency has crossed a technical threshold in the Gaussian weekly uptrend that has appeared at the same stage of every prior market cycle, and according to one closely followed analyst, it may be pointing toward both a final dip to the bottom and the last discounted entry before the next bull run.

The Gaussian Channel Flip That Matters

In a technical update posted on X, ChartNerd pointed out that Bitcoin has flipped from its green Gaussian weekly uptrend into a red bearish channel, a transition he says has always opened the final stretch of every prior Bitcoin bear market.

According to the chart, which is shown below, each cycle follows a familiar sequence of a strong green expansion phase, a transition highlighted as a trend flip, and then a red bearish channel that leads into the final sweep.

Examining the multi-year logarithmic Bitcoin weekly timeframe chart shows that the pattern is visible across the 2014/2015 cycle, the 2018/2019 bottom, and the 2022 cycle low. The current trend flip looks like those previous transitions, and this places Bitcoin once again at a point where the trend has always moved into bearish territory.

According to ChartNerd, this signal has consistently appeared right before the last major downside move in past bear markets. This is why the analyst does not interpret the signal as the beginning of a prolonged collapse. However, it could be seen as a late-stage development, which shows the Bitcoin price is nearing a bottom.

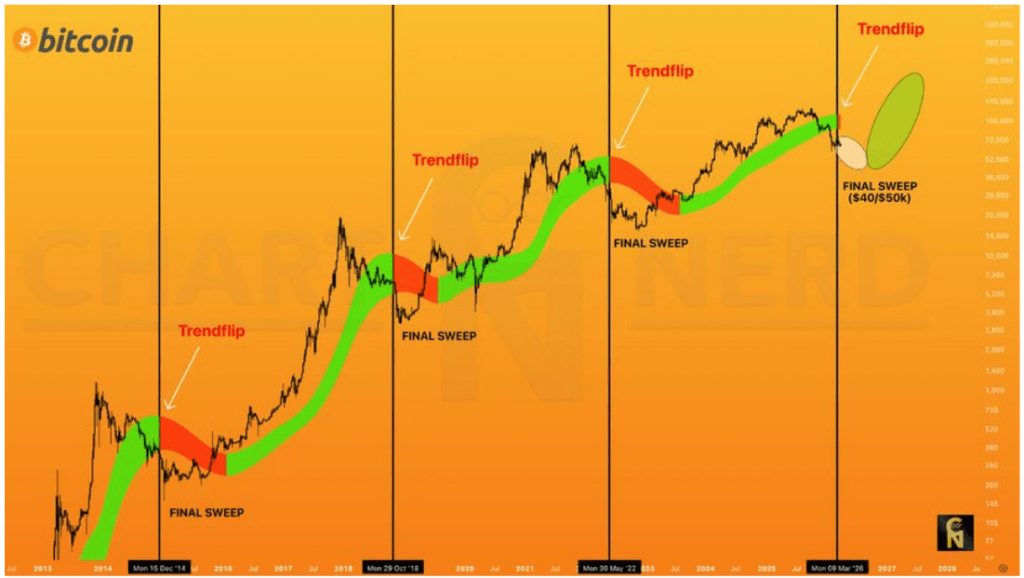
Bitcoin Trend Flip. Source: @ChartNerdTA On X

The Path To The Bottom

Bitcoin is currently down by about 47% from its October 2025 peak price of $126,080. There is still a possibility of further downside from this point, but most of the structural damage to price has already occurred. ChartNerd’s current read places the projected final low somewhere in Q2 and Q3 2026, with a target sweep range between $40,000 and $50,000.

BTCUSD now trading at $67,058. Chart: TradingView

In another analysis post, ChartNerd noted that Bitcoin’s four-year cycle structure is still intact despite recent supercycle narratives and that the current market still operates within that structure.

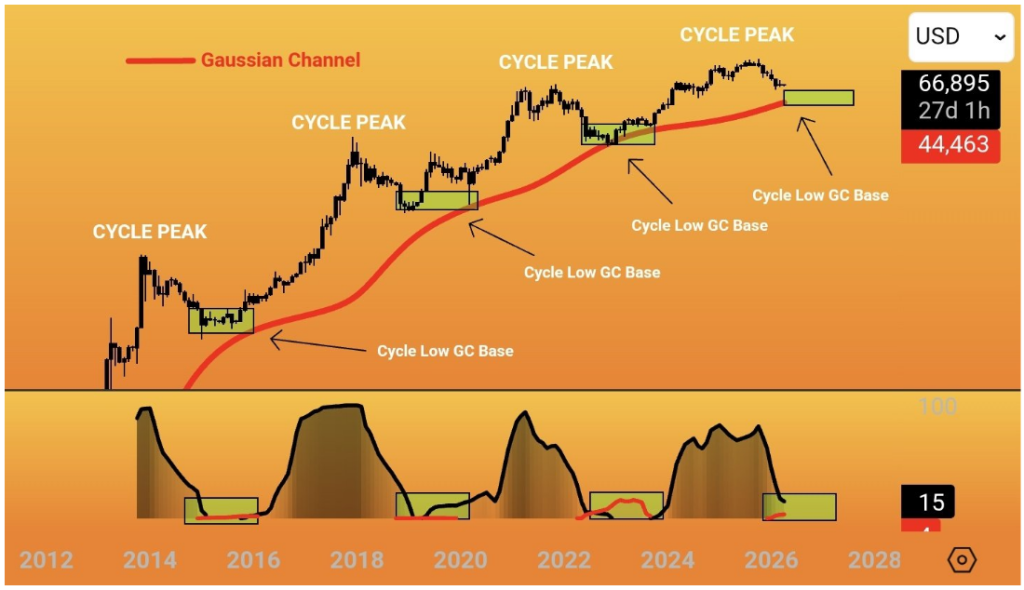
Bitcoin Gaussian Channel. Source: @ChartNerdTA On X

The Gaussian Channel on the price chart shows that the Bitcoin price is on a path to test the channel’s red baseline at $66,895 on the 27-day timeframe, with the lower red support at $44,463. Each prior cycle saw a brief dip to or below that red support line. This means that the Bitcoin price may still face one more period of downside volatility to this range before reversing higher.

Featured image from Unsplash, chart from TradingView

Trending Cryptos

Related Questions

QWhat technical indicator has Bitcoin crossed that is linked to every prior bear market bottom?

ABitcoin has flipped from its green Gaussian weekly uptrend into a red bearish channel on the Gaussian Channel indicator.

QAccording to the analyst ChartNerd, what does this Gaussian Channel trend flip signal typically precede?

AIt has consistently appeared right before the last major downside move in past bear markets, signaling a final dip to the bottom.

QWhat is the projected timeframe and price range for the potential final low of this Bitcoin cycle?

AThe projected final low is somewhere in Q2 and Q3 of 2026, with a target sweep range between $40,000 and $50,000.

QFrom its October 2025 peak, what is Bitcoin's current drawdown percentage mentioned in the article?

ABitcoin is currently down by about 47% from its October 2025 peak price of $126,080.

QWhat key level is the Bitcoin price on a path to test on the 27-day timeframe according to the Gaussian Channel?

AThe Bitcoin price is on a path to test the Gaussian Channel's red baseline at $66,895 on the 27-day timeframe.

Related Reads

The Entire Internet Hails Noam's Joining, But OpenAI's Loss Bill Just Got Thicker

While the AI community celebrates Noam Shazeer, co-author of the "Attention Is All You Need" paper, joining OpenAI as Head of Architectural Research, the company's audited financials reveal a starkly different reality. In 2025, OpenAI reported $13.07 billion in revenue but a massive $20.92 billion operating loss. Even excluding a one-time accounting charge, the cash burn is severe, with $3.7 billion consumed in Q1 2026 alone. This high-profile hiring occurs against a backdrop of significant internal research talent drain, with key founders and researchers departing as the company's focus shifts from exploratory research to product iteration. Meanwhile, OpenAI's fundamental business model faces a deep crisis. It paid Microsoft $10.59 billion for compute in 2025, while its vast user base of 9 billion weekly actives includes only 50 million paying customers, making growth a direct driver of escalating costs. The article argues Shazeer's recruitment is less about technical necessity and more about crafting a compelling narrative for OpenAI's upcoming IPO, aiming to justify a rumored $1 trillion valuation to future public market investors. It contrasts OpenAI's strategy with Anthropic's reported path to profitability, which relies on a strong enterprise customer base and cost control, rather than star-powered narratives. Ultimately, the piece concludes that while Shazeer's architectural work may take 1-2 years to materialize, OpenAI's financial clock is ticking much faster, with its massive losses undercutting the celebratory headlines.

marsbit1h ago

The Entire Internet Hails Noam's Joining, But OpenAI's Loss Bill Just Got Thicker

marsbit1h ago

Market Trend (June 19): US-Iran Deal Drives Out Geopolitical Premium; Chip Stocks Soar to New Highs; Energy Sector Leads Declines

U.S. Market Trends (June 19): U.S.-Iran Deal Eases Tensions, Chip Stocks Soar, Energy Sector Leads Declines. U.S. stocks rallied on Thursday as the signing of a temporary U.S.-Iran deal in Geneva de-escalated Middle East tensions, with Saudi oil tankers transiting the Strait of Hormuz. This geopolitical relief helped markets recover from recent Fed-driven volatility. The S&P 500 rose over 1%, the Nasdaq gained nearly 2%, and the Dow Jones Industrial Average closed at another record high. The Philadelphia Semiconductor Index surged over 6% to a historic peak. Chip stocks were the standout performers. Reports of an Apple-Intel design and foundry deal for certain products, alongside mentions of potential Nvidia and SpaceX collaborations with Intel, propelled the sector. Intel surged ~10.5%, while memory chip makers like Micron also saw significant gains, highlighting sustained confidence in long-term AI capital expenditure. In contrast, the energy sector was the day's sole loser, with the S&P 500 energy sub-index declining as WTI crude fell ~2% to around $74.29/barrel. The reopening of key shipping routes erased prior geopolitical risk premiums. SpaceX extended losses for a second day on news of a potential large bond offering. Market volatility (VIX) dropped sharply, indicating a swift reversal of post-Fed jitters. Treasury yields dipped slightly but remained elevated. The focus now shifts to upcoming economic data, including next week's PCE inflation report and Micron's earnings, which will serve as a key test for the AI trade's durability.

marsbit2h ago

Market Trend (June 19): US-Iran Deal Drives Out Geopolitical Premium; Chip Stocks Soar to New Highs; Energy Sector Leads Declines

marsbit2h ago

Trading

Spot
Futures

Hot Articles

What is $BITCOIN

DIGITAL GOLD ($BITCOIN): A Comprehensive Analysis Introduction to DIGITAL GOLD ($BITCOIN) DIGITAL GOLD ($BITCOIN) is a blockchain-based project operating on the Solana network, which aims to combine the characteristics of traditional precious metals with the innovation of decentralized technologies. While it shares a name with Bitcoin, often referred to as “digital gold” due to its perception as a store of value, DIGITAL GOLD is a separate token designed to create a unique ecosystem within the Web3 landscape. Its goal is to position itself as a viable alternative digital asset, although specifics regarding its applications and functionalities are still developing. What is DIGITAL GOLD ($BITCOIN)? DIGITAL GOLD ($BITCOIN) is a cryptocurrency token explicitly designed for use on the Solana blockchain. In contrast to Bitcoin, which provides a widely recognized value storage role, this token appears to focus on broader applications and characteristics. Notable aspects include: Blockchain Infrastructure: The token is built on the Solana blockchain, known for its capacity to handle high-speed and low-cost transactions. Supply Dynamics: DIGITAL GOLD has a maximum supply capped at 100 quadrillion tokens (100P $BITCOIN), although details regarding its circulating supply are currently undisclosed. Utility: While precise functionalities are not explicitly outlined, there are indications that the token could be utilized for various applications, potentially involving decentralized applications (dApps) or asset tokenization strategies. Who is the Creator of DIGITAL GOLD ($BITCOIN)? At present, the identity of the creators and development team behind DIGITAL GOLD ($BITCOIN) remains unknown. This situation is typical among many innovative projects within the blockchain space, particularly those aligning with decentralized finance and meme coin phenomena. While such anonymity may foster a community-driven culture, it intensifies concerns about governance and accountability. Who are the Investors of DIGITAL GOLD ($BITCOIN)? The available information indicates that DIGITAL GOLD ($BITCOIN) does not have any known institutional backers or prominent venture capital investments. The project seems to operate on a peer-to-peer model focused on community support and adoption rather than traditional funding routes. Its activity and liquidity are primarily situated on decentralized exchanges (DEXs), such as PumpSwap, rather than established centralized trading platforms, further highlighting its grassroots approach. How DIGITAL GOLD ($BITCOIN) Works The operational mechanics of DIGITAL GOLD ($BITCOIN) can be elaborated on based on its blockchain design and network attributes: Consensus Mechanism: By leveraging Solana’s unique proof-of-history (PoH) combined with a proof-of-stake (PoS) model, the project ensures efficient transaction validation contributing to the network's high performance. Tokenomics: While specific deflationary mechanisms have not been extensively detailed, the vast maximum token supply implies that it may cater to microtransactions or niche use cases that are still to be defined. Interoperability: There exists the potential for integration with Solana’s broader ecosystem, including various decentralized finance (DeFi) platforms. However, the details regarding specific integrations remain unspecified. Timeline of Key Events Here is a timeline that highlights significant milestones concerning DIGITAL GOLD ($BITCOIN): 2023: The initial deployment of the token occurs on the Solana blockchain, marked by its contract address. 2024: DIGITAL GOLD gains visibility as it becomes available for trading on decentralized exchanges like PumpSwap, allowing users to trade it against SOL. 2025: The project witnesses sporadic trading activity and potential interest in community-led engagements, although no noteworthy partnerships or technical advancements have been documented as of yet. Critical Analysis Strengths Scalability: The underlying Solana infrastructure supports high transaction volumes, which could enhance the utility of $BITCOIN in various transaction scenarios. Accessibility: The potential low trading price per token could attract retail investors, facilitating wider participation due to fractional ownership opportunities. Risks Lack of Transparency: The absence of publicly known backers, developers, or an audit process may yield skepticism regarding the project's sustainability and trustworthiness. Market Volatility: The trading activity is heavily reliant on speculative behavior, which can result in significant price volatility and uncertainty for investors. Conclusion DIGITAL GOLD ($BITCOIN) emerges as an intriguing yet ambiguous project within the rapidly evolving Solana ecosystem. While it attempts to leverage the “digital gold” narrative, its departure from Bitcoin's established role as a store of value underscores the need for a clearer differentiation of its intended utility and governance structure. Future acceptance and adoption will likely depend on addressing the current opacity and defining its operational and economic strategies more explicitly. Note: This report encompasses synthesised information available as of October 2023, and developments may have transpired beyond the research period.

394 Total ViewsPublished 2025.05.13Updated 2025.05.13

What is $BITCOIN

Discussions

Welcome to the HTX Community. Here, you can stay informed about the latest platform developments and gain access to professional market insights. Users' opinions on the price of BTC (BTC) are presented below.

活动图片