Bitcoin Short-Term Bullish Structure Validated, HYPE Accumulation Window Opens | Guest Analysis

marsbitPublished on 2026-06-15Last updated on 2026-06-15

Abstract

**Bitcoin and HYPE Market Analysis: Short-Term Outlook and Trading Strategies** This market analysis examines Bitcoin (BTC) and HYPE amid volatile conditions, providing short-term outlooks and specific trading strategies. **Key Outlooks:** * **Bitcoin (BTC):** Focus is on whether BTC's recent move above $65,000 holds. A successful breakout could lead to a test of the $69,500-$70,500 resistance zone, where medium-term short positions are considered. A failure, breaking below $65,000, may trigger a decline towards the $59,000-$60,000 support area. * **HYPE:** The token completed a four-wave correction and is now rebounding. The key resistance zone is $62.5-$64.57. The trading strategy is "buy on dips," looking for entry opportunities near the $52-$54.5 or deeper $47-$49 support zones, pending confirmation from proprietary models. **BTC Trading Strategy:** * **Medium-term:** Primarily looking to establish short positions (up to 60% allocated capital) if price rallies to the $69,500-$70,500 resistance area and shows signs of reversal. Alternative plans involve initiating shorts on a breakdown below $65,000. * **Short-term:** Allocate up to 30% capital for intraday "spread" trades based on support/resistance levels on 30/60-minute charts. **HYPE Trading Strategy:** * **Short-term:** Adopt a dip-buying approach. Consider light long positions (under 30% capital) when price tests key support levels ($52-$54.5 or $47-$49) and shows stabilization, confirmed by proprietary...

This week's market environment is exceptionally complex—the unexpected finalization of the US-Iran agreement and the unblocking of the Strait of Hormuz have triggered intense global asset repricing. Such times of extreme emotional volatility are precisely when structural analysis is most valuable. The greater the noise, the more important the framework.

This week, we focus on two main themes: the outcome of BTC's pullback and confirmation after breaking above $65,000, which will determine its subsequent direction; and whether HYPE, after completing a four-stage correction, will offer new short-term opportunities as it faces the resistance zone of $62.5~$64.57.

Detailed analysis of the complete price structure, market predictions, and trading strategies can be found in the main text.

Summary of This Week's Core Trading Views:

• BTC Hourly Timeframe Structure Analysis. (Detailed in Part One)

• BTC Market Outlook and Medium/Short-Term Trading Strategies for This Week. (Detailed in Part Two)

• HYPE Hourly Timeframe Structure Analysis. (Detailed in Part Three)

• HYPE Market Outlook and Short-Term Trading Strategies for This Week. (Detailed in Part Four)

Last Week's Trading Strategy & Core Views Market Verification:

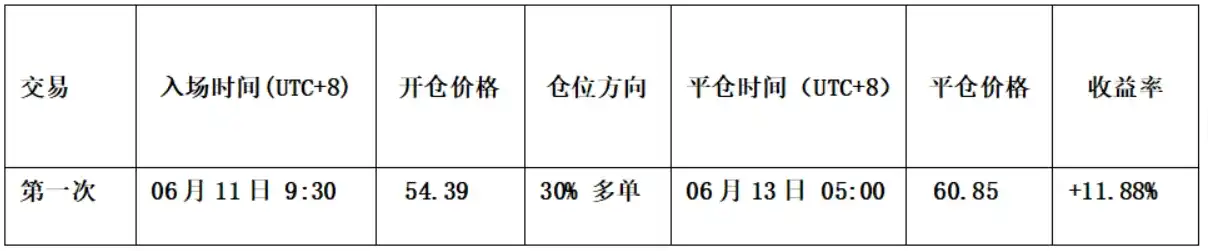
• HYPE Short-Term Trade Performance: Successfully executed one short-term long position (1x leverage) last week, achieving a profit of approximately 11.88%. (Detailed in Table One)

• BTC Market Prediction Verification: Last week's article noted that after an instantaneous dip below the $60,000 threshold, the price would find support and stage a short-term rebound to confirm the validity of the break below the key level. Current market movements have validated our previous prediction.

• HYPE Market Prediction Verification: Last week's article noted that when HYPE price retested the key support zone of $55-57, showing signs of stopping its decline and stabilizing, and combined with bottom signals triggered by two major models, a light long position could be considered. Current market movements are highly consistent with our predicted view.

One: In-Depth Analysis of Bitcoin's Hourly Timeframe Structure

Bitcoin _ 4-Hour Candlestick Chart
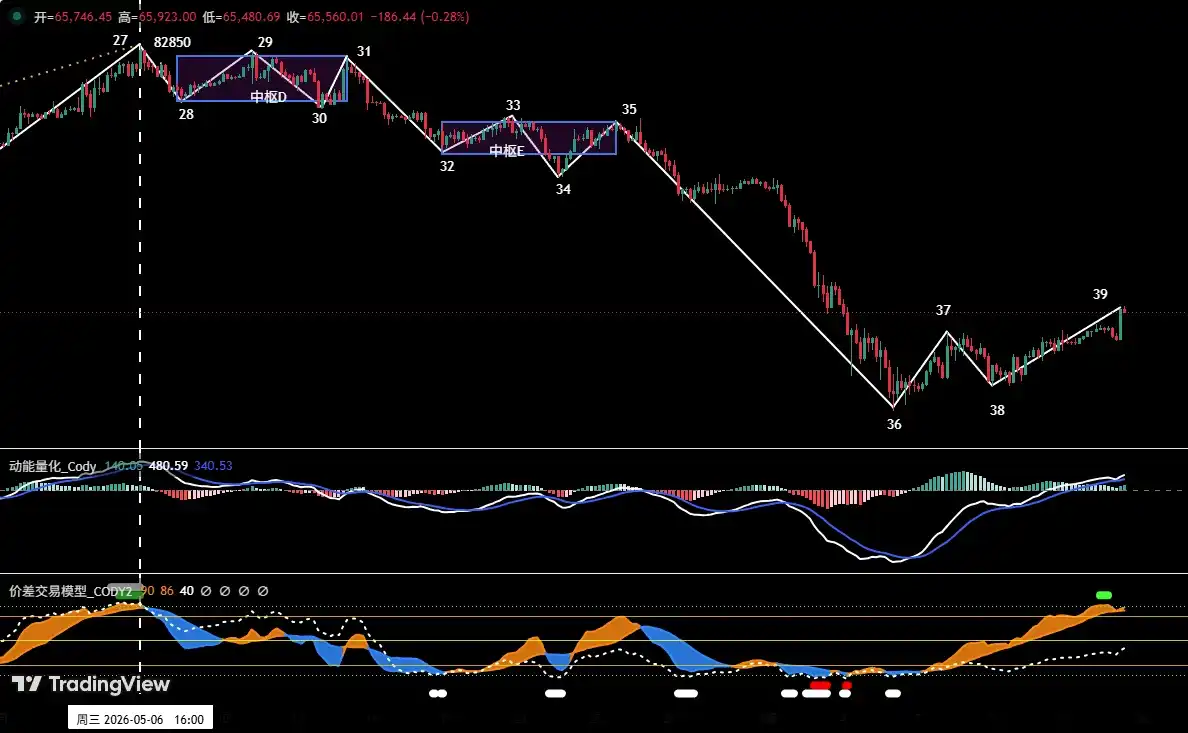
Figure One

1. As shown in (Figure One), since the high of $82,850 on May 6th, the correction in the 4-hour chart can be subdivided into a 12-stage adjustment structure. This includes two descending pivots: Pivot D and Pivot E. The overall structure is clear, presenting a typical complex correction pattern.

2. From the 4-hour structural perspective, the market is currently in the 38-39 segment rebound. The price has now broken above $65,000. If the subsequent breakout is confirmed as valid, the next key resistance for the rebound will be in the $69,500~$70,500 zone.

Two: Bitcoin's Market Outlook and Trading Strategies for This Week

1. BTC Market Outlook for This Week:

Core View This Week: Focus on the result of the price's pullback confirmation after breaking above $65,000.

• If the pullback fails to hold this level, the market may retest the core support range of $60,000~$62,000.

• If it effectively stabilizes above, it will challenge the core resistance zone of $69,500~$70,500. This area will be a key region for us to plan medium-term short positions.

2. Core Resistance Levels:

• First Resistance Zone: $69,500~$70,500 area (previous high-volume consolidation zone)

• Second Resistance Zone: $72,500~$74,500 area (previous high-volume consolidation zone)

3. Core Support Levels:

• First Support Level: Around $65,000

• Second Support Level: $59,000~$60,000 area (previous key support level)

• Third Support Level: Around $55,000 (previous key support level)

4. Trading Strategy for This Week (Excluding Impact of Sudden News)

1. Medium-Term Strategy:

Bitcoin _ Daily Candlestick Chart: (Position Monitoring Model)
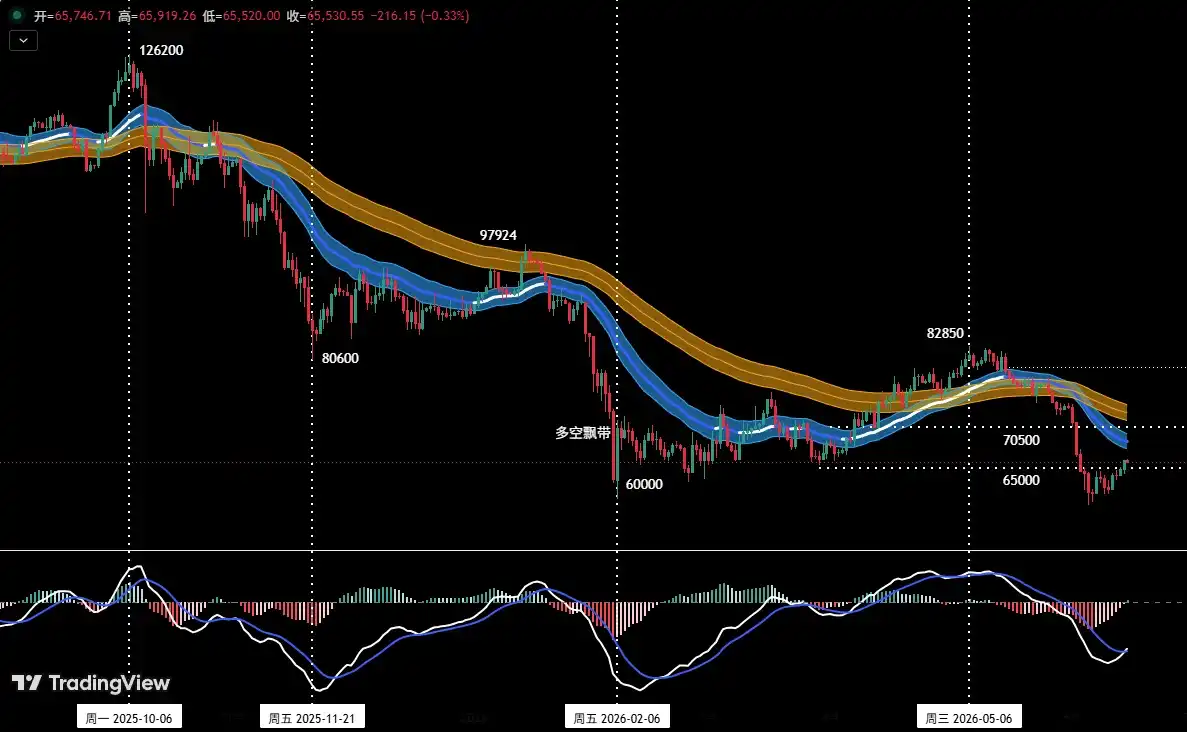
Figure Two

Position Monitoring Model: As shown in (Figure Two), the price has effectively broken below the "Bull-Bear Channel," indicating the technical structure has shifted to a bear-dominated pattern. The market did not meet our planned (short) entry conditions last week, so the medium-term position remains empty for now.

This week, based on the outcome of the battle between bulls and bears around $65,000, medium-term short positions can be built gradually according to the following three-level strategy:

Add at Strong Resistance: If the price successfully stabilizes in the $65,000 area and subsequently rallies to the $69,500~$70,500 zone, showing clear signs of resistance, consider initiating a medium-term (short) position, with total exposure controlled below 60%.

• Short on Support Break: If the price loses the $65,000 support and shows signs of a valid breakdown, preliminarily establish a 30% medium-term short position.

Short on Further Breakdown: If the price loses the $65,000 support and effectively breaks below the $59,000~$60,000 support zone, add to the short position accordingly, with total exposure controlled below 60%.

2. Short-Term Strategy: Utilize 30% of capital, set stop-losses, and seek "spread" trading opportunities based on support and resistance levels. (Using 30-minute/60-minute as the operational timeframe).

3. For dynamic response to complex market changes in short-term operations, we have prepared two specific operational plans in advance: Plan A/B.

Plan A: Enter at Strong Resistance.

• Entry: If the price successfully stabilizes in the $65,000 area and subsequently rallies near $69,500~$70,500 showing signs of stalling, combined with quantitative model top signals, consider entering a short position with exposure below 30%.

• Risk Control: Set an initial stop-loss.

• Exit: Gradually close the position for profit when the price adjusts near key support levels, combined with model signals.

Plan B: Short on Valid Support Break.

• Entry: If the price loses the $65,000 support and shows signs of a valid breakdown, consider entering a short position with exposure below 30%.

• Risk Control: Set an initial stop-loss.

• Exit: Gradually close the position for profit when the price declines to key support levels, combined with model signals.

Three: HYPE Hourly Timeframe Structure Analysis

HYPE_ 4-Hour Candlestick Chart
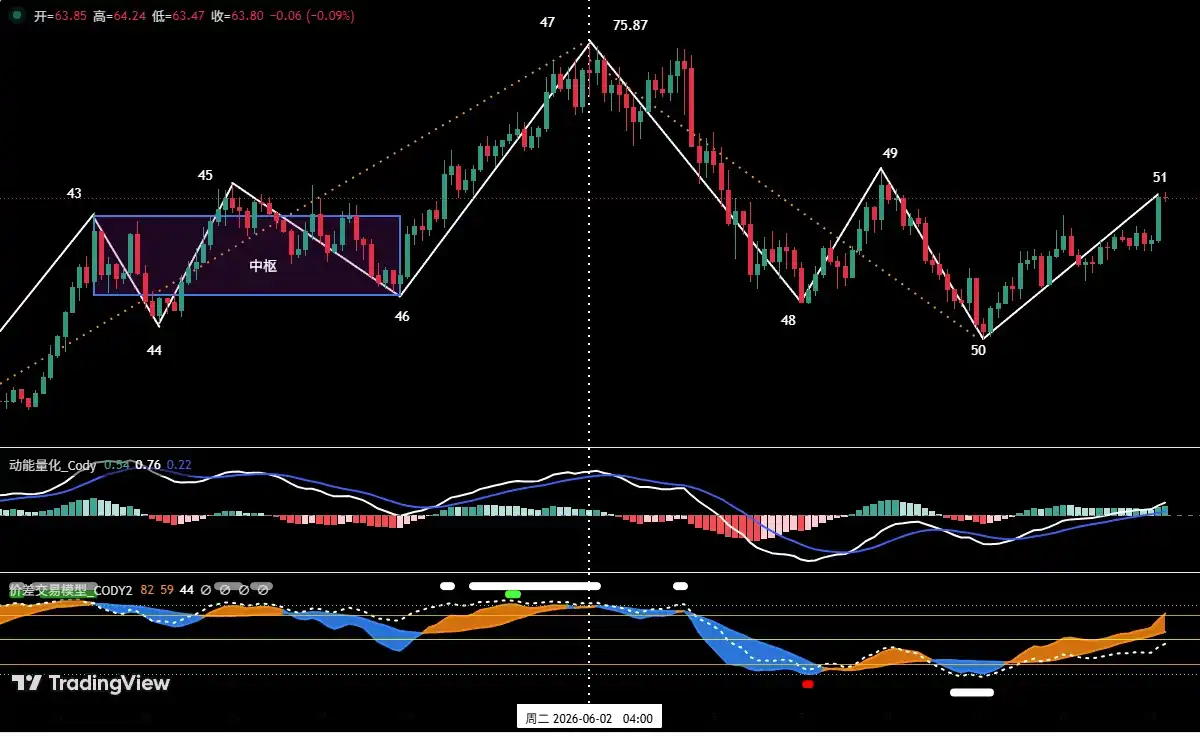
Figure Three

1. As shown in (Figure Three), in the 4-hour timeframe, HYPE's correction since the high of $75.87 on June 2nd can be subdivided into a four-stage adjustment structure: (47-48), (48-49), (49-50), (50-51).

2. Currently, HYPE price has stabilized and rebounded from the support area around $52 and is in the rebound process of segment (50-51). Its overhead resistance lies in the $62.5 to $64.57 zone. If (Endpoint 51) forms a high in this area (it is highly probable the overall structure will form a "descending pivot" here), the price will likely continue downward to seek stronger support.

Four: HYPE Market Outlook and Short-Term Trading Strategies for This Week

1. HYPE Market Outlook for This Week:

1. Core Resistance Levels:

• First Resistance Level: $62.5-64.57 area;

• Second Resistance Level: $68-70 area;

2. Core Support Levels:

• First Support Level: $52-55.5 area;

• Second Support Level: $47-49 area;

Core View on HYPE This Week:

• Observe the resistance effect in the $62.5-64.57 area and the price level at which "Endpoint 51" forms a high.

2. HYPE Short-Term Trading Strategy for This Week: (Long on Support)

This week's HYPE short-term trading should adhere to the strategy of "accumulate on dips, avoid chasing rallies."

Short-Term Strategy: Test Long on Support Zone Stabilization

When HYPE price retests the key support areas of $52-54.5 or the deeper $47-49, showing signs of stopping its decline and stabilizing, and combined with bottom signals triggered by the two major models, consider testing a light long position. Exposure must be controlled below 30%, with strict stop-loss discipline.

Five: HYPE Trade Review

1. Short-Term Trade Review: (See Table One)

We strictly followed the operational plan. Based on trading signals from our proprietary "Spread Trading Model" and "Momentum Quant Model," we executed one short-term (long) trade last week, achieving a profit of 11.88%.

2. HYPE Short-Term Trade Details Summary: (Leverage*1x)

3. Short-Term Trade Review: (See Figure Four)

1. Entry Strategy:

• A relatively complete downtrend correction structure had already occurred;

• Our proprietary "Spread Trading Model" had issued strong bottom warning signals in advance (red and white dots in the chart);

• Our proprietary "Momentum Quant Model" had issued a momentum bottom divergence signal;

Based on the above three points, we entered a 30% long position around $54.39.

2. Exit Strategy:

• The price encountered resistance when approaching $62.5;

• Our proprietary "Spread Trading Model" had issued top warning signals in advance (white dots in the chart);

• Our proprietary "Momentum Quant Model" had issued a momentum top divergence signal;

Therefore, we closed the entire position around $60.85.

3. Summary: This trade successfully yielded a profit of approximately 11.88%.

HYPE_ 30-Minute Candlestick Chart: (Momentum Quant Model + Spread Trading Model)

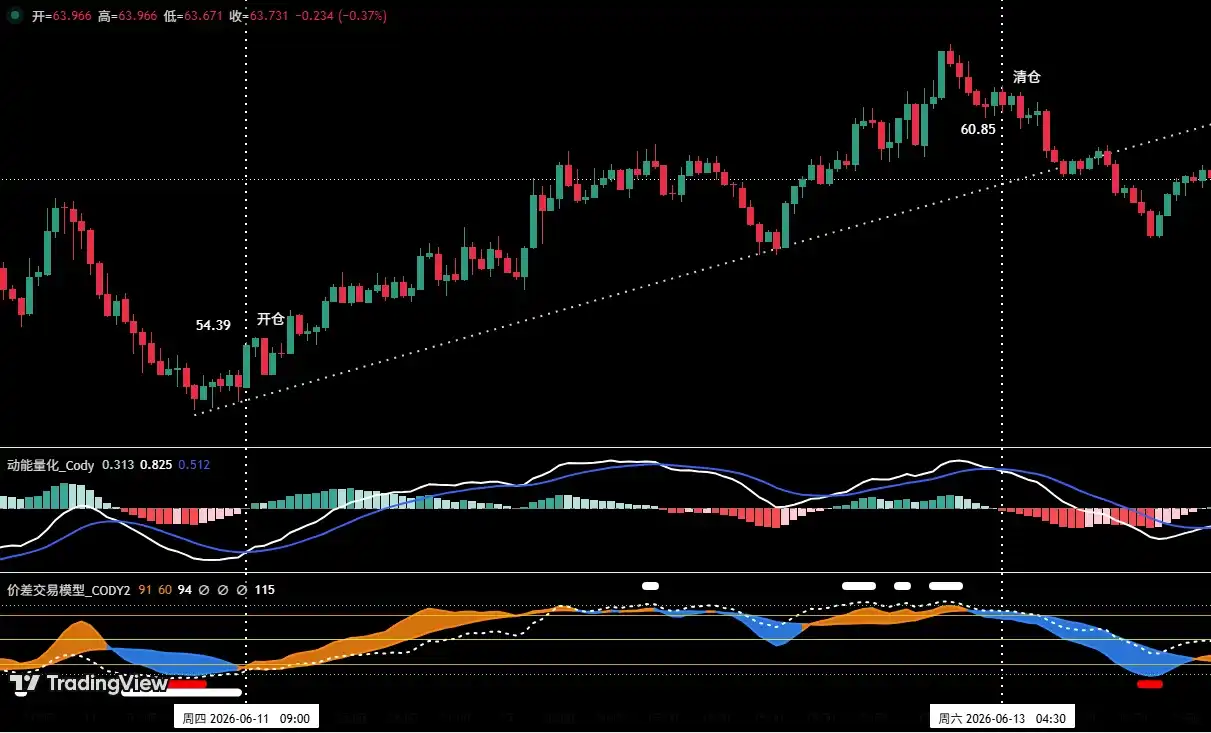
Figure Four (Short-Term Trade Illustration)

Six: Special Notes:

1. When entering a position: Immediately set an initial stop-loss.

2. When profit reaches 1%: Move the stop-loss to the entry price (breakeven point) to ensure capital safety.

3. When profit reaches 2%: Move the stop-loss to the 1% profit level.

4. Continuous Tracking: Thereafter, for every additional 1% profit, move the stop-loss up by 1% accordingly, dynamically protecting and locking in profits.

Financial markets change rapidly; all market analysis and trading strategies require dynamic adjustment. All views, analytical models, and operational strategies mentioned herein are derived from personal technical analysis, intended solely for personal trading log purposes, and do not constitute any investment advice or operational basis. The market carries risks; investment requires caution. Do not make decisions based solely on this content.

Related Questions

QAccording to the article, what is the crucial level for Bitcoin this week that will determine its subsequent direction?

AAccording to the article, the crucial level for Bitcoin this week is $65,000. The core view is to focus on the result of the price's retest and confirmation after breaking above $65,000. If it holds above this level effectively, it may challenge the $69,500-$70,500 resistance zone. If it fails and falls back below, the market may test the $60,000-$62,000 core support zone again.

QWhat is the recommended trading strategy for HYPE in the short term, as outlined in the article?

AThe recommended short-term trading strategy for HYPE is to 'buy on dips and avoid chasing rallies.' Specifically, when the HYPE price retests key support areas like $52-$54.5 or the deeper $47-$49 zone, if it shows signs of stopping the decline and stabilizing, and this is combined with bottom signals from the two proprietary models mentioned, one can consider lightly testing a long position. The position size must be controlled below 30% with strict stop-loss discipline.

QWhat two proprietary models did the analyst use for the HYPE trade execution and复盘 described in the article?

AThe analyst used two proprietary models for the HYPE trade execution and review: the 'Spread Trading Model' and the 'Dynamic Quantitative Model'.

QBased on the Bitcoin analysis, what are the two main pressure zones identified above the $65,000 level?

ABased on the Bitcoin analysis, the two main pressure zones identified above the $65,000 level are: First Pressure Zone: $69,500-$70,500 (a previous筹码密集成交区 / high-volume transaction area). Second Pressure Zone: $72,500-$74,500 (another previous筹码密集成交区 / high-volume transaction area).

QWhat is the core principle the article emphasizes for managing risk in a trade, specifically regarding stop-loss placement?

AThe article emphasizes a dynamic trailing stop-loss principle for risk management. Key steps include: 1) Set an initial stop-loss immediately upon opening a position. 2) When profit reaches 1%, move the stop-loss to the entry price (breakeven point). 3) When profit reaches 2%, move the stop-loss to lock in a 1% profit. 4) Continuously track the price, and for every additional 1% profit gained, move the stop-loss up by 1% to dynamically protect and lock in profits.

Related Reads

SemiAnalysis Dissects Huawei's Kirin 9030: Process Technology Halted, So They Folded the Chip

SemiAnalysis has published a detailed teardown report on the HiSilicon Kirin 9030 Pro chipset found in Huawei's Mate 80 Pro. Fabricated using SMIC's most advanced N+3 node without EUV lithography, the analysis reveals significant technical achievements and strategic shifts. The report indicates SMIC's N+3 has achieved transistor density comparable to TSMC's N6 (113.4 vs 107.7 MTr/mm²), primarily through aggressive use of Self-Aligned Quadruple Patterning (SAQP) for its metal layers. This results in a notably small 32.5nm M0 metal pitch. However, SemiAnalysis notes this achievement comes with significantly higher process complexity, cost, and potential yield challenges compared to competitors using more advanced tools. The Kirin 9030 design maximizes this constrained density. While its GPU performance has improved ~70% and matches Qualcomm's 2022 flagship level, the CPU core's IPC lags behind current top-tier designs from Apple and Qualcomm, a gap attributed to the underlying manufacturing technology rather than design capability. Facing long-term restrictions on advanced tools, Huawei is charting a new path. The report highlights the company's "LogicFolding" roadmap, a 3D stacking technique aimed at shortening signal paths to boost performance and efficiency. The goal is to reach 5GHz frequency and a projected density of 295 MTr/mm² by 2031. SemiAnalysis concludes that export controls have not halted China's chip progress but have fundamentally altered its trajectory, making it more expensive and complex. This has spurred innovation in alternative areas like 3D stacking and domestic EDA tool development, with Huawei's supply chain also beginning to integrate Chinese memory from CXMT.

marsbit32m ago

SemiAnalysis Dissects Huawei's Kirin 9030: Process Technology Halted, So They Folded the Chip

marsbit32m ago

How Will the Price Move Before SpaceX's Next Share Unlock?

TL;DR Investors buying SPCX after SpaceX's IPO are not simply investing in a typical tech stock. It’s a high-valuation asset driven by Musk's narrative, Starlink, and space transport potential, but with a key twist: a very small initial float of ~4% has led to significant post-listing price appreciation. The current price action reflects a timing gap. Before the first lock-up expiration (estimated around August, subject to official confirmation), scarcity and high demand could continue to push prices up. Short-term bulls focus on low float, FOMO, and potential index inclusion. However, bears point to the supply dynamics that will change post-lockup. Existing shareholders still hold over 95% of shares, which will be released in stages starting from the first unlock window. This introduces future selling pressure from low-cost holders. The upcoming Q2 earnings report is a critical catalyst before the unlock. It will test whether the company's fundamentals can justify the current ~$2.1T valuation. Strong results could support the pre-unlock momentum, while weak figures could amplify concerns about future supply. The trading thesis is shifting from immediate scarcity ("can't buy enough") to evaluating future absorption capacity ("who will buy when more supply hits"). The path ahead hinges on the specifics of the unlock schedule, Q2 earnings performance, and whether anticipated passive index buying materializes.

marsbit52m ago

How Will the Price Move Before SpaceX's Next Share Unlock?

marsbit52m ago

Bitcoin Short-Term Bullish Structure Validated, HYPE Low-Entry Window Opens | Guest Analysis

**Market Analysis Summary (Week of June 2026)** **Overall Market Context:** The market environment is exceptionally complex, with the unexpected US-Iran agreement and the reopening of the Strait of Hormuz triggering a global asset repricing and significant volatility. This heightened noise underscores the importance of a structured analytical framework. **Bitcoin (BTC) Analysis & Strategy:** * **Current Status:** The price has climbed above $65,000, currently in a rebound phase (segment 38-39) following a complex 12-segment correction from the May high of $82,850. * **Key Levels:** * **Primary Resistance:** $69,500–$70,500. A successful breakout above $65,000 targets this zone. * **Primary Support:** $65,000 (immediate), followed by $59,000–$60,000 and $55,000. * **Weekly Outlook & Strategy:** The focus is on the confirmation of the $65,000 level. * **Bullish Scenario (Hold $65K):** A move toward the $69.5K–$70.5K resistance zone is anticipated, which is a potential area for initiating medium-term short positions. * **Bearish Scenario (Break below $65K):** A retest of the $60,000–$62,000 support range is likely. * **Medium-Term Strategy:** Currently neutral. Plan to establish short positions (up to 60% allocation) either in the $69.5K–$70.5K resistance zone upon signs of rejection, or on a confirmed breakdown below $65,000 and further below $59K–$60K. * **Short-Term Strategy:** Utilize 30% capital for scalping opportunities based on support/resistance levels, using 30/60-minute charts. **HYPE Analysis & Strategy:** * **Current Status:** The price has stabilized around $52 after a four-segment decline from the June high of $75.87 and is now in a rebound (segment 50-51). * **Key Levels:** * **Primary Resistance:** $62.50–$64.57. Watch for potential rejection here to form a lower high. * **Primary Support:** $52–$55.50, followed by $47–$49. * **Weekly Outlook & Strategy:** Adopt a "buy on dips, avoid chasing rallies" approach. * **Core View:** Monitor the price action and potential formation of a lower high ("endpoint 51") in the $62.50–$64.57 resistance zone. * **Short-Term Strategy:** Consider light long positions (max 30% allocation) if the price finds support and shows reversal signals in the $52–$54.50 or deeper $47–$49 support zones, confirmed by proprietary quantitative bottom signals. **Trade Review:** Last week's HYPE short-term long trade, executed based on proprietary "Price Difference" and "Momentum" model signals, yielded a profit of approximately 11.88%. The entry was near $54.39 and exit near $60.85. **Risk Management Reminder:** Always set an initial stop-loss upon entry. Move stop-loss to breakeven at +1% profit, then trail it upwards to lock in gains as the trade progresses. *Disclaimer: All analysis, models, and strategies are based on personal technical analysis for educational purposes only, not investment advice. The market carries inherent risk.*

Odaily星球日报57m ago

Bitcoin Short-Term Bullish Structure Validated, HYPE Low-Entry Window Opens | Guest Analysis

Odaily星球日报57m ago

Trading

Spot
Futures

Hot Articles

What is $BITCOIN

DIGITAL GOLD ($BITCOIN): A Comprehensive Analysis Introduction to DIGITAL GOLD ($BITCOIN) DIGITAL GOLD ($BITCOIN) is a blockchain-based project operating on the Solana network, which aims to combine the characteristics of traditional precious metals with the innovation of decentralized technologies. While it shares a name with Bitcoin, often referred to as “digital gold” due to its perception as a store of value, DIGITAL GOLD is a separate token designed to create a unique ecosystem within the Web3 landscape. Its goal is to position itself as a viable alternative digital asset, although specifics regarding its applications and functionalities are still developing. What is DIGITAL GOLD ($BITCOIN)? DIGITAL GOLD ($BITCOIN) is a cryptocurrency token explicitly designed for use on the Solana blockchain. In contrast to Bitcoin, which provides a widely recognized value storage role, this token appears to focus on broader applications and characteristics. Notable aspects include: Blockchain Infrastructure: The token is built on the Solana blockchain, known for its capacity to handle high-speed and low-cost transactions. Supply Dynamics: DIGITAL GOLD has a maximum supply capped at 100 quadrillion tokens (100P $BITCOIN), although details regarding its circulating supply are currently undisclosed. Utility: While precise functionalities are not explicitly outlined, there are indications that the token could be utilized for various applications, potentially involving decentralized applications (dApps) or asset tokenization strategies. Who is the Creator of DIGITAL GOLD ($BITCOIN)? At present, the identity of the creators and development team behind DIGITAL GOLD ($BITCOIN) remains unknown. This situation is typical among many innovative projects within the blockchain space, particularly those aligning with decentralized finance and meme coin phenomena. While such anonymity may foster a community-driven culture, it intensifies concerns about governance and accountability. Who are the Investors of DIGITAL GOLD ($BITCOIN)? The available information indicates that DIGITAL GOLD ($BITCOIN) does not have any known institutional backers or prominent venture capital investments. The project seems to operate on a peer-to-peer model focused on community support and adoption rather than traditional funding routes. Its activity and liquidity are primarily situated on decentralized exchanges (DEXs), such as PumpSwap, rather than established centralized trading platforms, further highlighting its grassroots approach. How DIGITAL GOLD ($BITCOIN) Works The operational mechanics of DIGITAL GOLD ($BITCOIN) can be elaborated on based on its blockchain design and network attributes: Consensus Mechanism: By leveraging Solana’s unique proof-of-history (PoH) combined with a proof-of-stake (PoS) model, the project ensures efficient transaction validation contributing to the network's high performance. Tokenomics: While specific deflationary mechanisms have not been extensively detailed, the vast maximum token supply implies that it may cater to microtransactions or niche use cases that are still to be defined. Interoperability: There exists the potential for integration with Solana’s broader ecosystem, including various decentralized finance (DeFi) platforms. However, the details regarding specific integrations remain unspecified. Timeline of Key Events Here is a timeline that highlights significant milestones concerning DIGITAL GOLD ($BITCOIN): 2023: The initial deployment of the token occurs on the Solana blockchain, marked by its contract address. 2024: DIGITAL GOLD gains visibility as it becomes available for trading on decentralized exchanges like PumpSwap, allowing users to trade it against SOL. 2025: The project witnesses sporadic trading activity and potential interest in community-led engagements, although no noteworthy partnerships or technical advancements have been documented as of yet. Critical Analysis Strengths Scalability: The underlying Solana infrastructure supports high transaction volumes, which could enhance the utility of $BITCOIN in various transaction scenarios. Accessibility: The potential low trading price per token could attract retail investors, facilitating wider participation due to fractional ownership opportunities. Risks Lack of Transparency: The absence of publicly known backers, developers, or an audit process may yield skepticism regarding the project's sustainability and trustworthiness. Market Volatility: The trading activity is heavily reliant on speculative behavior, which can result in significant price volatility and uncertainty for investors. Conclusion DIGITAL GOLD ($BITCOIN) emerges as an intriguing yet ambiguous project within the rapidly evolving Solana ecosystem. While it attempts to leverage the “digital gold” narrative, its departure from Bitcoin's established role as a store of value underscores the need for a clearer differentiation of its intended utility and governance structure. Future acceptance and adoption will likely depend on addressing the current opacity and defining its operational and economic strategies more explicitly. Note: This report encompasses synthesised information available as of October 2023, and developments may have transpired beyond the research period.

363 Total ViewsPublished 2025.05.13Updated 2025.05.13

What is $BITCOIN

Discussions

Welcome to the HTX Community. Here, you can stay informed about the latest platform developments and gain access to professional market insights. Users' opinions on the price of BTC (BTC) are presented below.

活动图片