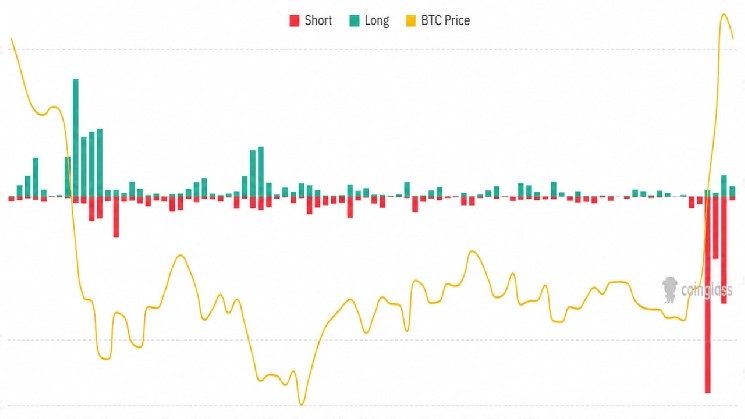
Conviction in a risk-off market is often the hallmark of long-term strength.
Bitcoin’s [BTC] current setup reflects that conviction. Technically, BTC has posted three straight quarterly losses, with an average decline of around 20% each quarter. It’s the first three-quarter losing streak since the 2022 bear market, leaving more than 50% of Bitcoin’s circulating supply underwater and putting long-term holders (LTHs) firmly in focus.
The logic is simple: LTHs now control 78% of Bitcoin’s circulating supply. In other words, a large share of the underwater supply is held by investors who have held BTC for more than five months, covering the rally to its $126,000 all-time high and the subsequent correction to around $60,000. That makes their conviction a key factor in shaping Bitcoin’s Q3-Q4 outlook.
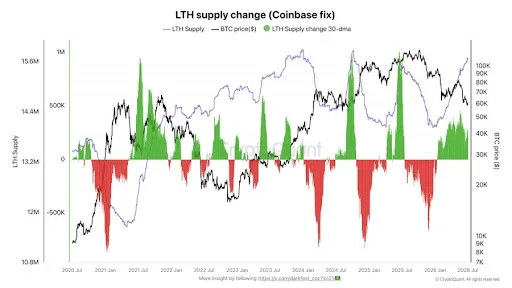
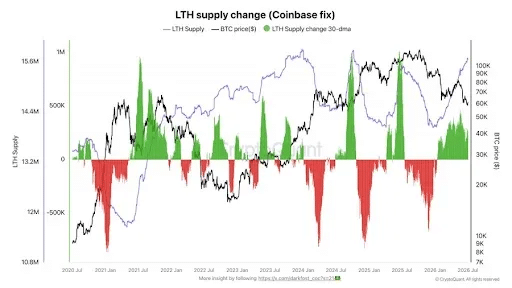
Notably, what’s standing out is that long-term holders aren’t selling into the weakness.
Instead, they’re absorbing it. Despite the correction, LTH supply reached a record high in June, reinforcing the view that these investors continue to accumulate rather than exit. Historically, Bitcoin has tended to bottom when long-term holders begin to capitulate. So far, this cycle is unfolding differently.
That said, long-term holders remain highly sensitive to macroeconomic developments, as they tend to price in the broader economic outlook when positioning their portfolios. From that perspective, Bitcoin’s capitulation phase may not be over yet.
Why Bitcoin’s strongest cohort may soon face their toughest test
Bitcoin’s past bear markets provide a useful benchmark for the current cycle.
Before drawing parallels, though, it’s worth looking at what’s changed on the macro front. Fed rate expectations for the July and September FOMC meetings have shifted noticeably. For July, there’s a 77% probability the Fed keeps rates unchanged, while the odds of a 25-basis-point hike stand at 23%.
By September, the picture becomes more balanced. Markets are pricing a 41% chance of no change, a 47% probability of a 25 bps hike, and a 10.5% chance of a 50 bps hike. In other words, markets are increasingly positioning for tighter financial conditions into the fall rather than the rate cuts many had anticipated.
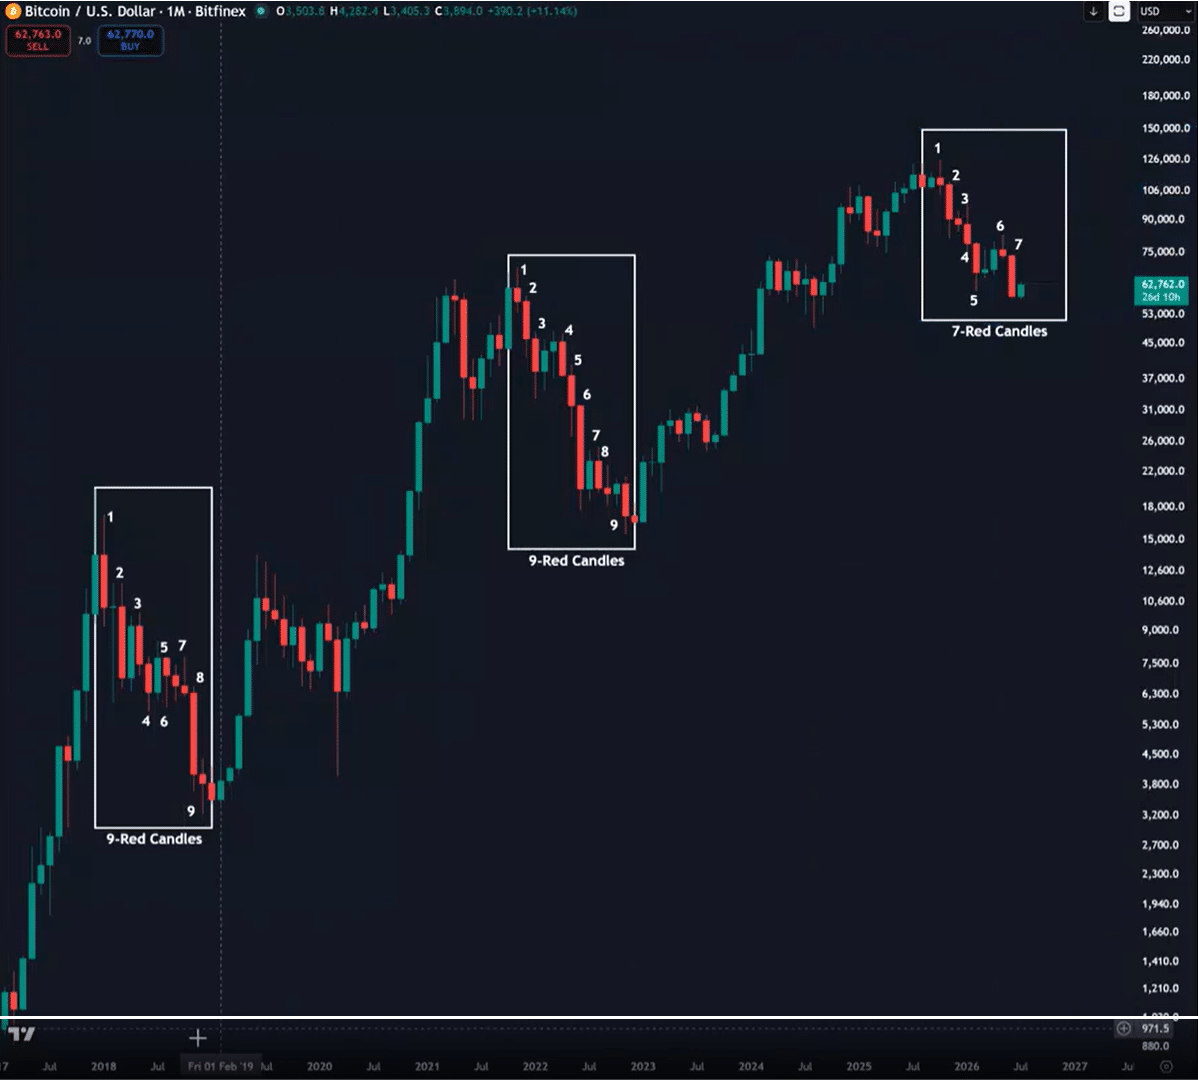
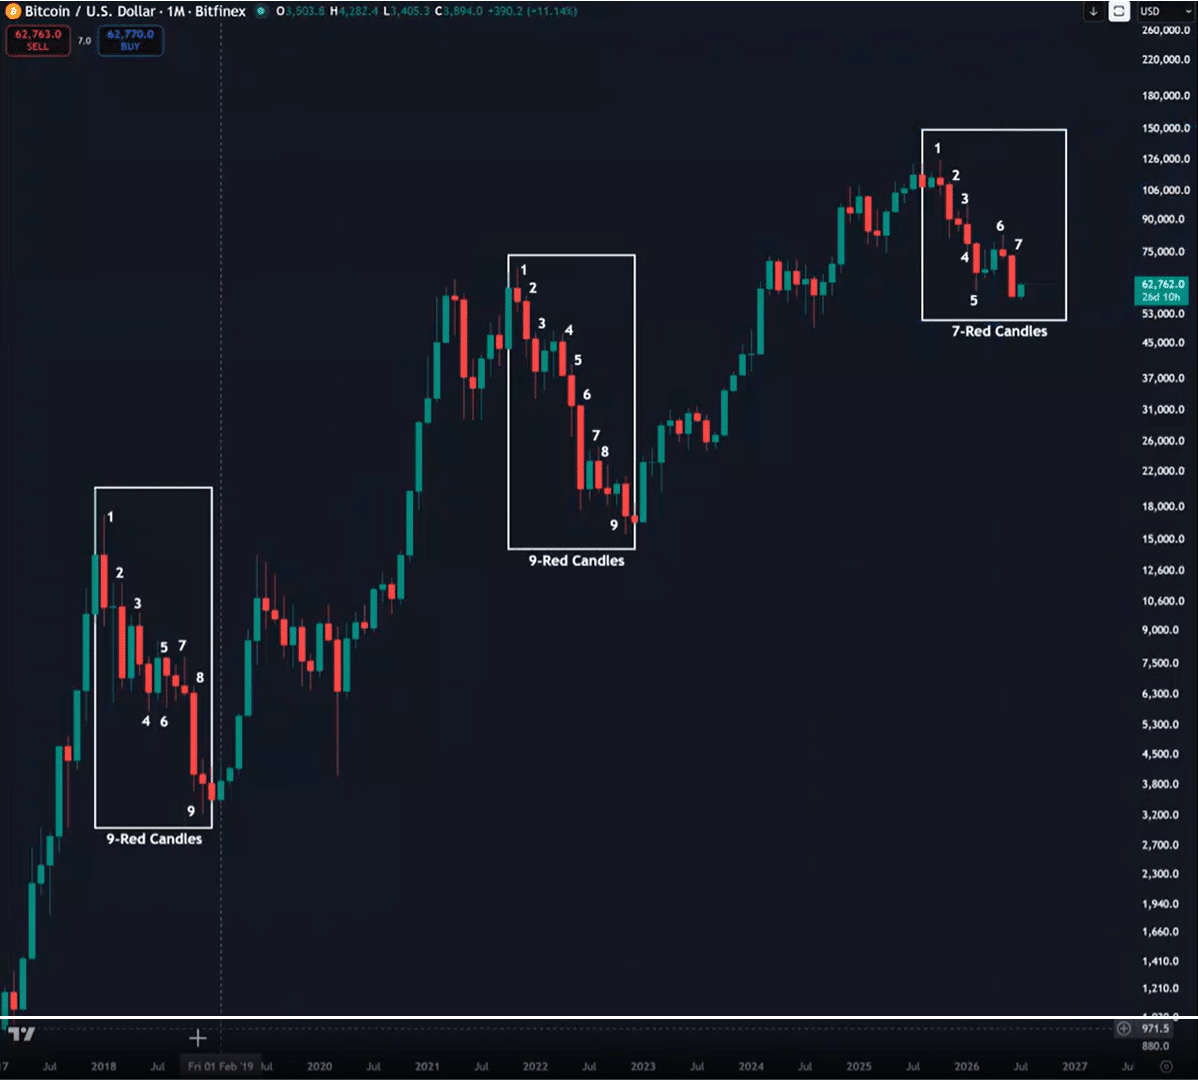
That shift makes Bitcoin’s previous bear markets a relevant reference point.
As the chart above shows, both the 2018 and 2022 bear cycles didn’t bottom until BTC had printed nine consecutive monthly red candles. The current cycle has produced seven so far. If the historical pattern holds, Bitcoin’s capitulation phase may still have room to run before a durable bottom is established.
That’s where the expanding pool of underwater long-term holders meets an increasingly uncertain macro backdrop. If this cycle follows the same script, long-term holder capitulation could mark Bitcoin’s final washout, potentially sending BTC toward the $50,000 region by the end of Q3 before a bottom takes shape.