Bitcoin Created An Imperfection And The Price Will Crash Lower To Fill It

bitcoinistPublished on 2026-04-24Last updated on 2026-04-24

Abstract

Bitcoin's recent rally to over $79,000 created a price imbalance, or "imperfection," that analysts argue is likely to be filled. According to crypto analyst Minga, a head-and-shoulders pattern is forming on the 4-hour chart, with a rejection zone between $76,800 and $77,400. If completed, this bearish pattern could lead to a breakdown, targeting support near $70,450. Key levels to watch are the monthly high of $76,053; a break below it would confirm the downtrend, while a push above $78,332 could invalidate the bearish outlook and target the fair value gap above $79,000. Bitcoin is currently trading near the upper rejection zone at around $77,640.

Bitcoin’s recent price has carried the price action into a zone that one analyst believes was never meant to hold. The cryptocurrency climbed to $78,000 over the weekend and even pushed above $79,380 in the past 24 hours.

Technical analysis shows that in doing so, it left behind an unresolved imperfection, which is a price imbalance that markets have a well-documented tendency to revisit.

The Weekend Rally Left Behind A Debt

Crypto analyst Minga, writing on X, identified a dynamic playing out on Bitcoin’s 4-hour candlestick timeframe chart. According to the analyst, BTC is currently in the process of filling the imbalance created over the weekend. The development visible on Minga’s chart is the formation of a head-and-shoulders pattern, which is one of the most reliable bearish reversal signals in technical analysis.

The left shoulder and the head have already formed, and Bitcoin is now in the process of completing the right shoulder. The analyst identified a rejection zone between $76,800 and $77,400, which is shown on the chart below in red, as the area where that right shoulder is most likely to top out.

Source: Chart from Minga on X

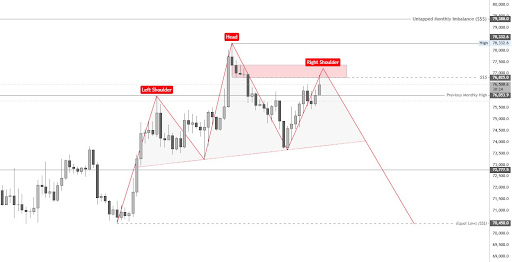
If this formation completes, it would signal a change from upward momentum into distribution, where larger players begin offloading positions. The neckline of this pattern sits around the mid-$73,000 region, which also coincides with a rising trendline that has supported price in recent sessions.

Where Does Bitcoin Go From Here?

This technical analysis proposes that the current push higher might only be a retest, and once the right shoulder is complete, the structure calls for a breakdown. The important level to watch on the way down is the previous monthly high, currently sitting at $76,053.

According to Minga, a rejection at the $76,800 to $77,400 red box must be followed by a break below that monthly high on the subsequent revisit. Should the pattern play out as the analyst projected, the chart points toward two notable downside reference points. The first reference point is the equal low level around $70,450, which is labeled on the chart above as a liquidity target.

Failure to break below the previous monthly high at $76,053 would invalidate the bearish scenario and give us another push toward the highs to take out the Monthly FVG above $79,000.

The second reference point is an untapped monthly imbalance of $79,388, which represents the opposing scenario. If Bitcoin instead breaks above $78,332 and acceptance is established above that level, the monthly fair value gap becomes the next logical target to the upside.

At the time of writing, Bitcoin is trading at $77,640, just above the rejection zone between $76,800 and $77,400.

BTC trading at $77,371 on the 1D chart | Source: BTCUSDT on Tradingview.com

Related Questions

QWhat is the main technical pattern that analyst Minga identifies on Bitcoin's 4-hour chart, and what does it typically signal?

AMinga identifies a head-and-shoulders pattern forming on Bitcoin 4-hour chart, which is one of the most reliable bearish reversal signals in technical analysis, indicating a potential change from upward momentum into distribution.

QAccording to the analyst, what is the specific price rejection zone where the right shoulder of the pattern is likely to top out?

AThe analyst identified a rejection zone between $76,800 and $77,400 as the area where the right shoulder is most likely to top out.

QWhat is the critical neckline level for the head-and-shoulders pattern, and what other significant level does it coincide with?

AThe neckline of the pattern sits around the mid-$73,000 region, which also coincides with a rising trendline that has supported the price in recent sessions.

QWhat are the two key downside reference points mentioned if the bearish pattern completes, and what is the first one labeled as?

AThe two downside reference points are the equal low level around $70,450, which is labeled as a liquidity target, and the untapped monthly imbalance at $79,388, which represents the opposing bullish scenario.

QWhat price level would need to be broken to invalidate the bearish scenario and lead to another push toward the highs?

AA failure to break below the previous monthly high at $76,053 would invalidate the bearish scenario and lead to another push toward the highs to take out the Monthly FVG (Fair Value Gap) above $79,000.

Related Reads

Anthropic Cries Wolf: Is the AGI Threat Real, or Just an IPO Story?

Anthropic has published an article titled "When AI builds itself," discussing the emerging concept of "recursive self-improvement," where AI begins to actively participate in designing, training, testing, and optimizing its own subsequent versions. The company presents internal data showing that by May 2026, over 80% of code merged into its codebase was written by Claude, its AI model. Claude's capabilities have expanded to handling complex, open-ended engineering tasks, achieving a 76% success rate in such areas, and even contributing to research processes, such as optimizing code performance and conducting AI safety experiments. Anthropic outlines an evolution from human-driven development to AI-assisted workflows, culminating in the current stage where AI agents can autonomously write, run, and delegate code. The company cautions that the path toward a "closed loop," where AI continuously improves itself, is becoming visible. It calls for coordinated global mechanisms to potentially slow or pause frontier AI development to allow safety research and societal structures to catch up. However, the timing of this warning coincides with Anthropic's preparations for an IPO, framing the narrative not just as a safety concern but also as a demonstration of Claude's advanced capabilities and its integral role in accelerating Anthropic's own R&D—creating a potential "flywheel" effect for competitive advantage. This contrasts with OpenAI's recent, more policy-oriented discussion of the same risks, highlighting the competitive dynamics in the AI industry as companies position themselves in both the technological and regulatory landscape.

marsbit22m ago

Anthropic Cries Wolf: Is the AGI Threat Real, or Just an IPO Story?

marsbit22m ago

BIT Research: ETF Purchases Have Slowed, Strategy (MicroStrategy) Has Slowed, What Else Can Drive Bitcoin's Rise?

Market Refocus on Inflation and Rate Expectations Weighs on Bitcoin Currently, the market is in a phase of macro-repricing dominated by inflation and interest rate expectations. Bitcoin, which previously benefited from easy liquidity and low inflation, is seeing its core bullish drivers weaken. These drivers were market expectations for interest rate cuts and strong inflows from Bitcoin ETFs and institutions like MicroStrategy (referred to as "Strategy" in the text). The logic has shifted. Recent high inflation data (e.g., CPI hitting 3.8% in a May 2026 report) has caused the market to sharply reduce its rate cut expectations for 2025 and even price in potential hikes. This is a key constraint for Bitcoin, as it lacks cash flows and is highly sensitive to rate expectations. Concurrently, institutional capital flows have slowed significantly. Following the hot CPI data, Bitcoin ETFs saw accelerated outflows, with around $4.3 billion leaving over a period. MicroStrategy's ability to keep adding substantial Bitcoin to its balance sheet is also diminishing. Together, ETF and MicroStrategy holdings total roughly $110 billion, but their momentum as growth engines is cooling. In summary, Bitcoin's current pressure stems not from its own fundamentals but from a changing macro environment. As long as inflation stays elevated, Bitcoin is likely to remain in a consolidating phase. However, historically, inflation eventually peaks. Once it recedes and rate cut expectations rebuild, institutional capital could return, potentially fueling a new and more robust recovery phase for Bitcoin.

marsbit30m ago

BIT Research: ETF Purchases Have Slowed, Strategy (MicroStrategy) Has Slowed, What Else Can Drive Bitcoin's Rise?

marsbit30m ago

Earning 1000 Trillion in Half a Year, 'Pocketing' 20 Million per Capita: This Round of Wealth Creation in the Korean Stock Market is Unprecedented in Scale

The South Korean stock market is experiencing an unprecedented wealth surge in 2026, with household equity and fund asset values soaring by over 1,000 trillion KRW (~$730bn) year-to-date. This translates to an average per capita wealth increase of roughly 20 million KRW, fueled by a historic 109% rally in the KOSPI index. The boom is driven by three converging forces: an AI-driven semiconductor supercycle boosting giants like Samsung and SK Hynix; the government's "Value-Up" market reforms addressing long-standing corporate governance issues; and aggressive real estate regulations that have locked capital within financial markets, preventing profits from flowing back into property. This has triggered a wealth effect, boosting high-end consumption significantly. However, the gains are highly concentrated. The two semiconductor behemoths account for over half the index's value, but retail investors own relatively low stakes in them, systematically missing the biggest rallies. Wealth and consumption benefits are skewed towards luxury goods and imported cars, bypassing mainstream retail. Further risks stem from excessive leverage, with high trading volume in leveraged ETFs, and a market sentiment heavily reliant on the AI sector's fortunes and speculative rumors. While this cycle marks a potential shift from real estate to equities as a primary wealth generator for Koreans, its sustainability, amid structural imbalances and leverage, remains a critical test.

marsbit35m ago

Earning 1000 Trillion in Half a Year, 'Pocketing' 20 Million per Capita: This Round of Wealth Creation in the Korean Stock Market is Unprecedented in Scale

marsbit35m ago

Trading

Spot
Futures

Hot Articles

What is $BITCOIN

DIGITAL GOLD ($BITCOIN): A Comprehensive Analysis Introduction to DIGITAL GOLD ($BITCOIN) DIGITAL GOLD ($BITCOIN) is a blockchain-based project operating on the Solana network, which aims to combine the characteristics of traditional precious metals with the innovation of decentralized technologies. While it shares a name with Bitcoin, often referred to as “digital gold” due to its perception as a store of value, DIGITAL GOLD is a separate token designed to create a unique ecosystem within the Web3 landscape. Its goal is to position itself as a viable alternative digital asset, although specifics regarding its applications and functionalities are still developing. What is DIGITAL GOLD ($BITCOIN)? DIGITAL GOLD ($BITCOIN) is a cryptocurrency token explicitly designed for use on the Solana blockchain. In contrast to Bitcoin, which provides a widely recognized value storage role, this token appears to focus on broader applications and characteristics. Notable aspects include: Blockchain Infrastructure: The token is built on the Solana blockchain, known for its capacity to handle high-speed and low-cost transactions. Supply Dynamics: DIGITAL GOLD has a maximum supply capped at 100 quadrillion tokens (100P $BITCOIN), although details regarding its circulating supply are currently undisclosed. Utility: While precise functionalities are not explicitly outlined, there are indications that the token could be utilized for various applications, potentially involving decentralized applications (dApps) or asset tokenization strategies. Who is the Creator of DIGITAL GOLD ($BITCOIN)? At present, the identity of the creators and development team behind DIGITAL GOLD ($BITCOIN) remains unknown. This situation is typical among many innovative projects within the blockchain space, particularly those aligning with decentralized finance and meme coin phenomena. While such anonymity may foster a community-driven culture, it intensifies concerns about governance and accountability. Who are the Investors of DIGITAL GOLD ($BITCOIN)? The available information indicates that DIGITAL GOLD ($BITCOIN) does not have any known institutional backers or prominent venture capital investments. The project seems to operate on a peer-to-peer model focused on community support and adoption rather than traditional funding routes. Its activity and liquidity are primarily situated on decentralized exchanges (DEXs), such as PumpSwap, rather than established centralized trading platforms, further highlighting its grassroots approach. How DIGITAL GOLD ($BITCOIN) Works The operational mechanics of DIGITAL GOLD ($BITCOIN) can be elaborated on based on its blockchain design and network attributes: Consensus Mechanism: By leveraging Solana’s unique proof-of-history (PoH) combined with a proof-of-stake (PoS) model, the project ensures efficient transaction validation contributing to the network's high performance. Tokenomics: While specific deflationary mechanisms have not been extensively detailed, the vast maximum token supply implies that it may cater to microtransactions or niche use cases that are still to be defined. Interoperability: There exists the potential for integration with Solana’s broader ecosystem, including various decentralized finance (DeFi) platforms. However, the details regarding specific integrations remain unspecified. Timeline of Key Events Here is a timeline that highlights significant milestones concerning DIGITAL GOLD ($BITCOIN): 2023: The initial deployment of the token occurs on the Solana blockchain, marked by its contract address. 2024: DIGITAL GOLD gains visibility as it becomes available for trading on decentralized exchanges like PumpSwap, allowing users to trade it against SOL. 2025: The project witnesses sporadic trading activity and potential interest in community-led engagements, although no noteworthy partnerships or technical advancements have been documented as of yet. Critical Analysis Strengths Scalability: The underlying Solana infrastructure supports high transaction volumes, which could enhance the utility of $BITCOIN in various transaction scenarios. Accessibility: The potential low trading price per token could attract retail investors, facilitating wider participation due to fractional ownership opportunities. Risks Lack of Transparency: The absence of publicly known backers, developers, or an audit process may yield skepticism regarding the project's sustainability and trustworthiness. Market Volatility: The trading activity is heavily reliant on speculative behavior, which can result in significant price volatility and uncertainty for investors. Conclusion DIGITAL GOLD ($BITCOIN) emerges as an intriguing yet ambiguous project within the rapidly evolving Solana ecosystem. While it attempts to leverage the “digital gold” narrative, its departure from Bitcoin's established role as a store of value underscores the need for a clearer differentiation of its intended utility and governance structure. Future acceptance and adoption will likely depend on addressing the current opacity and defining its operational and economic strategies more explicitly. Note: This report encompasses synthesised information available as of October 2023, and developments may have transpired beyond the research period.

363 Total ViewsPublished 2025.05.13Updated 2025.05.13

What is $BITCOIN

Discussions

Welcome to the HTX Community. Here, you can stay informed about the latest platform developments and gain access to professional market insights. Users' opinions on the price of BTC (BTC) are presented below.

活动图片